Z-Scan technique: To measure the total protein and albumin
in blood
A.N.Dhinaa, P.K.Palanisamy*
Department of Physics, Anna University Chennai, Chennai, India. Email: profpkpannauniv@yahoo.co.in
Received19 December 2009; revised 28 December 2009; accepted 4 January 2010.
ABSTRACT
Z-scan technique is an effective tool for measuring the optical nonlinearity of the materials. By using this technique the measurement was made for total pro-tein and albumin. The nonlinear refractive index of the total protein and albumin were found to vary linearly with concentration. Hence by calculating the nonlinear refractive index it is possible to measure their concentration in the sample. The values meas-ured thus are found in equivalence with conventional colorimetric method.
Keywords:Z-scan Technique; Nonlinear Refractive Index; Total Protein; Albumin
1. INTRODUCTION
Protein is an essential nutrient made up of building- block chemicals called amino acids. Protein provides energy and is needed for the body to make new cells, to maintain and rebuild muscles, to carry other nutrients, to act as messengers in the body, and to support the immune system. A total serum protein test measures the total amount of protein in the blood. It also measures the amounts of two major groups of proteins in the blood: albumin and globulin.
Albumin is made mainly in the liver. It helps keep to the blood from leaking out of blood vessels. Albumin also helps to carry some medicines and other substances through the blood and is important for tissue growth and healing.
Globulin is made up of different proteins called alpha, beta, and gamma types. Some globulins are made by the liver, while others are made by the immune system. Certain globulins bind with hemoglobin. Other globulins transport metals such as iron in the blood and help fight infection.
Low total protein levels can suggest a liver disorder, a kidney disorder, or a disorder in which protein is not digested or absorbed properly. Low levels may be seen in severe malnutrition and with conditions that cause
malabsorption, such as Celiac disease or inflammatory bowel disease (IBD). High total protein levels may be seen with chronic inflammation or infections such as viral hepatitis or HIV. They may be caused by bone marrow disorders such as multiple myeloma.
Measurements of protein may reflect liver disease, nutritional state, kidney disease and others. A decreased value of total protein may indicate liver or kidney disease. If levels of albumin are low, there is a possi- bility of primary liver disease, kidney disease, tissue damage or inflammation, and malnutrition [1,2]. In chronic liver diseases like “cirrhosis” or “nephrotic synd- rome” the level is decreased. Poor nutrition or protein catabolism may cause “hypoalbuminaemia”. Measurement of serum-total protein is useful in conditions relating to changes in plasma or fluid volumes, such as shock and dehydration. In these conditions concentration of serum-total protein is elevated indicating hemoconcen- tration. Haemodilution is reflected as relative hypoprotei- nemia, which occurs with water intoxication or salt retention syndrome, during massive intravenous infusions.
The most widely accepted assays so far for proteins are the Biuret [3], Lowry [4], Bradford [5,6], Bromop- henol Blue [7] and Bromocresol Green[8] methods. In this Biuret reaction is highly susceptible to interference by non-protein substances [9,10,11,12]. The bromocresol green method for determination of serum albumin is the most specific and sensitive of the dye binding techniques [13]. The glyoxylic acid method measures tryptophan content which represents 8-10% albumin and 90-91% globulin. Since the bromocresol green method is specific and simple, it is the method of choice for albumin determination [14].
cal-Copyright © 2010 SciRes JBiSE culate the nonlinear refractive index (n2). Already work
has been done on measurement of glucose [21], total cholesterol and triglycerides [22].
The single beam Z-scan analysis, which was developed by Mansoor Sheik Bahae et al. [23], is a simple and effective tool for determining nonlinear optical proper-ties of materials [24,25,26,27]. This approach has been now a day widely used in optical characterization of differ-ent materials. Nonlinear refractive index is proportional to the real part of the third-order susceptibility Re[χ(3)]. Ba-sically, the Z-scan method consists in translating a non- linear sample through the focal plane of a tightly focused Gaussian laser beam and monitoring the changes in the far field intensity pattern. For a purely refractive nonlin-earity, the light field induces an intensity dependent non- linear phase and, as consequence of the transverse Gaus-sian intensity profile, the sample presents a lens-like behavior. The induced self-phase modulation has the ten-dency of defocusing or recollimating the incident beam, depending on its Z position with respect to the focal plane. By monitoring the transmittance change through a small circular aperture placed at the far field position, it is possible to determine the nonlinear refractive index. In the present study, we have measured total protein and al-bumin levels in blood by calculating the nonlinear re-fractive index (n2) value using a single beam Z-scan
method.
2. METHODOLOGY
2.1. Preparation of Total Protein Sample
For sample preparation (Total Protein-Biuret method - a kit supplied by Transasia Bio-medicals Ltd, Baddi, Himachal Pradesh, India) was used. To 20 microliter of the serum one milliliter of total protein reagent was added and incubated for 10 minutes at 37 oC. The principles
involved for this reaction is that the peptide bonds of protein react with copper II ions in alkaline solution to form blue-violet complex (Biuret reaction). Each copper ion complexes with 5 or 6 peptide bonds. Tartrate is added as a stabilizer whilst Iodide is used to prevent auto-reduction of the alkaline copper complex. The color formed is proportional to the protein concentration.
2.2. Preparation of Albumin Sample
For sample preparation (Albumin-BCG method - a kit supplied by Transasia Bio-medicals Ltd, Baddi, Himachal Pradesh, India) was used. To 10 microliter of the serum one milliliter of albumin reagent was added and incubated for 1 minute at 37oC. The principle involved in this
reac-tion is that the albumin binds with Bromocresol green (BCG) at pH 4.2 causing a shift in absorbance of the yellow BCG dye. The Blue green color formed is propor-tional to the concentration of albumin.
2.3. Nonlinear Refractive Index
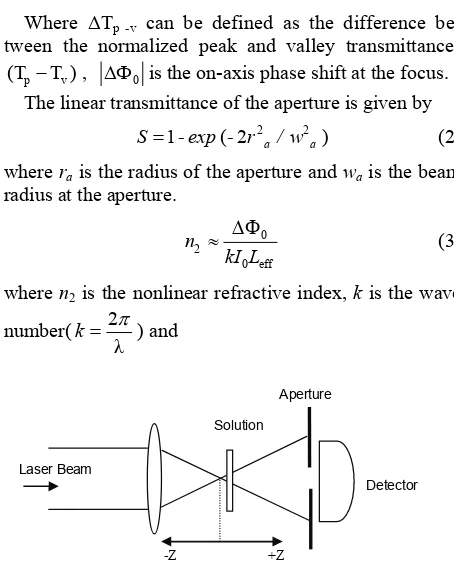
The Z-scan experiments were performed using a 532 nm Nd: YAG (SHG) CW laser beam (COHERENT–Compass 215M-50 diode-pumped laser) and He-Ne laser beam (RESEARCH ELECTRO OPTICS–30995 cylindrical helium-neon laser) focused by a lens of 35 mm focal length. The experimental set up is shown in Figure 1.
A typical closed-aperture Z-scan curve for the stan-dard total protein solution at incident intensity Iο = 7.824 kW/cm2. Likewise the Z-scan curve for standard
albumin solution at incident intensity Iο = 1.758 kW/cm2.
This normalized transmittance curves are characterized by a pre-focal peak followed by a post-focal valley. This implies that the nonlinear refractive indices of total pro-tein, albumins are negative (n2 < 0). The defocusing
ef-fect shown in Z-scan curve can be attributed to a thermal nonlinearity resulting from absorption of radiation at 532 nm and 633 nm respectively. Localized absorption of a tightly focused beam propagating through an absorbing sample medium produces a spatial distribution of tem-perature in the sample solution and consequently, a spa-tial variation of the refractive index, that acts as a thermal lens resulting in phase distortion of the propagating beam.
The nonlinear refractive index (n2) is calculated using
the standard relations [18].
0.25
p - v 0
ΔT = 0.406 (1 S) ΔФ (1) Where ΔTp -v can be defined as the difference
be-tween the normalized peak and valley transmittances
p v
(T T ), ΔФ0 is the on-axis phase shift at the focus. The linear transmittance of the aperture is given by
2 2
1 ( 2 a a
S - exp - r / w ) (2) where ra is the radius of the aperture and wa is the beam
radius at the aperture.
0 2
0 eff n
kI L
(3)
where n2 is the nonlinear refractive index, k is the wave
number( 2 λ k ) and
Laser Beam
Solution
Aperture
Detector
[image:2.595.308.535.405.687.2]-Z +Z
3. RESULTS AND DISCUSSION
L1 e α
eff
L
3.1. Measurement of Absorbance Spectra
0 2
0 2P I
w
is defined as the peak intensity within the
sample at the focus. L is the thickness of the sample, α is the linear absorption coefficient.
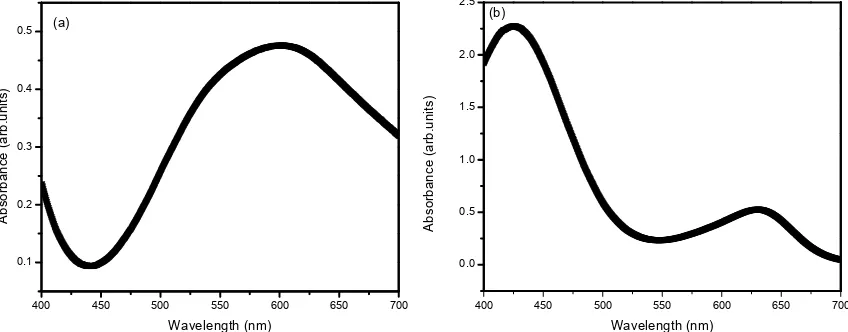
The absorption spectra were measured using UV-Vis spectrophotometer (SHIMADZU- UV-2401PC), and the spectra for both total protein and albumin were found to be broad banded as depicted in Figure 2. Hence for fur-ther study 532 nm Nd:YAG laser for total protein and 633 nm He-Ne laser for albumin were used.
An additional experiment was performed with a con-ventional colorimetric method following the standard procedure of A. G. Gornall et al. [3] and R. L. Rodkly
et al. [8] for total protein and albumin samples respec-tively. This involves measurement of optical density variation with respect to concentration. These results are compared with the results calculated with the Z-scan technique.
3.2. Measurement of Nonlinear Refractive Indices
The results of typical Z-scan normalized transmittance measurement for total protein and albumin are shown in Figure 3. As the concentration of the total protein and albumin increases, the normalized transmittance peak increases whereas the valley decreases respectively. The graph in Figure 4 (a) and (b) shows that the ΔTp-v value linearly increases with concentration of standard total protein and albumin solutions. Similarly in Figure 4 (c) and (d) refractive index value linearly increases with con-centration of standard total protein and albumin solutions.
2.4. Statistical Analysis
The error involved in the measurements was determined by t test, P < 0.01.These statistical analysis was con-ducted using SPSS commercial statistical package (SPSS,
version 10.0 for windows, SPSS Inc., Chicago, U.S.A). In addition experiment based on optical density is
400 450 500 550 600 650 700 0.1
0.2 0.3 0.4 0.5 (a)
Ab
so
rba
nce (
arb
.units)
Wavelength (nm)
400 450 500 550 600 650 700 0.0
0.5 1.0 1.5 2.0 2.5
(b)
A
bsorb
an
ce
(ar
b.un
its
)
[image:3.595.86.510.348.514.2]Wavelength (nm)
Figure 2. UV-Vis Spectra of standard (a) total protein (b) albumin with reagent.
-10 -5 0 5 10
0.4 0.6 0.8 1.0 1.2 1.4 1.6 1.8 2.0
N
o
rm
al
is
ed Tr
ansm
itt
an
ce
Z (m m )
T P (4g/dl) T P (6g/dl) T P (8g/dl)
-10 -5 0 5 10
0.7 0.8 0.9 1.0 1.1 1.2 1.3
N
o
rm
al
is
ed Tr
ansm
itt
an
ce
Z (m m )
[image:3.595.79.518.547.697.2]A lbum in (2g/dl) A lbum in (4g/dl) A lbum in (6g/dl)
Copyright © 2010 SciRes JBiSE
4 6 8 10 12
0.2 0.4 0.6 0.8 1.0
1.2 (a)
R2 =0.99707
Y =0.12453x-0.2796
Tp-v
C oncentration of total protein (g)
1 2 3 4 5 6
0.1 0.2 0.3 0.4 0.5 0.6
(b)
R2 =0.98172
Y=0.08939x+0.03901
Tp-v
C oncentration of album in (g)
4 6 8 10 12
10 20 30 40
(c)
Y =3.85085x-8.86715 R2
=0.99539
n2
x10
-8cm 2/W
C oncentration of total protein (g)
1 2 3 4 5 6
0 2 4 6 8 10
(d)
R2=0.98648
Y=1.50678x+0.47998 n2
x1
0
-8cm 2/W
[image:4.595.97.502.82.377.2]C oncentration of album in (g)
Figure 4. Linear variation of T p-v and nonlinear refractive index (n2) with concentration of total protein (a,c)
and albumin (b,d) by Z-scan method.
4 6 8 10 12
0.2 0.3 0.4 0.5 0.6 0.7 (a)
R2
=0.99954
Y=0.0545x+0.04
O
ptical Dens
ity
(arb.unit
s)
Concentration of total protein (g)
1 2 3 4 5 6
0.1 0.2 0.3 0.4 0.5 0.6 (b)
R2
=0.99763
Y=0.09343x+0.05133
O
ptical Dens
ity
(arb.unit
s)
Concentration of albumin (g)
Figure 5. Linear variation of optical density of total protein (a) and albumin (b) by colorimetric method.
given in Figure 5 (a) and (b). The experiments were repeated five times and the mean value of the nonlinear refractive index (n2) was calculated from the normalized
transmittance values. This calculated value was assumed to be the standard for measurement of unknown total protein and albumin content present in blood sample. This can be arrived by plotting a linear graph of total protein and albumin concentration Vs nonlinear refrac-tive index. The nonlinear refracrefrac-tive index value was first measured against the reagent blank solution. The
calibra-tion was made with the convencalibra-tional colori-metric method and the results are tabulated in Table 1 for total protein and in Table 3 for albumin. The normal level of total pro-tein in serum is in the range of 6–8.3 g/dl, and serum al-bumin normal level is in the range of 3.2–5 g/dl.
[image:4.595.93.503.417.572.2]continu-ously along Z-axis. The difference in these two values Tp–Tv, ׀ΔФ0׀ when substituted in Equation (3) yields
the nonlinear refractive index value.
Consequently by the results of Z-scan method, we in-fer that the n2 value is to be in the range of 13.90 ± 1.98
to 23.01 × 10⁻⁸ cm2/W for normal level of total protein in
serum. Likewise, n2 value for normal level of albumin in
serum is to be in the range of 5.26 to 8.16 ± 0.98 × 10⁻⁸
cm2/W.
3.3. Valuation with Conventional Method
[image:5.595.310.538.106.198.2]Many trials were performed to measure the total protein and albumin level with Z-scan method. The blood sam-ples were collected from five volunteers. We could see that the results arrived are in good agreement with those of the conventional colorimetric method for total protein as shown in Table 2 and for albumin Table 4. Hence we could clearly ascertain that the Z-scan method is on par with the conventional colorimetric method. By calculat-ing the total protein and albumin values we can also calculate the globulin level in serum. (Globulin = Total Protein–Albumin) is tabulated in Table 5.
Table 1. Nonlinear refractive index (n2) values for standard
total protein.
Standard total protein Concentration (g/dl)
Nonlinear refractive index n2 10-8 (cm2/W)
4 06.32 ± 0.74
6 13.90 ± 1.98
8 23.91 ± 1.79
10 30.81 ± 1.53
[image:5.595.312.537.235.326.2]12 34.97 ± 1.89
Table 2. Comparative analysis of serum total protein meas-urement using colorimetric method and Z-scan method.
Concentration of total protein (g/dl) Total
Protein level Colorimetric method Z-scan method
Normal 6.33 6.22
Normal 6.83 6.90
Normal 6.50 6.54
Normal 7.83 7.79
Normal 7.33 7.26
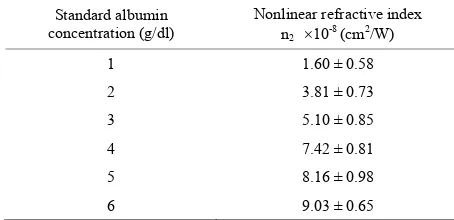
Table 3. Nonlinear refractive index (n2) values for standard albumin.
Standard albumin concentration (g/dl)
Nonlinear refractive index n2 10-8 (cm2/W)
1 1.60 ± 0.58
2 3.81 ± 0.73
3 5.10 ± 0.85
4 7.42 ± 0.81
5 8.16 ± 0.98
[image:5.595.58.283.371.456.2]6 9.03 ± 0.65
Table 4. Comparative analysis of serum albumin measurement using colorimetric method and Z-scan method.
Concentration of albumin (g/dl) Albumin
level Colorimetric method Z-scan method
Normal 3.42 3.49
Normal 3.85 3.78
Normal 3.68 3.75
Normal 4.20 4.13
[image:5.595.57.284.491.583.2]Normal 4.02 4.08
Table 5. Globulin concentration calculated from colorimetric method and Z-scan method.
Concentration of globulin (g/dl)
Colorimetric method Z-scan method
2.91 2.73 2.98 3.12 2.82 2.79 3.63 3.66 3.31 3.18
4. CONCLUSIONS
The Z-scan measurements indicate that the total pro-tein’s and albumin’s standard sample and serum sample exhibit nonlinear optical properties. We have measured the nonlinear refractive index values for total protein and albumin present in the serum sample by Z-scan method with 532 nm Nd:YAG CW laser and 633 nm He-Ne laser respectively. Comparative analysis of these values with the one obtained by conventional colorimetric method shows that they are in good agreement. Hence, apart from existing techniques, Z-scan technique can also be used for the measurement bioanalytes in serum.
REFERENCES
[1] Tietz, N.W. (1991) Clinical guide to laboratory tests, 2nd Edition, Saunders Co.
[2] Friedman, R.B and Young, D.S (1997) Effects of disease on clinical laboratory tests, 3rd Edition, AACC Press, Washington, DC.
[3] Gornall, A.G., Bardawill, C.J. and David, M.N. (1949) De-termination of serum proteins by means of the Biüret reac-tion. The Journal of Biological Chemistry, 177, 751-766. [4] Lowry, O.H., Rosebrough, N.J., Farr, A.L. and Randall,
R.J. (1951) Protein measurement with the folinphenol reagent, Journal of Biological Chemistry, 193, 265-275. [5] Bradford, M.M. (1976) A rapid and sensitive method for
the quantitation of microgram quantities of protein util-izing the principle of protein-dye binding. Analytical Biochemistry, 72, 248-254.
[image:5.595.55.282.610.720.2]Copyright © 2010 SciRes JBiSE [7] Flores, R. (1978) A rapid and reproducible assay for
quantitative estimation of protein using bromophenol blue. Analytical Biochemistry, 88, 605-611.
[8] Lee Rodkly, F. (1964) Binding of bromocresol green by human serum albumin. Archives of Biochemistry and Biophysics, 108, 510-513.
[9] Caraway, W.T. and Kammeyer, C.W. (1972) Chemical interference by drugs and other substances with clinical laboratory test procedures. Clinica Chimica Acta, 41, 395-434.
[10] Elking, M.P. and Kabat, H.F. (1968) Drug induced modi-fications of laboratory test values. American Journal of Hospital Pharmacy, 25, 485-519.
[11] Parvin, R., Pande, S.V. and Venkitasubramanian, T.A. (1965) On the colorimetric biuret method of protein de-termination. Analytical Biochemistry, 12, 219-229. [12] De Ia Huerga, J., Smetters, G.W. and Sherrick, J.C. (1964)
Colorimetric determination of serum proteins: The biuret reaction. In: Sunderman, F.W., Jr., Eds., Serum Proteins and the Dysproteinemias, Lippincott, Philadelphia, 52-62. [13] Doumas, B.T. and Biggs, H.G. (1972) Standard Methods
of Clinical Chemistry, Academic Press, New York, 7. [14] Doumas, B.T., Watson, W.A. and Biggs, H.G. (1971)
Albumin standards and the measurement of serum albu-min withbromocresol green. Clinica Chimica Acta, 31, 87-96.
[15] Kroll, M.H. and Chesler, R. (1998) The nonlinearity seen for ldl-cholesterol with lyophilized material is a matrix effect. Clinical Chemistry, 44, 1770-1771.
[16] Kroll, M.H. and Chesler, R. (1994) Nonlinearity of high- density lipoprotein cholesterol determinations is matrix dependent. Clinical Chemistry, 40, 389-394.
[17] G´omez, S.L., Turchiello, R.F., Juradoc, M.C., Boschcov, P., Gidlund, M. and Figueiredo Neto, A.M. (2004) Char-acterization of native and oxidized human low-density Physics of Lipids, 132, 185-195.
[18] G´omez, S.L., Turchiello, R.F., Juradoc, M.C., Boschcov, P, Gidlund, M. and Figueiredo Neto, A.M. (2006) Ther-
mallens effect of low density lipoprotein lyotropic-like aggregates investigated by using the Z-scan technique. Liquid Crystal Today, 15, 1-3.
[19] Rockwell, B.A., Roach, W.P., Rogers, M.E., Mayo, M.W., Toth, C.A., Cain, C.P. and Noojin, G.D. (1993) Nonlinear refraction in vitreous humor. Optics Letter, 18, 1792- 1794.
[20] Bezerra, A.G., Jr., Gomes, A.S.L., de Melo, C.P. and de Arafijo, C.B. (1997) Z-scan measurements of the nonlinear refraction in retinal derivatives. Chemical Physics Letters,
276, 445-449.
[21] Dhinaa, A.N., Ahmad, Y.N., Murali, K. and Palanisamy, P.K. (2008) Z-Scan Technique as a Tool for the Meas-urement of Blood Glucose. Laser Physics, 8, 1212-1216. [22] Dhinaa, A.N. and Palanisamy, P.K. (2009) Z-scan tech-nique for measurement of total cholesterol and triglyc-erides in blood. Journal of Innovative Optical Health Sciences, 2, 295-301.
[23] Sheik Bahae, M., Said, A.A., Wei, T.H., Hagan D.J. and Vanstryland, E.W. (1990) Sensitive measurement of op-tical nonlinearities using a single beam. Quantum Elec-tron, 26, 760-769.
[24] Qusay, M.A. and Palanisamy, P.K. (2005) Investigation of nonlinear optical properties of organic dye by Z-scan technique using He-Ne laser. Optik, 116, 515-520. [25] Madhanasundari, R. and Palanisamy, P.K. (2006) Optical
nonlinearity of a triphenyl methane dye as studied by Z-scan and self-diffraction techniques. Modern Physics Letter B, 20, 887-897.
[26] Qusay, M.A. and Palanisamy, P.K. (2006) Z-scan determi-nation of the third order optical nonlinearity of organic dye nileblue chloride. Modern Physics Letter B, 20, 623-632.
[27] Dhinaa, A.N., Ahmad, Y.N. and Palanisamy, P.K. (2007) Nonlinear optical properties of acid orange 10 dye by Z-scan technique using Ar+ laser. Journal of nonlinear