ISSN Online: 2327-4344 ISSN Print: 2327-4336
DOI: 10.4236/gep.2019.711005 Nov. 11, 2019 54 Journal of Geoscience and Environment Protection
Quantifying the Effects of Climate Change and
Land Management on Vegetation Dynamics
from 1982 to 1985 in the Source Region of
Three-Rivers, China
Rui Wang
1*, Hao Ma
21School of Geography and Tourism, Shaanxi Normal University, Xi’an, China
2Northwest Institute of Forest Inventory and Planning and Design, State Forestry Administration, Xi’an, China
Abstract
Vegetation dynamics under a warming climate in the source region of the Three Rivers (SRTR) and its ecological impacts are a source of serious con-cern. In this study, we investigated the spatial and temporal variations of normalized difference vegetation index during the growing season (NDVIgr) and the start of the vegetation growing season (SOS) for six ecosystems. We examined the relationships between vegetation parameters, air temperature, precipitation and land management using residual trend method from 1982 to 2015. The NDVIgr increased at a rate of 0.0061/10a, and SOS advanced by 0.96 d/10a during the study period. The NDVIgr increased for the all six ve-getation ecosystem from 1982 to 2015. The SOS showed advancing trend for the vegetation types for meadow (0.1236 d/a) and steppe (0.3480 d/a), but showing delaying trends for forest, shrub, barren land and alpine vegetation. The results of the correlation analysis indicate an increase in the air tempera-ture in the SRTR is the main factor explaining increases in the NDVI and ad-vancement of the SOS. In general, awarming-wetting climate and reasonable human activities had positive effects on vegetation growth, while the positive impact of human activities was weaker than that of climatic factors. This study provides a necessary basis for research on and the prediction of vegeta-tion changes and their response to the climate warming of the SRTR in the Qinghai-Tibet Plateau (QTP).
Keywords
NDVI, Climate Warming, Growing Season, Vegetation Dynamics How to cite this paper: Wang, R., & Ma,
H. (2019). Quantifying the Effects of Cli-mate Change and Land Management on Vegetation Dynamics from 1982 to 1985 in the Source Region of Three-Rivers, China. Journal of Geoscience and Environment Protection, 7, 54-68.
https://doi.org/10.4236/gep.2019.711005
Received: October 30, 2019 Accepted: November 8, 2019 Published: November 11, 2019
Copyright © 2019 by author(s) and Scientific Research Publishing Inc. This work is licensed under the Creative Commons Attribution International License (CC BY 4.0).
http://creativecommons.org/licenses/by/4.0/
DOI: 10.4236/gep.2019.711005 55 Journal of Geoscience and Environment Protection
1. Introduction
The Yellow River, Yangtze River and Lantsang River originate in the Qing-hai-Tibet Plateau (QTP), which is a cold and arid region with a fragile ecosystem (Wang et al., 2017). Because of the high altitude and climate of the QTP, frozen ground is widespread, and alpine grasslands are the primary vegetation type. In a warming climate, the increasing rate of temperature in the QTP is obviously greater than that in other regions of the world in recent decades (Yang et al., 2010; Qin et al., 2016). This trend has been shown to invoke dramatic influence on the structure and function of terrestrial ecosystem in the source region of three-river (SRTR) (Grimm et al., 2013; Fu et al., 2019).
It is hypothesized that the climate warming may result in alpine grassland degradation, including the reduction in vegetation cover, decrease in the num-ber of plant families, reverse succession of alpine grasslands and release of or-ganic carbon (Yi et al., 2011; Zhou et al., 2015). Many previous studies have suggested that temperature increases and frozen ground degradation lower the ground water table and dry out surface soils, leading to the degradation of ve-getation, which supports the above hypothesis (Wang et al., 1994; Wang et al., 2010). However, some studies have reported that pronounced soil temperatures combined with the degradation of frozen grounds may promote vegetation growth in cold regions (Myneni et al., 1997; Zhong et al., 2010; Xu et al., 2011). These studies have stressed that the increase in temperature may mitigate the low-temperature stress of alpine vegetation and promote the nutrient cycle (Zhou et al., 2015). Clearly, it remains unclear whether a warming climate has positive or negative effects on vegetation growth.
Vegetation phenology is not only a sensitive indicator of global climate change but also provide feedback to climate through changes in biogeochemical cycling and biophysical properties (Kim et al., 2012). It has been suggested that longer growing seasons, particularly earlier spring vegetation green-up, signifi-cantly enhance vegetation productivity in the temperate and boreal regions (Song et al., 2011). However, previous researches regarding the trend of SOS during the last few decades on the plateau remain controversial. For example, Piao et al. (2007) have reported a continuous advancement in SOS on the Tibe-tan Plateau during 1982-2011, whereas others have argued that there is no evi-dence to prove such a conclusion (Oliva et al., 2018). Zhang et al., (2015) as-sumed that the SOS delaying trend due to low temperature in winter for plant dormancy could not be sufficient as the significant increase in temperature of winter.
DOI: 10.4236/gep.2019.711005 56 Journal of Geoscience and Environment Protection non-climatic factors on vegetation growth, particularly to compare these differ-ences in these effects across different land cover and vegetation types.
In this study, the normalized difference vegetation index (NDVI), which is derived from the Global Inventory Modeling and Mapping Studies (GIMMS) and Moderate Resolution Imaging Spector radiometer (MODIS), was used to characterize changes in vegetation over time, and to examine the correlation with climatic variation and land management. The objectives of our study were to 1) investigate the spatial and temporal patterns of growing season vegetation NDVI (from May to September) (NDVIgr) and SOS in SRTR during the past 34 years; 2) analyze the vegetation growth among different land covers; 3) distin-guish the effects climatic and non-climatic factors on NDVI and SOS changes.
2. Materials and Methods
2.1. Study Area
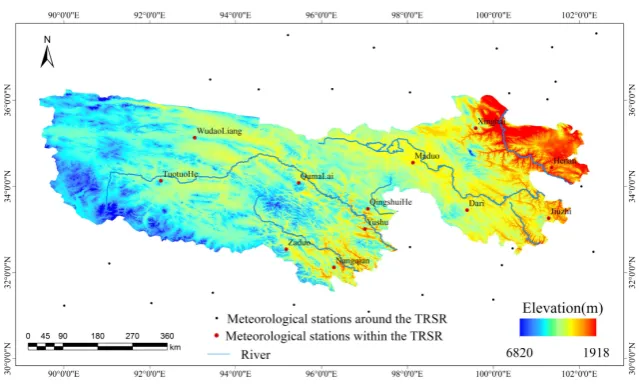
The SRTR is a catchment area of approximately 33.95 × 10⁴ km2 located in nor-theastern QTP, and its spatial range covers 31˚39' - 36˚12'N, 89˚45' - 102˚23'E (Figure 1). The altitude decreases from west to east and south to north, ranging from 6824 m in the Animaqin Mountains to 2575 m in the village of Tangnaga. The SRTR has a typical continental plateau climate that is affected by the Asian monsoon, with an average annual air temperature of −5.6˚C to −7.8˚C and an average annual precipitation of 260 - 780 mm. The SRTR is characterized as a transition zone from permafrost to seasonally frozen soils at midlatitudes and high altitudes of the QTP.
2.2. Data
[image:3.595.213.533.517.709.2]The measured meteorological data in this study from 45 meteorological stations located in and near the SRTR (Figure 1) were collected from the National Me-teorological Information Center (http://data.cma.cn). These data include monthly air temperature and precipitation, spanning the period 1982-2015.
DOI: 10.4236/gep.2019.711005 57 Journal of Geoscience and Environment Protection The NDVI derived from GIMMS and MODIS was used to understand vegeta-tion growth. GIMMS NDVI data are represented in a 15-d maximum-value composite product, with a spatial resolution of 8 km during the period 1982- 2006. The MODIS NDVI data are collected every 16 d at a 1-km spatial resolu-tion from 2002 to 2015. To ensure consistency in the two NDVI datasets, we ap-plied a linear fit between the two datasets using an overlapping data period (2000-2006) and applied this relationship (Song et al., 2011) to the MODIS NDVI data to extend the temporal sequence of the GIMMS NDVI data. Addi-tionally, we preprocessed the datasets by implementing an image cut, projection transformation (to WGS-84) and image resampling (to 8 km). The above two datasets were subjected to radiometric calibration, atmospheric correction, cloud screening, and solar zenith angle correction to remove the effects unassociated with variations in vegetation.
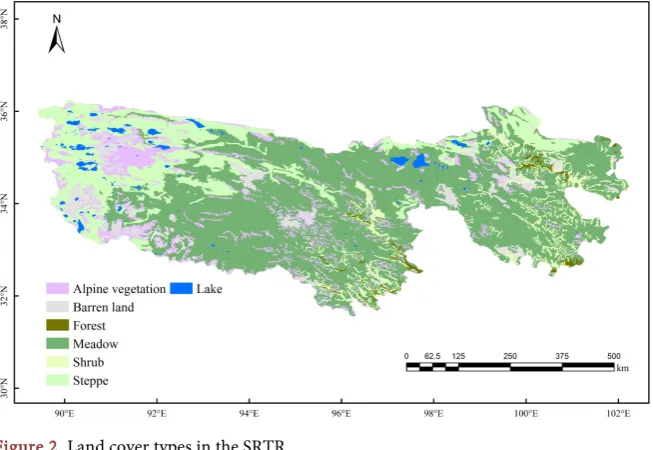
The land cover map (MICLCover2000), with a 1-km spatial resolution, for the year 2000 used the International Geosphere-Biosphere Programme (IGBP) clas-sification (Figure 2). The MICLCover2000 datasets were downloaded from the Cold and Arid Regions Science Data Center at Lanzhou
(http://westdc.westgis.ac.cn/).
2.3. Retrieving the Vegetation Green-up Date
[image:4.595.210.537.497.722.2]The GIMMS and MODIS NDVI data were used to determine the vegetation green-up date (i.e., the start of the vegetation growing season (SOS)) in the SRTR. Time series of NDVI data were smoothed using the asymmetric Gaussian function fitting method via the TIMESET software version 3.2 (Jönsson & Ek-lundh, 2004). This fitting method, which is combined with the Gaussian func-tion, simulates the vegetation growth process by stage and then connects and smooths the fitted curves in different stages to reestablish the NDVI time series.
DOI: 10.4236/gep.2019.711005 58 Journal of Geoscience and Environment Protection The SOS was determined by the relative threshold method from the NDVI time series. The dates of the SOS were defined by the times when the NDVI values increased to a certain proportion of the seasonal amplitude along the left edge of the annual curve. A relative threshold of 10% was used based on previous sug-gestions and results obtained in similar environments (Song et al., 2011).
2.4. Trend and Correlation Analyses
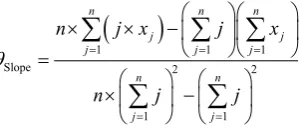
The t-test was adopted to analyze the interannual trends of the NDVIgr, SOS, precipitation and temperature, and to examine the significance of these trends. The computational formula (Zhang et al., 2016) is:
(
)
1 1 1
Slope 2 2
1 1
n n n
j j
j j j
n n
j j
n j x j x
n j j
θ
= = == = × × − = × −
∑
∑
∑
∑
∑
(1)where n represents the number of years in the study period, which was n = 34 (1982-2015) in this study; Xj represents the quantity being studied in year j; and θ represents the slope of the trend line (when θ > 0, the quantity being studied increases over n years, and vice versa).
The correlation coefficients were calculated in each pixel in order to analyze the relationship between vegetation factors and climatic factors. The computa-tional formula (Xu et al., 2011) is:
(
)(
)
(
)
(
)
1 2 2 1 1 n i i ixy n n
i i
i i
x x y y r
x x y y
= = = − − = − ⋅ −
∑
∑
∑
(2)To quantitatively determine how non-climatic factors impact vegetation growth, the residual trend analysis (Pan et al., 2017) was used in this study. The residuals represented the differences between simulated and observed NDVI. The multivariate linear regression was adopted to simulate NDVI considering factors including SFD, air temperature and precipitation on NDVI. All data were processed with the assistance of ArcGIS 10.5 software and MATLAB 2015a software.
3. Results
[image:5.595.295.447.227.291.2]3.1. Spatial and Temporal Variations in NDVI, SOS, Temperature
and Precipitation
DOI: 10.4236/gep.2019.711005 59 Journal of Geoscience and Environment Protection
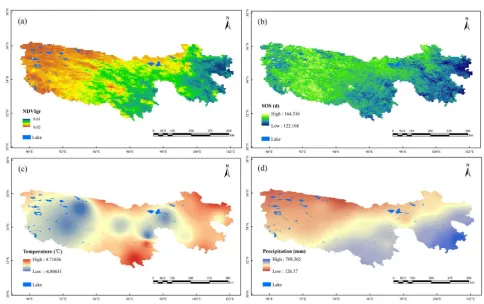
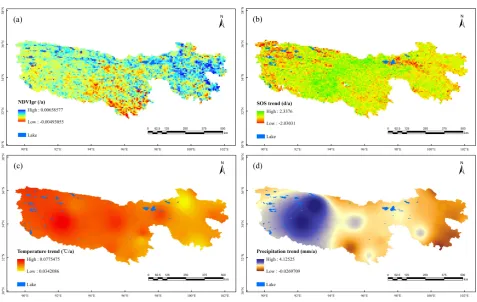
Figure 3. Spatial distribution of the mean NDVIgr (a), SOS (b), air temperature (c) and precipitation (d) during 1982-2015.
in southeast region and the lowest value in northeast region (4.72˚C and 708.57 mm, respectively).
Temporal variations of the mean NDVIgr, SOS, air temperature and precipi-tation from 1982 to 2015 were shown in Figure 4. The NDVI in the SRTR exhi-bited a generally increasing trend at the 34-year time scale (Figure 4(a)), with a rate of increase of 0.0061/10 a. The most significant increase in the NDVI for the SRTR occurred in the source region of the Yellow River which located in the eastern SRTR. The SOS showed a significant advancing trend across the entire SRTR (0.096 d/a) (Figure 4(b)). The SOS in eastern and western region showed a rapid advancing trend, whereas the central SRTR showed a delay in the SOS. At the same time scale, both the annual mean air temperature and precipitation showed increasing trends at the rates of 0.057˚C/a and 2.604 mm/a, respectively.
3.2. Vegetation Dynamics of Different Vegetation Types
DOI: 10.4236/gep.2019.711005 60 Journal of Geoscience and Environment Protection
DOI: 10.4236/gep.2019.711005 61 Journal of Geoscience and Environment Protection .
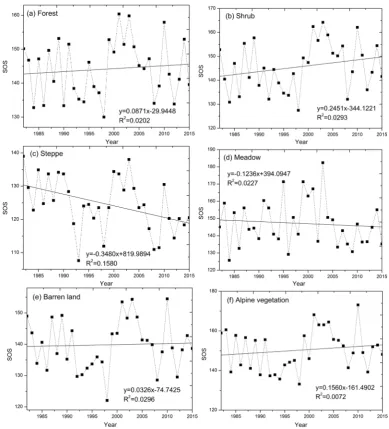
Figure 5. Trends of mean NDVIgr of forest (a), shrub (b), steppe (c), meadow (d), barren land (e), and alpine ve-getation (f) from 1982 to 2015.
[image:8.595.149.539.265.695.2]DOI: 10.4236/gep.2019.711005 62 Journal of Geoscience and Environment Protection shrub, barren land and alpine vegetation, and the shrub showed the greatest de-lay trend (0.2450 d/a).
3.3. Effect of Climatic and Non-Climatic Factors on Vegetation
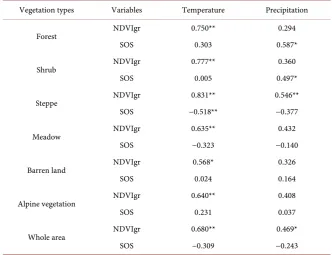
We calculated the correlation coefficients between vegetation factors (NDVIgr and SOS) and climatic factors (air temperature and precipitation) and (Table 1). It was found that the correlation coefficients between the NDVIgr and climatic factors were significantly positive, especially for vegetation type of steppe. How-ever, the SOS for entire study area and the six vegetation communities showed a lower correlation with temperature and precipitation. In addition, compared with the precipitation, the increasing air temperature had greater effects on the NDVIgr for all six vegetation types. However, the impacts of increasing temper-ature on SOS were more complex, and the correlation coefficients between SOS and temperature were greater for forest and shrub at the 0.05 level of significance.
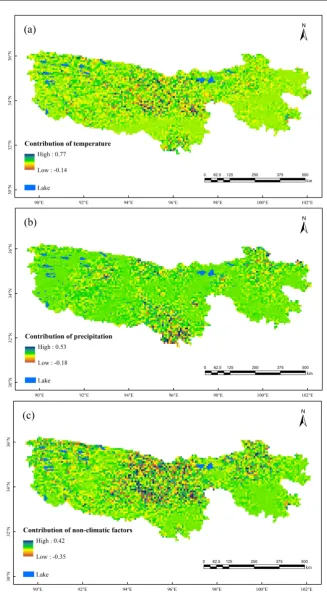
[image:9.595.207.540.453.708.2]To further quantify the influences of climatic and non-climatic factors on the variation in vegetation activity, the contribution of each driving factor to the in-terannual variation in the NDVI in the regions during 1982-2015 was analyzed and compared (Figure 7). The average contributions of temperature, precipita-tion and non-climatic factors to the NDVI across the SRTR were positive, which were 0.0044/a, 0.0031/a and 0.0025/a, respectively. Temperature was found to have strong positive effects on the majority of both regions but have negative ef-fects in the north and south region. In general, precipitation has weaker efef-fects on the NDVI than temperature, and has a negative effect on the NDVI in part
Table 1. The correlation coefficients between influencing factors and vegetation factors.
Vegetation types Variables Temperature Precipitation
Forest NDVIgr 0.750** 0.294
SOS 0.303 0.587*
Shrub NDVIgr 0.777** 0.360
SOS 0.005 0.497*
Steppe NDVIgr 0.831** 0.546**
SOS −0.518** −0.377
Meadow NDVIgr 0.635** 0.432
SOS −0.323 −0.140
Barren land NDVIgr 0.568* 0.326
SOS 0.024 0.164
Alpine vegetation NDVIgr 0.640** 0.408
SOS 0.231 0.037
Whole area NDVIgr 0.680** 0.469*
SOS −0.309 −0.243
DOI: 10.4236/gep.2019.711005 63 Journal of Geoscience and Environment Protection
Figure 7. Contributions of air temperature (a), precipitation (b), and non-climatic factors (c) to NDVIgr variations during 1982-2014.
DOI: 10.4236/gep.2019.711005 64 Journal of Geoscience and Environment Protection
4. Discussion
This study made an effort to investigate variations in the annual mean NDVIgr and SOS in the SRTR from 1982 to 2015. Our results indicated that the NDVI during the growing season showed an increase from 1982 to 2015, which was consistent with previous reports on the source region in the QTP (Xu et al., 2011; Luo et al., 2018)but contrary to some earlier studies (Zhang et al., 2007). Different selections of study areas and time intervals can result in different con-clusions. The SRTR had better eco-environmental quality than the other regions in QTP, mainly because the Chinese government has established a nature reserve and introduced numerous ecological restoration programs in this area since 2000 to protect this ecosystem (Shen et al., 2018). The results from previous ve-getation studies before 2003 were different from those after 2003 (Zhang et al., 2016). Liang et al. (2012) reported that in 2000-2007, variations in the NDVI based on MODIS satellite data experienced an overall increase of approximately 5%, which supported our results to a certain extent. This study showed that the average SOS in the SRTR has advanced by 0.096 d/a, which is consistent with previous reports from the QTP (Yu et al., 2018).
There is no doubt that vegetation growth depends upon an appropriate hy-drothermal condition (Xu et al., 2011). Several previous studies found that vege-tation variations and green-up dates for the Tibetan Plateau were associated with precipitation (Zhong et al., 2010). Other studies showed that vegetation dynam-ics and phenological changes were positively influenced by increased tempera-tures (Wang et al., 2016). Our study indicated that the temperature made a greater effect on the NDVIgr comparing with precipitation, which was in line with the latter one. Climate warming could mitigate low-temperature stress, promote the nutrient cycle in cold regions and, therefore, play a positive role in the enhancement of vegetation (Zhou et al., 2015). Moreover, some researchers have generally assumed that permafrost degradation increases soil permeability, decreases the water table and dries out shallow soils, thereby negatively influen-cing vegetation growth on the QTP (Wang et al., 2019).
DOI: 10.4236/gep.2019.711005 65 Journal of Geoscience and Environment Protection and steppe exhibited the advancing trend. The differences were due mainly to the selection of study period and method.
In this study, non-climatic factors referring to land management made a posi-tive impact on vegetation growth in most parts of SRTR for the entire period of 1982-2015. Previous studies indicated that non-climatic factors made a negative contribution to vegetation distribution and ecosystem structure due to over-grazing and rodent damage in SRTR before 2000. Since 2000, when the imple-mentation of ecological restoration projects began, the negative influence of land management on vegetation was reversed (Pan et al., 2017). Therefore, the posi-tive contributions of land management after 2000 may offset the negaposi-tive effects before 2000. Moreover, the contribution of non-climatic factors was greater in the east than in the west of the study area, possibly because the population was more in the east with lower elevation and thereby human activities were more intense.
5. Conclusion
Based on vegetation NDVI and meteorological datasets, we investigated the spa-tial and temporal changes in NDVIgr and SOS in the SRTR over the past 34 years, and their responses to climate change were analyzed and discussed. The main findings were as follows: 1) At the regional scale, the average NDVIgr and SOS gradually decreased and increased from southeast to northeast with in-creasing altitudes, with the mean values of 0.2911 and 143d, respectively. From 1982 to 2015, the mean NDVIgr and SOS showed the increasing and advancing trends of 0.0061/10a and 0.096 d/a, respectively. 2) The growing season NDVI increased for the all six vegetation types from 1982 to 2012. The average vegeta-tion SOS showed advancing trend for the vegetavegeta-tion types for meadow (0.1236 d/a) and steppe (0.3480 d/a), but showing delaying trends for forest, shrub, bar-ren land and alpine vegetation. 3) The relationship between climatic factors and NDVIgr for entire region and six vegetation types were greater than with SOS. The contribution of temperature on vegetation growth was greater than precipi-tation and non-climatic factors. Except for the climatic factors and human activ-ities, other driving forces (e.g. frozen soil, wind and evapotranspiration) also play an important role in vegetation dynamics. Therefore, we will further study the different factors on vegetation growth and quantify their effects.
Acknowledgements
The research was funded by National Natural Science Foundation of China (No.41807061), Postdoctoral Science Foundation of China (No.2018M633454) and Fundamental Research Funds for the Central Universities of China (No. GK201803046).
Conflicts of Interest
DOI: 10.4236/gep.2019.711005 66 Journal of Geoscience and Environment Protection
References
Fu, G., Zhang, H. R., & Sun, W. (2019). Response of Plant Production to Growing/ Non-Growing Season Asymmetric Warming in an Alpine Meadow of the Northern Tibetan Plateau. Science of The Total Environment, 650, 2666-2673.
https://doi.org/10.1016/j.scitotenv.2018.09.384
Grimm, N. B., Chapin, F. S., Bierwagen, B. et al (2013). The Impacts of Climate Change on Ecosystem Structure and Function. Frontiers in Ecology and the Environment, 11, 474-482.https://doi.org/10.1890/120282
Jönsson, P., & Eklundh, L. (2004). TIMESAT—A Program for Analyzing Time-Series of Satellite Sensor Data. Computers & Geosciences, 30, 833-845.
https://doi.org/10.1016/j.cageo.2004.05.006
Karnieli, A., Bayasgalan, M., Bayarjargal, Y., Agam, N., Khudulmur, S., & Tucker, C. J. (2006). Comments on the Use of the Vegetation Health Index over Mongolia. Interna-tional Journal of Remote Sensing, 27, 2017-2024.
https://doi.org/10.1080/01431160500121727
Kim, Y., Kimball, J. S., Zhang, K., & McDonald, K. C. (2012). Satellite Detection of In-creasing Northern Hemisphere Non-Frozen Seasons from 1979 to 2008: Implications for Regional Vegetation Growth. Remote Sensing of Environment, 121, 472-487. https://doi.org/10.1016/j.rse.2012.02.014
Liang, S. H., Ge, S. M., Wan, L., & Xu, D. W. (2012). Characteristics and Causes of Vege-tation Variation in the Source Regions of the Yellow River, China. International Jour-nal of Remote Sensing, 33, 1529-1542. https://doi.org/10.1080/01431161.2011.582187 Luo, L. H., Ma, W., Zhuang, Y. L. et al. (2018). The Impacts of Climate Change and
Hu-man Activities on Alpine Vegetation and Permafrost in the Qinghai-Tibet Engineering Corridor. Ecological Indicators, 93, 24-35.
https://doi.org/10.1016/j.ecolind.2018.04.067
Myneni, R. B., Keeling, C. D., Tucker, C. J., Asrar, G., & Nemani, R. (1997). Increased Plant Growth in the Northern High Latitudes from 1981 to 1991. Nature, 386, 698-702. https://doi.org/10.1038/386698a0
Oliva, M., Pereira, P., & Antoniades, D. (2018). The Environmental Consequences of Permafrost Degradation in a Changing Climate. Science of the Total Environment, 616-617, 435-437. https://doi.org/10.1016/j.scitotenv.2017.10.285
Pan, T., Zou, X. T., Liu, Y. J., Wu, S. H., & He, G. M. (2017). Contributions of Climatic and Non-Climatic Drivers to Grassland Variations on the Tibetan Plateau. Ecological Engineering, 108, 307-317. https://doi.org/10.1016/j.ecoleng.2017.07.039
Pang, G. J., Wang, X. J., & Yang, M. X. (2017). Using the NDVI to Identify Variations in, and Responses of, Vegetation to Climate Change on the Tibetan Plateau from 1982 to 2012. Quaternary International, 444, 87-96.
https://doi.org/10.1016/j.quaint.2016.08.038
Piao, S. L., Friedlingstein, P., Ciais, P., Viovy, N., & Demarty, J. (2007). Growing Season Extension and Its Impact on Terrestrial Carbon Cycle in the Northern Hemisphere over the Past 2 Decades. Global Biogeochemical Cycles, 21, GB3018.
https://doi.org/10.1029/2006GB002888
Qin, Y., Lei, H. M., Yang, D. W., Gao, B., Wang, Y. H., Cong, Z. T., & Fan, W. J. (2016). Long-Term Change in the Depth of Seasonally Frozen Ground and Its Ecohydrological Impacts in the Qilian Mountains, Northeastern Tibetan Plateau. Journal of Hydrology, 542, 204-221.https://doi.org/10.1016/j.jhydrol.2016.09.008
Headwa-DOI: 10.4236/gep.2019.711005 67 Journal of Geoscience and Environment Protection ters Region of the Tibetan Plateau of China. Ecological Indicators, 93, 804-812. https://doi.org/10.1016/j.ecolind.2018.05.065
Sheng, W. P., Zhen, L., Xiao, Y., & Hu, Y. F. (2019). Ecological and Socioeconomic Effects of Ecological Restoration in China’s Three Rivers Source Region. Science of the Total Environment, 650, 2307-2313.https://doi.org/10.1016/j.scitotenv.2018.09.265
Song, C. Q., Ke, L. H., You, S. C., Liu, G. H., & Zhong, X. K. (2011). Comparison of Three NDVI Time-Series Fitting Methods Based on TIMESAT—Taking the Grassland in Northern Tibet as Case. Remote Sensing Technology & Application, 26, 147-155. Wang, B. L., & French, H. M. (1994) Climate Controls and High-Altitude Permafrost,
Qinghai-Xizang (Tibet) Plateau, China. Permafrost & Periglacial Processes, 5, 87-100. https://doi.org/10.1002/ppp.3430050203
Wang, G. X., Liu, L. A., Liu, G. S., Hu, H. C., & Li, T. B. (2010). Impacts of Grassland Ve-getation Cover on the Active-Layer Thermal Regime, Northeast Qinghai-Tibet Plateau, China. Permafrost & Periglacial Processes, 21, 335-344.
https://doi.org/10.1002/ppp.699
Wang, R., Zhu, Q. K., Ma, H., & Ai, N. (2017). Spatial-Temporal Variations in Near-Surface Soil Freeze-Thaw Cycles in the Source Region of the Yellow River during the Period 2002-2011 Based on the Advanced Microwave Scanning Radiometer for the Earth Ob-serving System (AMSR-E) Data. Journal of Arid Land, 9, 850-864.
https://doi.org/10.1007/s40333-017-0032-4
Wang, T. Y., Wu, T. H., Wang, P., Li, R., Xie, C. W., & Zou, D. F. (2019). Spatial Distri-bution and Changes of Permafrost on the Qinghai-Tibet Plateau Revealed by Statistical Models during the Period of 1980 to 2010. Science of the Total Environment, 650, 661-670.https://doi.org/10.1016/j.scitotenv.2018.08.398
Wang, X. Y., Yi, S. H., Wu, Q. B., Yang, K., & Ding, Y. J. (2016). The Role of Permafrost and Soil Water in Distribution of Alpine Grassland and Its NDVI Dynamics on the Qinghai-Tibetan Plateau. Global and Planetary Change, 147, 40-53.
https://doi.org/10.1016/j.gloplacha.2016.10.014
Xu, W. X., Gu, S., Zhao, X. Q., Xiao, J. S., Tang, Y. H., Fang, J. Y., Zhang, J., & Jiang, S. (2011). High Positive Correlation between Soil Temperature and NDVI from 1982 to 2006 in Alpine Meadow of the Three-River Source Region on the Qinghai-Tibetan Pla-teau. International Journal of Applied Earth Observations & Geoinformation, 13, 528-535.https://doi.org/10.1016/j.jag.2011.02.001
Yang, M., Nelson, F. E., Shiklomanov, N. I., Guo, D. L., & Wan, G. N. (2010). Permafrost Degradation and Its Environmental Effects on the Tibetan Plateau: A Review of Recent Research. Earth Science Reviews, 103, 31-44.
https://doi.org/10.1016/j.earscirev.2010.07.002
Yi, S. H., Zhou, Z. Y., Ren, S. L., Xu, M., Qin, Y., Chen, S. Y., & Ye, B. S. (2011). Effects of Permafrost Degradation on Alpine Grassland in a Semi-Arid Basin on the Qing-hai-Tibetan Plateau. Environmental Research Letters, 6, 45403-45409.
https://doi.org/10.1088/1748-9326/6/4/045403
Yu, S., Xia, J. J., Yan, Z. W., & Yang, K. (2018). Changing Spring Phenology Dates in the Three-Rivers Headwater Region of the Tibetan Plateau during 1960-2013. Advances in Atmospheric Sciences, 35, 116-126. https://doi.org/10.1007/s00376-017-6296-y Zhang, J. H., Yao, F. M., Zheng, L. Y., & Yang, L. M. (2007). Evaluation of Grassland
Dy-namics in the Northern-Tibet Plateau of China Using Remote Sensing and Climate Data. Sensors, 7, 3312-3328.https://doi.org/10.3390/s7123312
DOI: 10.4236/gep.2019.711005 68 Journal of Geoscience and Environment Protection 7, 16607-16622.https://doi.org/10.3390/rs71215847
Zhang, Y., Zhang, C. B., Wang, Z. Q., Chen, Y. Z., Gang, C. C., An, R., & Li, J. C. (2016). Vegetation Dynamics and Its Driving Forces from Climate Change and Human Activi-ties in the Three-River Source Region, China from 1982 to 2012. Science of the Total Environment, 563, 210-220. https://doi.org/10.1016/j.scitotenv.2016.03.223
Zhong, L., Ma, Y. M., Salama, M. S., & Su, Z. B. (2010). Assessment of Vegetation Dynamics and Their Response to Variations in Precipitation and Temperature in the Tibetan Plateau. Climatic Change, 103, 519-535.
https://doi.org/10.1007/s10584-009-9787-8