https://www.scirp.org/journal/ojer ISSN Online: 2169-9631
ISSN Print: 2169-9623
DOI: 10.4236/ojer.2019.84016 Nov. 11, 2019 267 Open Journal of Earthquake Research
Sun-Moon-Earth Interactions with Larger
Earthquakes Worldwide Connections
Marilia Hagen1, Anibal Azevedo2
1Universidade Federal Fluminense, Instituto de Física, Niterói, RJ, Brasil (retired) 2Faculdade de Ciências Aplicadas da Unicamp, Limeira, São Paulo
Abstract
The aim of this paper is to investigate the effects on Moon-Earth gravitational variations and Moon phases during three Solar Cycless (SC22, SC23, SC24). The first part defines gravitational forces as a force that creates an oscillation when the moon is reaching the Perigee, the smallest distance between the Moon and Earth during its rotational movement around Earth. It has a small amplitude and large period. Unlikely other authors, we do not find a direct connection between the Moon phases and big earthquakes worldwide. The study is performed through the three Solar Cycless, which refers to the varia-tion in the Sun’s magnetic field. However, a strong indicavaria-tion appeared that almost the totality of the largest quakes studied happened preferentially at the subduction zones, in the Southern Hemisphere. In this research we apply ex-perimental data to find the tide force, and the Perigee position is an experi-mental value. Other parameters are experiexperi-mental, such as the length of Solar Cycless, the Moon’s phases connected to each earthquake where M ≥ 7.5. The calculations use regression in time to find the results. Our model considers in the regression the period 1986-2018.
Keywords
Solar Cycless, Moon-Earth Gravitational Forces, Larger Earthquakes
1. Introduction
This paper is a continuation of former research on the gravitational force varia-tion of Moon-Earth and how it would influence the rise of worldwide earth-quakes. In our former paper [1] has been verified that Moon-Earth has a gravita-tional force that varies during the month when the Moon is at the Perigee.
This force creates a wave with a small variation in amplitude and a large pe-How to cite this paper: Hagen, M. and
Azevedo, A. (2019) Sun-Moon-Earth Inte-ractions with Larger Earthquakes World-wide Connections. Open Journal of Earth-quake Research, 8, 267-298.
https://doi.org/10.4236/ojer.2019.84016
Received: September 1, 2019 Accepted: November 8, 2019 Published: November 11, 2019
Copyright © 2019 by author(s) and Scientific Research Publishing Inc. This work is licensed under the Creative Commons Attribution International License (CC BY 4.0).
DOI: 10.4236/ojer.2019.84016 268 Open Journal of Earthquake Research riod, which has been calculated as well. The period analyzed was shorter than in the present study 1996-2008. The results have indicated that apparently the gra-vitational moon variation effects more subduction zones, and several locations which occur more earthquakes in the period studied. We also studied the possi-ble correlation between Moon phases and earthquakes searching the historical earthquakes catalog 1700-2016. The results showed the largest earthquakes often surge at subduction zones. However, it does not have any relation with Moon phases, New Moon or Full Moon.
In the paper after that, [2] we have added the Sun to the interactions with Moon-Earth and earthquakes. The Solar Cycless comprehends a period of eleven years it was the next implicit variable used. The period analyzed for this search was 1996-2016, it included two Solar Maxima that could indicate the presence or absence of influence or not in the enhancement of quakes.
Other such studies examined the development of earthquake events during the seasons. To do this, we needed to divide the Global research into Northern and Southern Hemispheres since the seasons occur differently in each hemis-phere. It was found to the Northern Hemisphere there was a slight increase in the earthquakes during Spring and Summer [3].
The present research considers three Solar Cycless, the gravitational force os-cillation is calculated for each cycle, which could be a possible correspondence of large earthquakes for each maximum of the gravitational force.
Next, we ascertain a possible connection with Moon phases New or Full, which are supposed to influence the larger earthquakes that occur worldwide for each Solar Cycles, as defined under moon cycles. Larger earthquakes magnitudes depend on the region in which they are happening. During this first approach we consider the magnitudes where M ≥ 7.5.
For these earthquakes, the following set of data includes dates, location, mag-nitudes, moon phases, and hemisphere, fit into each cycle, SC22, SC23, and SC24. The results show an oscillation between the moon and earth, which main-ly affects the tidal waves in the subduction zones.
We will present the data set for each section studied, explaining what the ex-plicit and imex-plicit sets are. Our data is composed of experimental data collected from different catalogs for Solar Cycless [4], [5]; perigee/apogee data sets [6][7], and, earthquakes [8][9][10]. In the case of earthquakes, it is possible to check the events in at least three worldwide catalogs.
2. The Perigee Force Variation
The lunar orbit around the Earth is elliptical therefore twice monthly is consi-dered to be at the Perigee (closest to the Earth) and twice at the Apogee (the furthest from Earth). The force among the two bodies is
2 Mm
F G
r
DOI: 10.4236/ojer.2019.84016 269 Open Journal of Earthquake Research In Equation (1), M is the Earth’s mass, m is the moon’s mass, G = 6.67 × 10⁻¹¹ N∙m2∙kg−2 are all constants, and the only variable is r2 which is the Earth-Moon distance. This variable is collected from the catalog [6] which also gives the value of the moon phases New Moon and Full Moon. Since the New or Full Moon sometimes are not closer to the earthquake occurrence, we also used [7].
The variation of the distance between the Earth and Moon gave a Perigee force during three Solar Cycless. The maximum F = 2.32 × 10²⁰ N and the min-imum is F = 2.14 × 10²⁰ N.
Several times the maximum values occurred near the Full or New Moon, but this was not a rule. The minimum values also occurring during the First or Third quarter. Therefore, there is not a real connection that the Full or New moon is attaching events at the Perigee position. The development of the force at the Pe-rigee position shows an oscillation corroborated for each cycle searched.
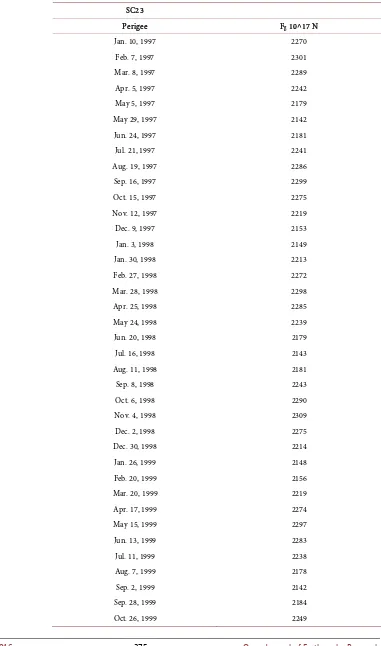
[image:3.595.254.492.326.491.2]We constructed Tables 1-3, for the moon cycle and the respective Solar Cycles, shown in Figures 1-3. In the figures, the maximum value corresponds to the maxima of the tidal force generated by the Equation (1).
Figure 1. SC22, the perigee variation force 1986-1996. The force is display-ing a wave, with small amplitude and large period.
[image:3.595.253.491.540.706.2]DOI: 10.4236/ojer.2019.84016 270 Open Journal of Earthquake Research Figure 3. Perigee force variation at Solar Cycles 24.
The variations of force among Earth and Moon could possibly explain the shallow moonquake occurrences. There are four types of moonquakes [11].
Deep moonquakes have a depth of nearly 700 km below the surface of the moon. Meteor impacts, two-week-long thermal moonquakes, and when the darkness covers half of the moon, the temperatures can fall to −240 degrees Fa-hrenheit.
When that same surface makes its return to sunshine, the temperature swings wildly back to +250 degrees Fahrenheit. When the frozen crust suddenly ex-pands, it can cause a moonquake. Shallow Moonquakes are the most powerful and the most worrisome for researchers and those eager to colonize the moon. Of the four types of quakes, these are the ones that could do some real damage.
The variation in gravitational force and oscillations created will affect the moon surface. This oscillation happens throughout the years and has a small amplitude and, large periods. The moon surface variation has different temper-atures in a small period that causes cracks and fractures in its surface. This probably affects all the body since when it contracts, the temperatures fall and when it dilates it rises. It would be a cause of shallow earthquakes on the moon.
According to the references, they only happened 28 times period 1972-1977, when seismological events were observed from the instrument astronauts left behind. The magnitude of quakes observed could reach M5 [11].
1) Solar Cycless, Perigee Variation, Large Earthquakes
DOI: 10.4236/ojer.2019.84016 271 Open Journal of Earthquake Research The following lists are the calculation of tide forces by each perigee position by month and year. We constructed Figures 1-3 in the text, with the data be-low.
Table 1. Perigee position distance, and Fg variation. Figure 1 is constructed with those values corresponding Solar Cycles 22
SC 22
Perigee Fg (10^17 N)
Jan. 8, 1986 2219
Feb. 4, 1986 2153
Mar. 1, 1986 2149
Mar. 28, 1986 2211
Apr. 25, 1986 2265
May 24, 1986 2297
Jun. 21, 1986 2289
Jul. 19, 1986 2249
Aug. 16, 1986 2190
Sep. 12, 1986 2142
Oct. 7, 1986 2172
Nov. 4, 1986 2237
Dec. 2, 1986 2289
Dec. 20, 1986 2303
Jan. 28, 2987 2274
Feb. 25, 1987 2214
Mar. 24, 1987 2151
Apr. 18, 1987 2156
May 15, 1987 2216
Jun.13, 1987 2270
Jul. 11, 1987 2298
Aug. 8, 1987 2290
Sep. 6, 1987 2249
Oct. 4, 1987 2187
Oct. 30, 1987 2139
Nov. 24, 1987 2177
Dec. 22, 1987 2245
Jan. 19, 1988 2292
Feb. 17, 1988 2292
DOI: 10.4236/ojer.2019.84016 272 Open Journal of Earthquake Research Continued
Apr. 13, 1988 2207
May 10, 1988 2151
Jun. 4, 1988 2157
Jul. 2, 1988 2215
Jul. 30, 1988 2268
Aug. 27, 1988 2297
Sep. 25, 1988 2289
Oct. 23, 1988 2246
Nov. 20, 1988 2181
Dec. 16, 1988 2135
Jan. 10, 1989 2182
Feb. 7, 1989 2249
Mar. 8, 1989 2292
Apr. 5, 1989 2296
May 4, 1989 2263
Jun. 1, 1989 2206
Jun. 28, 1989 2152
Jul. 23, 1989 2158
Aug. 19, 1989 2216
Sep. 16, 1989 2272
Oct. 15, 1989 2302
Nov. 12, 1989 2293
Dec. 20, 1989 2244
Jan. 7, 1990 2175
Feb. 2, 1990 2138
Feb. 28, 1990 2190
Mar. 28, 1990 2253
Apr. 25, 1990 2292
May 21, 1990 2294
Jun. 21, 1990 2261
Jul. 19, 1990 2205
Aug. 15, 1990 2151
Sep. 9, 1990 2159
Oct. 6, 1990 2220
Nov. 3, 1990 2278
Dec. 2, 1990 2305
Dec. 30, 1990 2289
DOI: 10.4236/ojer.2019.84016 273 Open Journal of Earthquake Research Continued
Feb. 25, 1991 2168
Mar. 22, 1991 2141
Apr. 17, 1991 2194
May 15, 1991 2253
Jun. 13, 1991 2289
Jul. 11, 1991 2291
Aug. 8, 1991 2259
Sep. 5, 1991 2203
Oct. 2, 1991 2147
Oct. 27, 1991 2159
Nov. 24, 1991 2224
Dec. 22, 1991 2281
Jan. 19, 1992 2304
Feb. 17, 1992 2285
Mar. 16, 1992 2230
Apr. 13, 1992 2171
May 8, 1992 2145
Jun. 4, 1992 2195
Jul. 2, 1992 2253
Jul. 30, 1992 2289
Aug. 27, 1992 2294
Sep. 25, 1992 2261
Oct. 23, 1992 2202
Nov. 19, 1992 2143
Dec. 13, 1992 2164
Jan. 10, 1993 2232
Feb. 7, 1993 2287
Mar. 8, 1993 2305
Apr. 5, 1993 2281
May 4, 1993 2227
May 31, 1993 2166
Jun. 25, 1993 2147
Jul. 22, 1993 2197
Aug. 19, 1993 2279
Sep. 16, 1993 2293
Oct. 15, 1993 2295
Nov. 12, 1993 2259
Dec. 10, 1993 2194
DOI: 10.4236/ojer.2019.84016 274 Open Journal of Earthquake Research Continued
Jan. 31, 1994 2170
Feb. 17, 1994 2237
Mar. 28, 1994 2286
Apr. 25, 1994 2301
May 24, 1994 2275
Jun. 21, 1994 2224
Jul. 18, 1994 2165
Aug. 12, 1994 2146
Sep. 8, 1994 2197
Oct. 6, 1994 2257
Nov. 3, 1994 2296
Dec. 2, 1994 2295
Dec. 30, 1994 2254
Jan. 27, 1995 2188
Feb. 23, 1995 2138
Mar. 20, 1995 2175
Apr. 17, 1995 2239
May 15, 1995 2285
Jun. 13, 1995 2298
Jul. 11, 1995 2276
Aug. 8, 1995 2225
Sep. 5, 1995 2164
Sep. 30, 1995 2146
Oct. 26, 1995 2201
Nov. 23, 1995 2265
Dec. 22, 1995 2301
Jan. 19, 1996 2295
Feb. 17, 1996 2249
Mar. 16, 1996 2183
Apr. 11, 1996 2141
May 6, 1996 2181
Jun. 3, 1996 2242
Jul. 1, 1996 2286
Jul. 30, 1996 2299
Aug. 27, 1996 2276
Sep. 24, 1996 2223
Oct. 22, 1996 2159
Nov. 16, 1996 2146
DOI: 10.4236/ojer.2019.84016 275 Open Journal of Earthquake Research Table 2. Perigee position distance, and Fg variation. Figure 2 is constructed with these values. Solar Cycles 23.
SC23
Perigee Fg 10^17 N
Jan. 10, 1997 2270
Feb. 7, 1997 2301
Mar. 8, 1997 2289
Apr. 5, 1997 2242
May 5, 1997 2179
May 29, 1997 2142
Jun. 24, 1997 2181
Jul. 21, 1997 2241
Aug. 19, 1997 2286
Sep. 16, 1997 2299
Oct. 15, 1997 2275
Nov. 12, 1997 2219
Dec. 9, 1997 2153
Jan. 3, 1998 2149
Jan. 30, 1998 2213
Feb. 27, 1998 2272
Mar. 28, 1998 2298
Apr. 25, 1998 2285
May 24, 1998 2239
Jun. 20, 1998 2179
Jul. 16, 1998 2143
Aug. 11, 1998 2181
Sep. 8, 1998 2243
Oct. 6, 1998 2290
Nov. 4, 1998 2309
Dec. 2, 1998 2275
Dec. 30, 1998 2214
Jan. 26, 1999 2148
Feb. 20, 1999 2156
Mar. 20, 1999 2219
Apr. 17, 1999 2274
May 15, 1999 2297
Jun. 13, 1999 2283
Jul. 11, 1999 2238
Aug. 7, 1999 2178
Sep. 2, 1999 2142
Sep. 28, 1999 2184
DOI: 10.4236/ojer.2019.84016 276 Open Journal of Earthquake Research Continued
Nov. 23, 1999 2295
Dec. 22, 1999 2303
Jan. 19, 2000 2268
Feb. 17, 2000 2206
Mar. 14, 2000 2145
Apr. 8, 2000 2160
May 6, 2000 2211
Jun. 3, 2000 2269
Jul. 1, 2000 2317
Jul. 30, 2000 2281
Aug. 27, 2000 2237
Sep. 24, 2000 2175
Oct. 19, 2000 2139
Nov. 14, 2000 2186
Dec. 12, 2000 2253
Jan. 10, 2001 2297
Feb. 7, 2001 2300
Mar. 8, 2001 2263
Apr. 5, 2001 2201
May 2, 2001 2147
May 27, 2001 2163
Jun. 23, 2001 2222
Jul. 21, 2001 2273
Aug. 19, 2001 2297
Sep. 16, 2001 2284
Oct. 14, 2001 2237
Nov. 11, 2001 2172
Dec. 6, 2001 2139
Jan. 2, 2002 2193
Jan. 30, 2002 2260
Feb. 27, 2002 2299
Mar. 28, 2002 2298
Apr. 25, 2002 2259
May 23, 2002 2199
Jun. 19, 2002 2147
Jul. 14, 2002 2164
Aug. 10, 2002 2224
Sep. 8, 2002 2276
Oct. 6, 2002 2299
Nov. 4, 2002 2283
DOI: 10.4236/ojer.2019.84016 277 Open Journal of Earthquake Research Continued
Dec. 30, 2002 2164
Jan. 23, 2003 2141
Feb. 19, 2003 2201
Mar. 19, 2003 2263
Apr. 17, 2003 2297
May 15, 2003 2293
Jun. 12, 2003 2255
Jul. 10, 2003 2197
Aug. 6, 2003 2146
Aug. 31, 2003 2164
Sep. 28, 2003 2225
Oct. 26, 2003 2279
Nov. 23, 2003 2301
Dec. 22, 2003 2281
Jan. 19, 2004 2226
Feb. 16, 2004 2159
Mar. 12, 2004 2146
Apr. 8, 2004 2204
May 6, 2004 2263
Jun. 3, 2004 2295
Jul. 1, 2004 2293
Jul. 30, 2004 2256
Aug. 27, 2004 2198
Sep. 22, 2004 2145
Oct. 18, 2004 2166
Nov. 14, 2004 2232
Dec. 12, 2004 2286
Jan. 10, 2005 2304
Feb. 7, 2005 2279
Mar. 8, 2005 2220
Apr. 4, 2005 2157
Apr. 29, 2005 2151
May 23, 2005 2208
Jun. 23, 2005 2252
Jul. 21, 2005 2297
Aug. 19, 2005 2293
Sep. 16, 2005 2255
Oct. 14, 2005 2194
Nov. 10, 2005 2139
Dec. 5, 2005 2171
DOI: 10.4236/ojer.2019.84016 278 Open Journal of Earthquake Research Continued
Jan. 30, 2006 2289
Feb. 27, 2006 2300
Mar. 28, 2006 2271
Apr. 25, 2006 2214
May 22, 2006 2156
Jun. 16, 2006 2152
Jul. 13, 2006 2208
Aug. 10, 2006 2264
Sep. 8, 2006 2296
Oct. 6, 2006 2293
Nov. 3, 2006 2251
Dec. 2, 2006 2188
Dec. 28, 2006 2136
Jan. 22, 2007 2185
Feb. 19, 2007 2242
Mar. 19, 2007 2288
Apr. 17, 2007 2297
May 15, 2007 2268
Jun. 12, 2007 2214
Jul. 9, 2007 2157
Aug. 3, 2007 2153
Aug. 31, 2007 2209
Sep. 28, 2007 2268
Oct. 26, 2007 2302
Nov. 24, 2007 2296
Dec. 22, 2007 2250
Jan. 19, 2008 2182
Feb. 14, 2008 2137
Mar. 10, 2008 2183
Apr. 7, 2008 2247
May 6, 2008 2289
Jun. 3, 2008 2295
Jul. 1, 2008 2267
July 29, 2008 2212
Aug. 26, 2008 2155
Sep. 20, 2008 2153
Oct. 17, 2008 2213
Nov. 14, 2008 2273
DOI: 10.4236/ojer.2019.84016 279 Open Journal of Earthquake Research Table 3. Perigee position distance and Fg variation. Figure 3 is constructed with these values. Solar Cycles 24.
SC24
Perigee day Fg (10^17 N)
Jan. 10, 2009 2292
Feb. 7, 2009 2242
Mar. 7, 2009 2175
April. 2, 2009 2139
Apr. 28, 2009 2186
May 26, 2009 2246
Jun. 23, 2009 2286
Jul. 21, 2009 2293
Aug. 19, 2009 2265
Sep. 16, 2009 2210
Oct. 13, 2009 2151
Nov. 7, 2009 2153
Dec. 4, 2009 2217
Jan. 1, 2010 2278
Jan. 30, 2010 2303
Feb. 27, 2010 2288
Mar. 28, 2010 2237
Apr. 24, 2010 2173
May 20, 2010 2143
Jun. 15, 2010 2188
July. 13, 2010 2246
Aug. 10, 2010 2288
Sep. 8, 2010 2296
Oct. 6, 2010 2267
Nov. 3, 2010 2209
Nov. 10, 2010 2146
Dec. 25, 2010 2158
Jan. 22, 2011 2226
Feb. 19, 2011 2283
Mar. 19, 2011 2304
Apr. 17, 2011 2285
May. 15, 2011 2234
Jun. 12, 2011 2173
Jul. 7, 2011 2145
DOI: 10.4236/ojer.2019.84016 280 Open Journal of Earthquake Research Continued
Aug. 30, 2011 2249
Sep. 28, 2011 2291
Oct. 26, 2011 2298
Nov. 23, 2011 2264
Dec. 22, 2011 2201
Jan. 17, 2012 2141
Feb. 11, 2012 2164
Mar. 10, 2012 2230
Apr. 7, 2012 2281
May 6, 2012 2299
Jun. 3, 2012 2279
Jul. 1, 2012 2231
Jul. 29, 2012 2171
Aug. 23, 2012 2143
Sep. 19, 2012 2189
Oct. 17, 2012 2252
Nov. 14, 2012 2294
Dec. 12, 2012 2298
Jan. 10, 2013 2259
Feb. 7, 2013 2195
Mar. 5, 2013 2140
Mar. 31, 2013 2169
Apr. 27, 2013 2232
May. 27, 2013 2281
Jun. 23, 2013 2299
Jul. 21, 2013 2281
Aug. 9, 2013 2232
Sep. 15, 2013 2170
Oct. 10, 2013 2142
Nov. 6, 2013 2195
Dec. 4, 2013 2259
Jan. 1, 2014 2299
Jan. 30, 2014 2298
Feb. 27, 2014 2255
Mar. 27, 2014 2190
Apr. 23, 2014 2142
DOI: 10.4236/ojer.2019.84016 281 Open Journal of Earthquake Research Continued
Jun. 15, 2014 2235
Jul. 13, 2014 2282
Aug. 10, 2014 2299
Sep. 8, 2014 2281
Oct. 6, 2014 2229
Nov. 3, 2014 2165
Nov. 27, 2014 2142
Dec. 24, 2014 2201
Jan. 21, 2015 2265
Feb. 19, 2015 2299
Mar. 19, 2015 2291
Apr. 17, 2015 2248
May 15, 2015 2187
Jun. 10, 2015 2143
Jul. 5, 2015 2174
Aug. 2, 2015 2234
Aug. 30, 2015 2283
Sep. 28, 2015 2301
Oct. 26, 2015 2279
Nov. 23, 2015 2225
Dec. 21, 2015 2158
Jan. 15, 2016 2144
Feb. 11, 2016 2207
Mar. 10, 2016 2267
Apr. 7, 2016 2296
May 6, 2016 2288
Jun. 3, 2016 2245
Jul. 1, 2016 2187
Jul. 27, 2016 2144
Aug. 22, 2016 2174
Sep. 18, 2016 2237
Oct. 16, 2016 2288
Nov. 14, 2016 2305
Dec. 12, 2016 2279
Jan. 10, 2017 2220
Feb. 76, 2017 2154
Mar. 3, 2017 2151
DOI: 10.4236/ojer.2019.84016 282 Open Journal of Earthquake Research Continued
April 27, 2017 2269
May 26, 2017 2296
Jun. 23, 2017 2287
Jul. 21, 2017 2245
Aug. 18, 2017 2185
Sep. 13, 2017 2142
Oct. 9, 2017 2177
Nov. 6, 2017 2242
Dec. 4, 2017 2292
Jan. 1, 2018 2304
Jan. 30, 2018 2273
Feb. 27, 2018 2212
Mar. 26, 2018 2150
Apr. 20, 2018 2155
May 17, 2018 2214
Jun. 14, 2018 2267
Jul. 13, 2018 2293
Aug. 10, 2018 2285
Sep. 8, 2018 2244
Oct. 5, 2018 2182
Oct. 31, 2018 2138
Nov. 26, 2018 2179
Dec. 24, 2018 2247
d dt = − Φ
(2) In the equation Φ is the flux of the magnetic field, and is the electromo-tive force (EMF). Therefore, Sun, rotating its axis in connection with Earth’s magnetic field the Birkeland currents [13], [14], [15] and [16]. During a Solar Cycles, the Birkeland currents intensities will increase during a solar maximum for each cycle or if exceptional Coronal Mass Ejections, X flares or solar storms occur, enhancing the parallel currents and auroral lines Figure 4.
Previously we pointed out that solar storms and induced currents at the mag-netosphere and ionosphere from such interaction would disturb not only the magnetosphere, but also the Earth’s surface.
The Earth field is squeezed when Solar Wind speeds increase. The solar wind velocity varies in range of 300 - 800 km/s. Those variations affect the Earth’s magnetic field with strong geomagnetic storms.
DOI: 10.4236/ojer.2019.84016 283 Open Journal of Earthquake Research Figure 4. This file is ineligible for copyright and therefore in the public domain because it consists entirely of information that is common property and contains no original au-thorship. The sun magnetic field lines, it varies with the solar wind speed and rotation on its axis.
also makes the dipolar magnetic field rotates. The interplanetary field is one Gauss double of the Earth’s magnetic field on average. The interaction between both magnetic fields, the rotation of both bodies, and the Solar wind speed vari-ations enhances the currents, which is known as aurora borealis.
The current intensity is enhanced by Solar wind speed variations during Co-ronal Mass Ejects and X flares directed toward the Earth’s magnetosphere, [17].
The Solar Cycless are the Sun’s magnetic field moving in a cycle. Most of the Solar Cycless are approximately eleven years, at which point the Sun’s magnetic field completely flips, north and south poles exchange places. The sunspots are caused by the Sun’s magnetic fields, and its varying activity during the cycles.
The beginning of a Solar Cycles is a minimum, when the Sun has the least sunspots, as we are having now in the middle of 2019. Over time, solar activity will rise, and the number of sunspots will increase. Solar Cycless have been ob-served since 1755 which is considered Solar Cycles 1.
Here, we are working with the following Solar Cycless; Solar Cycles 22, 1986-1996; Solar Cycles 23; 1996 (June)-2008, and Solar Cycles 24; 2008 (Jan-uary)-2019 (possible end cycle). From the three pictures, we observed the Moon, when at the Perigee creates an oscillation with a period range of 52,080 hours-54,000 hours. The moon’s speed around Earth is 3883 km/h and generate a wavelength that varies between −1.94 × 10⁷ km - 2.05 × 10⁷ km. It is possible to research if this wave would influence the rise of earthquakes.
DOI: 10.4236/ojer.2019.84016 284 Open Journal of Earthquake Research on Dec. 12 both during the Full moon. For the Solar Cycles 23 (1996-2008), the maximum occurred in March 2000, when the following quake events occurred May 25, May 28, June 18, November 16, November 17, all, during the Full moon. During the Solar Cycles 24 (2008-2019 September) the maximum occurred on April 2014, when five events occurred, four in April, two under the New Moon, and two during the Full Moon and one in June, under the New Moon. There-fore, the variation of the Sun magnetic field, through its cycle, showed to be stronger during the Full Moon. Examining Tables 1-3 the events occurred at the years of Maximum Solar activity and most of the New or Full moon events oc-curred before the earthquakes.
Here we can determine that the activity of large earthquakes will appear most at the Full moon at the maximum of Solar Cycless. Our research indicates that the Solar Magnetic Force is much more important to events on Earth than the gravitational ones between the Sun-Earth interactions. The Sun has a large and helicoidal field; the magnetic field in average on the Sun is around 1 Gauss. It is twice as strong as the average field on the surface of Earth (0.5 Gauss). This pa-ragraph shows that if there is any stronger interaction between Sun-Earth it will be more in their magnetic field variation.
2) Larger Earthquakes, Moon Phases
There are four moon phases: new moon, full moon, first quarter and third quarter, and the phases in between. In this part of our research, we consider only New or Full Moon, the difference between the data and the possible connection with a large earthquake event. In the paper, [1] an extensive study was done to determine if any Moon phase was more likely to happen an earthquake M > 4.5. At a full moon, the Earth, Moon, and Sun are in approximate alignment, just as with the New Moon, however, the moon is on the opposite side of the earth. Therefore, the entire sunlit part of the moon is facing us. To figure out if the importance of these two phases, our Tables 1-3 are constructed for each Solar Cycles; 22, 23 and 24, and the quakes searched have a magnitude M ≥ 7.5 worldwide. Besides, the day, location and, magnitude are determined by the Moon phase on the day it happened and, also the Hemisphere. [18] The hemis-phere is important for greater earthquakes since we showed in a former paper that the larger earthquakes are taking place at subduction zones which are lo-cated more at the Southern Hemisphere. The next three Tables show small dif-ferences found in the data set.
Next Table 4 defining the largest earthquakes which occurred during the SC 22.
DOI: 10.4236/ojer.2019.84016 285 Open Journal of Earthquake Research Table 4. This table is showing the events of the earthquakes during period 1986-1997 (Solar Cycles 22) magnitudes M > 7.5, the locations, and the closest Moon phase at the time (Full or New), also the Hemisphere in which it occurred.
Data Location Mag Moon phase Hemisphere
July 5, 1986 Aleutian Islands 8 July 7, New North August 14, 1986 Molucca Sea 7.5 Aug. 19, Full South October 20, 1986 Kermadec Is 7.5 Oct. 17, Full South Mar. 6, 1987 Chile coast 7.6 Feb. 28, Full South November 30, 1987 Alaska 7.8 Nov. 30, New North
June 3, 1988 Alaska 7.8 May 27, New North
August 10, 1988 Solomon Is 7.8 Aug. 9, Full South
November 6, 1988 China 7.7 Nov. 9, New North
May 23, 1989 Macquarie Is 8.1 May 20, Full North Dec. 15, 1989 Philippines 7.6 Dec. 12, Full South
Mar. 3, 1990 Fiji Is 7.6 Feb. 25, New South
April 5, 1990 Mariana Is 7.6 Mar. 26, New North April 18, 1990 Indonesia 7.8 Apr. 10, New South July 16, 1990 Philippines 7.7 July 8, New South Dec. 30, 1990 New Britain 7.5 Dec. 31, Full South Apr. 22, 1991 Costa Rica 7.6 Apr. 14, New North June 20, 1991 Indonesia 7.5 Jun. 12, New South Dec. 22, 1991 Kuril Is 7.5 Dec. 21, Full South Oct. 2, 1992 Nicaragua 7.7 Sep. 26, New North Dec. 12, 1992 Indonesia 7.8 Dec. 9, Full South
January 15, 1993 Japan 7.5 Jan. 8, Full North
June 8, 1993 Russia 7.5 Jun. 4, Full North
July 12, 1993 Japan 7.7 July 19, New North
August 8, 1993 Mariana Is 7.5 Aug. 2, Full North
Mar. 9, 1994 Fiji Is 7.5 Mar. 12, New South
Jun. 2, 1994 Java (South) 7.8 May 25, Full South June 9, 1994 Bolivia (North) 8.2 Jun. 9, New South
Oct. 4, 1994 Kuril Is 8.2 Oct. 5, New North
Dec. 28, 1994 Japan 7.7 Jan. 1, New North
DOI: 10.4236/ojer.2019.84016 286 Open Journal of Earthquake Research Continued
Feb. 17, 1996 Indonesia 8.1 Feb. 18, New South June 10, 1996 Aleutian Islands 7.6 Jun. 16, New North June 17, 1996 Flores sea 7.7 Jun. 16, New South Nov. 12, 1996 Peru coast 7.5 Nov. 11, New South April 4, 1997 Sta Cruz 7.7 Apr. 7, New South
Nov. 8, 1997 China 7.5 Nov. 14, Full North
[image:20.595.211.539.81.366.2]Dec. 12, 1997 Russia 7.8 Dec. 14, Full North
Figure 5. Solar Cycles 22, the occurrence of quakes M ≥ 7.5, by hemisphere.
Figure 6. Solar Cycles 22, earthquakes M ≥ 7.5 and the full or new moon occurrences.
The quasi-totality of larger events occurred at the subduction zones most fre-quently on the Pacific side. Pacific side is the location of most of the subduction zones if compared with Mediterranean. Rare occurrences on the Mediterranean subduction zones point out other diverse mechanisms, more than just the one discussed in this paper [18], [19].
Nevertheless, happened some exceptions to subduction zones occurred on the Myanmar-China border (1988), magnitude M7.7. Another one in Kizan (1997), M 7.5, and the last one in Northern Bolivia (1994), M8.2, at a location in a rup-ture point depth of 631.3 km below the surface. The conclusion for this Solar Cycless examining larger earthquakes indicates a possible connection between the tidal variation but not a strong bond with the Moon Phases.
[image:20.595.284.464.403.506.2]DOI: 10.4236/ojer.2019.84016 287 Open Journal of Earthquake Research this point. Neither the Perigee variation enhances the frequency or magnitude of such earthquakes. Instead, the variation of the tidal wave boosts the possibility of events in such regions with a delayed time to take effect on the earthquake surge. As observed, seldom times it will happen during the perigee when the moon is closest to the Earth (two times). Southern Hemisphere occurrences are more frequent since the world presents huge rupture points in South America where the depths of earthquakes are below 600 km another one near the Fiji Islands (depths bigger than 700 km) as it will be explained in a subsequent search.
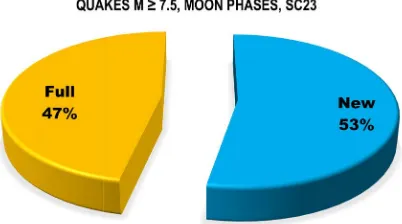
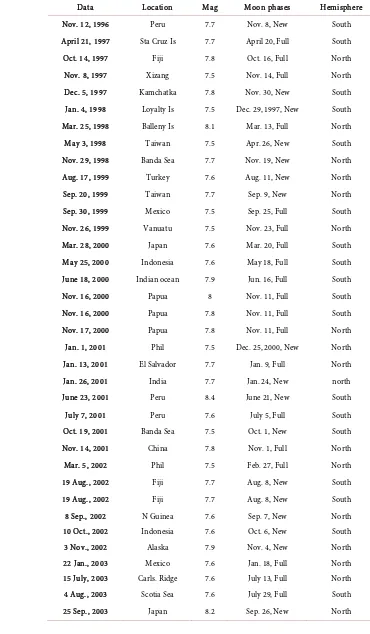
Table 5 belongs to the Solar Cycles 23 and defining the largest earthquakes occurred into the period 1997-2008. There are 63 events in total with M ≥ 7.5 showing similar results from Table 4 (SC22). In this table, an occurrence at the Southern Hemisphere for larger quakes happened 54% Figure 7. From those quakes, relevant difference as New Moon had 53% quakes, at Full 47% tremors as shown at Figure 8. Earthquakes above or equal M7.8 are highlighted in green, Table 5.
Table 6 refers to the events to Solar Cycles 24, the last Cycle analyzed, we also highlighted the events M ≥ 7.8 in yellow. This Cycle had a total of 66 tremors M ≥ 7.5 almost the same number of tremors as in the Cycle 23. Here the percentage of quakes that happened at the Southern is double of the Northern, see Figure 9. Figure 10 shows 57% of earthquakes happened at the New Moon.
[image:21.595.284.463.444.553.2]If it is considered the period 1986-2018 the earthquakes M ≥ 7.5 happened 59% at the Southern Hemisphere and, 55% during the New Moon. Next, it is a study for the largest earthquakes and their occurrences by magnitude, phase and hemisphere.
[image:21.595.272.473.591.703.2]Figure 7. SC23 showing the percentage of M ≥ 7.5 earthquakes in each Hemisphere.
DOI: 10.4236/ojer.2019.84016 288 Open Journal of Earthquake Research Table 5. Belongs to the period defined as the Solar Cycles 23, and the largest earthquakes occurred at the period.
Data Location Mag Moon phases Hemisphere
Nov. 12, 1996 Peru 7.7 Nov. 8, New South
April 21, 1997 Sta Cruz Is 7.7 April 20, Full South
Oct. 14, 1997 Fiji 7.8 Oct. 16, Full North
Nov. 8, 1997 Xizang 7.5 Nov. 14, Full North
Dec. 5, 1997 Kamchatka 7.8 Nov. 30, New South Jan. 4, 1998 Loyalty Is 7.5 Dec. 29, 1997, New South Mar. 25, 1998 Balleny Is 8.1 Mar. 13, Full North
May 3, 1998 Taiwan 7.5 Apr. 26, New South
Nov. 29, 1998 Banda Sea 7.7 Nov. 19, New North
Aug. 17, 1999 Turkey 7.6 Aug. 11, New North
Sep. 20, 1999 Taiwan 7.7 Sep. 9, New North
Sep. 30, 1999 Mexico 7.5 Sep. 25, Full South
Nov. 26, 1999 Vanuatu 7.5 Nov. 23, Full North
Mar. 28, 2000 Japan 7.6 Mar. 20, Full South
May 25, 2000 Indonesia 7.6 May 18, Full South June 18, 2000 Indian ocean 7.9 Jun. 16, Full South
Nov. 16, 2000 Papua 8 Nov. 11, Full South
Nov. 16, 2000 Papua 7.8 Nov. 11, Full South
Nov. 17, 2000 Papua 7.8 Nov. 11, Full North
Jan. 1, 2001 Phil 7.5 Dec. 25, 2000, New North Jan. 13, 2001 El Salvador 7.7 Jan. 9, Full North
Jan. 26, 2001 India 7.7 Jan. 24, New north
June 23, 2001 Peru 8.4 June 21, New South
July 7, 2001 Peru 7.6 July 5, Full South
Oct. 19, 2001 Banda Sea 7.5 Oct. 1, New South
Nov. 14, 2001 China 7.8 Nov. 1, Full North
Mar. 5, 2002 Phil 7.5 Feb. 27, Full North
19 Aug., 2002 Fiji 7.7 Aug. 8, New South
19 Aug., 2002 Fiji 7.7 Aug. 8, New South
8 Sep., 2002 N Guinea 7.6 Sep. 7, New North
10 Oct., 2002 Indonesia 7.6 Oct. 6, New South
3 Nov., 2002 Alaska 7.9 Nov. 4, New North
22 Jan., 2003 Mexico 7.6 Jan. 18, Full North
15 July, 2003 Carls. Ridge 7.6 July 13, Full North 4 Aug., 2003 Scotia Sea 7.6 July 29, Full South
DOI: 10.4236/ojer.2019.84016 289 Open Journal of Earthquake Research Continued
17 Nov., 2003 Alaska 7.8 Nov. 9, Full North
11 Nov., 2004 Indonesia 7.5 Nov. 12, New South 23 Dec., 2004 Macq. Is 8.1 Dec. 26, Full South 26 Dec., 2004 Sumatra 9.1 Dec. 26, Full North 28 Mar., 2005 Indonesia 8.6 Mar. 25, Full North
13 June, 2005 Chile 7.8 June 6, New South
9 Sep., 2005 Papua 7.6 Sep. 3, New South
26 Sep., 2005 Peru 7.5 Sep. 18, Full South
8 Oct., 2005 Pakistan 7.6 Oct. 3, New North
27 Jan., 2005 Banda Sea 7.6 Jan. 29, New South
20 Apr., 2006 Russia 7.6 Apr. 13, Full North
3 May, 2006 Tonga 8 Apr. 27, New South
17 July, 2006 Java 7.7 Jul. 11, Full South
15 Nov., 2006 Kuril Is 8.3 Nov. 20, New North
13 Jan., 2007 Kuril Is 8.1 Jan. 19, New North 21 Jan., 2007 Molucca Sea 7.5 Jan. 19, New South 1 Apr., 2007 Solomon Is 8.1 Apr. 2, Full South 8 Aug., 2007 Indonesia 7.5 Jul. 30, Full South
15 Aug., 2007 Peru 8 Aug. 12, New South
12 Sep., 2007 Indonesia 8.4 Sep. 11, New South 12 Sep., 2007 Indonesia 7.9 Sep. 11, New South
28 Sep., 2007 Japan 7.5 Sep. 26, Full North
14 Nov., 2007 Chile 7.7 Nov. 9, New South
9 Dec., 2007 Fiji 7.8 Dec. 9, New South
12 May, 2008 China 7.9 May 5, New North
[image:23.595.216.538.84.529.2]5 July, 2008 Okhotsk Sea 7.7 Jul. 3, New North
Table 6. Larger earthquakes (M ≥ 7.5) during the Solar Cycles 24, data, location, moon phase (new/full) and hemisphere. The data highlighted are M ≥ 7.8.
Data Location Mag Moon phase Hemisphere
Jan. 3, 2009 Indonesia 7.7 Dec. 27 (08), New South
Mar. 19, 2009 Tonga 7.6 Mar. 11, Full South
July 15, 2009 New Zealand 7.8 Jul. 7, Full South
August 10, 2009 India 7.5 Aug. 6, Full North
Sep. 29, 2009 Samoa Is 8.1 Sep. 18, New South
Sep. 30, 2009 Indonesia 7.6 Sep. 18, New South
Oct. 9, 2009 Vanuatu 7.7 Oct. 4, Full South
DOI: 10.4236/ojer.2019.84016 290 Open Journal of Earthquake Research Continued
Feb. 27, 2010 Chile 8.8 Feb. 28, Full South
Apr. 6, 2010 Indonesia 7.8 Mar. 30, Full South
Jun. 12, 2010 India 7.5 Jun. 12, New North
Jul. 23, 2010 Philippines 7.6 Jul. 26, Full South July 23, 2010 Philippines 7.5 Jul. 26, Full South Oct. 25, 2010 Indonesia 7.8 Oct. 23, Full South
Mar. 3, 2011 Japan 9.1 Mar. 4, New North
Mar. 11, 2011 Japan 7.9 Mar. 4, New North
Mar. 11, 2011 Japan 7.7 Mar. 4, New North
July 6, 2011 Kermadec Is 7.6 Jul. 1, New South
Apr. 11, 2012 Sumatra 8.6 April 6, Full South
April 11, 2012 Sumatra 8.2 April 6, Full South Aug. 14, 2012 Sea of Okhotsk 7.7 Aug. 17, New North Aug. 31, 2012 Philippines 7.6 Aug. 31, New North Sep. 5, 2012 Costa Rica 7.6 Aug. 31, New North
Oct. 28, 2012 Canada 7.8 Oct. 20, New North
Jan. 5, 2013 Alaska 7.5 Dec. 28, Full North
Feb. 6, 2013 Solomon Is 8 Feb. 10, New South
Apr. 16, 2013 Iran 7.7 Apr. 10, New North
May 24, 2013 Sea of Okhotsk 8.3 May 25, Full North Sep. 24, 2013 Pakistan 7.7 Sep. 19, Full North Nov. 13, 2013 Scotia Sea 7.7 Nov. 17, Full South
Apr. 1, 2014 Chile 8.2 Mar. 30, New South
Apr. 3, 2014 Chile 7.7 Mar. 30, New South
Apr. 12, 2014 Solomon Is 7.6 Apr. 15, Full South
Apr 19, 2014 Papua 7.5 Apr. 15, Full South
Jun. 23, 2014 Alaska 7.9 Jun. 27, New North
Mar. 29, 2015 Papua 7.5 Mar. 20, New South
Apr. 25, 2015 Nepal 7.8 Apr. 18, New North
May 5, 2015 Papua 7.5 May 4, Full South
May 30, 2015 Japan 7.8 Jun. 2, Full North
Sep. 16, 2015 Chile 8.3 Sep. 13, New South
Oct. 26, 2015 Afghanistan 7.5 Oct. 27, Full North
Nov. 24, 2015 Peru 7.6 Nov. 25, Full South
Nov. 24, 2015 Brazil 7.6 Nov. 25, full South
Mar. 2, 2016 Indonesia 7.8 Mar. 9, New South
Apr. 16, 2016 Ecuador 7.8 Apr. 7, New South
DOI: 10.4236/ojer.2019.84016 291 Open Journal of Earthquake Research Continued
Nov. 13, 2016 N. Zealand 7.8 Nov. 14, Full South Dec. 8, 2016 Solomon Is 7.8 Nov. 29, New South
Dec. 17, 2016 Papua 7.9 Dec. 14, New South
Dec. 25, 2016 Chile 7.6 Dec. 29, New South
Jan. 22, 2017 Papua 7.9 Jan. 11, New South
Jul. 17, 2017 Russia 7.7 Jul. 9, New North
Sep. 8, 2017 Mexico 8.2 Sep. 6, New North
Jan. 10, 2018 Honduras 7.5 Jan. 2, Full North
Jan. 23, 2018 Alaska 7.9 Jan. 17, New North
Feb. 22, 2019 Papua 7.5 Feb. 15, New South
Aug. 19, 2018 Fiji 8.2 Aug. 11, New South
Sep. 6, 2018 Fiji 7.9 Sep. 9, New South
Sep. 28, 2018 Indonesia 7.5 Sep. 25, Full South Dec. 5, 2018 N. Caledonia 7.5 Dec. 7, New South
Feb. 22, 2019 Ecuador 7.5 Feb. 19, New South
May 14, 2019 Papua 7.6 May 18, New South
[image:25.595.209.541.81.526.2]May 26, 2019 Peru 7.5 May 18, New South
Figure 9. Solar Cycles 24 showing the relation North/south hemisphere for earthquakes M ≥ 7.5.
[image:25.595.279.470.573.688.2]DOI: 10.4236/ojer.2019.84016 292 Open Journal of Earthquake Research
3. Solar Cycles 22, Solar Cycles 23, Solar Cycles 24,
Comparisons with Data
The data set for three Solar Cycless, make it possible to find out how much the gravitational force of Moon-Earth variation and the tectonics influence on sub-duction zones can increase the number of events during these periods. Initially we considered larger events the earthquakes M ≥ 7.5 separating by cycles.
Comparing the events found the Solar Cycles 22 has the smallest number of larger events. During Solar Cycles 22, 44 larger events, Solar Cycles 23, 63 larger events, and Solar Cycles 24, 66 larger events occurred. Solar Cycles 24, present-ing double the number of tremors at the Southern Hemisphere than the other two cycles. Also, the quakes happened with more frequency at or close to the New Moon. Therefore, there is the Solar Cycless maximum, Moon Phases (New or Full), and the correlated variation on the tidal forces as we did at the first part of this paper. All these variables appear to be correlated to the of subduction zones locations. Full moon looks to be important during the Solar Cycles maximum, when the biggest events occurred at the subduction zones and tightly correlated with this phase.
Largest (M ≥ 7.8) Earthquakes vs. Moon Phases, Hemispheres
The latest results from Section 3 showed that earthquakes tend to appear in the Southern Hemisphere during the new moon. The goal now is to study what happens to the highest magnitude earthquakes that occurred in the last three cycles over a period between 1986-2018. We extracted the highlighted data from the last three Tables 4-6 and constructed three new ones.
Tables 7-9 are earthquakes with magnitude M ≥ 7.8 for each cycle studied. The tables show the date they occurred, the locations, hemisphere magnitude, with a difference as the exact moon phase nearest the occurred earthquake.
Table 7 displays the largest earthquakes M ≥ 7.8 during the Solar Cycles 22. The column for the Moon phases, showing the closest phase to the event, two events occurred at the 1st Q, five at the New moon, two at the 3rd Q and four at the full Moon. Therefore, the New moon is still the phase when more events happened for this Cycle.
Table 8, the relation between the Moon phases and the earthquakes are the following, four at the 1st Q, five at the 3rd Q, five at the Full moon, and nine at the New moon. On this cycle the New moon has a higher occurrence than the other three phases, SC23.
Table 9 is the last cycle studied or SC24 displaying the major events with the same parameters analyzed for the other two cycles. In this cycle the moon phases are six for New and 3rdQ, and eight for Full and 1st Q.
DOI: 10.4236/ojer.2019.84016 293 Open Journal of Earthquake Research Table 7. Showing the parameters for the largest earthquakes on the cycle SC2, M ≥ 7.8.
Data Location Mag Moon phase Hemisphere
Nov. 30, 1987 Alaska 7.8 Nov. 28, 1st Q North Aug 10, 1988 Solomon Is 7.8 Aug. 12, New South May 23, 1989 Macquarie Is 8.1 May 20, Full North April 18, 1990 Indonesia 7.8 Apr. 18, 3rd South
Dec. 12, 1992 Indonesia 7.8 Dec. 9, Full South Jun. 2, 1994 Java (South) 7.8 Jun. 1, 3rd South June 9, 1994 Bolivia-North 8.2 Jun. 9, New South
Oct. 4, 1994 Kuril Is 8.2 Oct. 5, New North
July 30, 1995 Chile coast 8 Jul. 27, New South Oct. 9, 1995 Jalisco, Mx 7.9 Oct. 8, Full North
Jan. 1, 1996 Minahasa Pen 7.9 Dec. 28, 1st Q South
Feb. 17, 1996 Indonesia 8.1 Feb. 18, New South
Dec. 12, 1997 Russia 7.8 Dec. 14, Full North
Table 8. Showing the major events M ≥ 7.8 occurred worldwide for the SC23. Here the major events at the Northern Hemisphere happen during the minimum of the cycle, or 2003-2007.
Data Location Mag Moon phases Hemisphere
Dec. 5, 1997 Kamchatka 7.8 Dec. 7, 1st Q South Mar. 25, 1998 Balleny Is 8.1 Mar. 28, New North June 18, 2000 Indian ocean 7.9 Jun. 16, Full South
Nov. 16, 2000 Papua 8 Nov. 18, 3rd Q South
Nov. 16, 2000 Papua 7.8 Nov. 18, 3rd Q South
Nov. 17, 2000 Papua 7.8 Nov. 18, 3rd Q North
June 23, 2001 Peru 8.4 June 21, New South
Nov. 14, 2001 China 7.8 Nov. 15, New North
3 Nov., 2002 Alaska 7.9 Nov. 4, New North
25 Sep., 2003 Japan 8.2 Sep. 21, Full North
17 Nov., 2003 Alaska 7.8 Nov. 20, Full North
23 Dec., 2004 Macq. Is 8.1 Dec. 23, New South
26 Dec., 2004 Sumatra 9.1 Dec. 23, New North
28 Mar., 2005 Indonesia 8.6 Mar. 25, Full North
13 June, 2005 Chile 7.8 June 15, 1st Q South
3 May, 2006 Tonga 8 May 5, 1st Q South
[image:27.595.209.538.386.726.2]DOI: 10.4236/ojer.2019.84016 294 Open Journal of Earthquake Research Continued
1 Apr., 2007 Solomon Is 8.1 Apr. 12, Full South
15 Aug., 2007 Peru 8 Aug. 12, New South
12 Sep., 2007 Indonesia 8.4 Sep. 11, New South 12 Sep., 2007 Indonesia 7.9 Sep. 11, New South
[image:28.595.196.536.206.740.2]12 May, 2008 China 7.9 May 12, 1st Q North
Table 9. Displaying the data for earthquakes M ≥ 7.8 during the SC24.
Data Location Mag Moon phase Hemisphere
July 15, 2009 New Zealand 7.8 Jul. 15, 1st Q South Sep. 29, 2009 Samoa Is 8.1 Sep. 26, 1st Q South Oct. 7, 2009 StaCruz Is 7.8 Oct. 4, Full South
Feb. 27, 2010 Chile 8.8 Feb. 28, Full South
Apr 6, 2010 Indonesia 7.8 Apr. 6, 3rd Q South
Oct. 25, 2010 Indonesia 7.8 Oct. 23, Full South
Mar. 3, 2011 Japan 9.1 Mar. 4, New North
Mar. 11, 2011 Japan 7.9 Mar. 12, 1st Q North
Apr. 11, 2012 Sumatra 8.6 Apr. 13, 3rd Q South April 11, 2012 Sumatra 8.2 Apr. 13, 3rd Q South
Oct. 28, 2012 Canada 7.8 Oct. 29, Full North
Feb. 6, 2013 Solomon Is 8 Feb. 3, 3rd Q South
May 24, 2013 Sea of Okhotsk 8.3 May 25, Full North
Apr. 1, 2014 Chile 8.2 Mar. 30, New South
Jun. 23, 2014 Alaska 7.9 Jun. 27, New North
Apr. 25, 2015 Nepal 7.8 Apr. 25, 1st Q North
May 30, 2015 Japan 7.8 Jun. 2, Full North
Sep. 16, 2015 Chile 8.3 Sep. 13, New South
Mar. 2, 2016 Indonesia 7.8 Mar. 1, 3rd Q South
Apr. 16, 2016 Ecuador 7.8 Apr. 14, 1st Q South
Nov. 13, 2016 N. Zealand 7.8 Nov. 14, Full South
Dec. 8, 2016 Solomon Is 7.8 Dec. 7, 1st Q South
Dec. 17, 2016 Papua 7.9 Dec. 14, Full South
Jan. 22, 2017 Papua 7.9 Jan. 19, 3rd Q South
Sep. 6, Full Mexico 8.2 Sep. 6, New North
Jan. 23, 2018 Alaska 7.9 Jan. 24, 1st Q North
Aug. 19, 2018 Fiji 8.2 Aug. 18, 1st Q South
DOI: 10.4236/ojer.2019.84016 295 Open Journal of Earthquake Research Tables 6-8, for SC22, SC23 and SC24 results, resumed in Figure 11. Figure 11 represents the three tables, (Tables 7-9) for the biggest earthquakes world-wide M >or equal 7.8. Observe Tables 7-9 are the biggest earthquakes worldwide for each cycle we searched. Analyzing the three cycles by Hemisphere and Moon Phases, for the largest earthquakes, the results are the following; the biggest oc-currences are in the Northern Hemisphere for SC22 (57%), to SC23 was at the Southern Hemisphere (53%) and for SC24 at the Southern Hemisphere (65%). It pointed out the earthquakes likely to happen more at the Southern hemisphere with a small discrepancy on the SC22. The same analysis for the Moon phase for the largest events showing a growth of events in conjunction with a New Moon. The New Moon appears in 57% (SC22), 59% in (SC23) and 78% (SC24%). Con-sidering the entire period 1986-2018, for earthquakes M ≥ 7.8 we obtained to the Moon phases is 31% for New Moon and 27% for Full moon. The Southern He-misphere has 60% of occurrences for earthquakes with the highest magnitudes for the period 1986-2018.
DOI: 10.4236/ojer.2019.84016 296 Open Journal of Earthquake Research
4. Results Discussion
The first part of this paper calculated an oscillatory force between Moon-Earth that is created with the variation of the Perigee position twice or three times by month. Our results find an oscillatory tidal force varying during the last three Solar Cycless. Those cycles were defined within the period 1986-2019, one Solar Cycles is defined in periods of 10 - 11 years. The gravitational force Moon-Earth is an oscillation that has maximum and minima when the distance between the two bodies is at the perigee or the minima. Our next step was to associate the evolution of these oscillations and the largest earthquakes happened into the pe-riod 1986-2018.
The Moon phases are cyclical as well, and each month there is the occurrence of Full, first quarter, third quarter and New Moon. The rotational movement of the Moon around the Earth is stable, systematically along the months, and the variation for the perigee is small. Our results pointed out that gravitational force Moon-Earth has small growths during some periods and decreases if the dis-tance between the two bodies increases. The disruption of the external parame-ters happens during Solar Storms, Coronal Mass Ejection or a geomagnetic storm towards the day magnetosphere, when the Solar wind speed sudden in-creases.
If the solar wind is strong enough or if the magnetic field inside the wind cancels the magnetic field of the Earth, some plasma can get through. Strong bursts of solar wind can squeeze the Earth’s magnetosphere compressing until it bounces back like a vibrating rubber ball. Those abrupt external variations would disturb the earthquakes occurrence, as explained in [1]. The explanation for our results that the largest earthquakes happened during the New Moon at the Southern Hemisphere, is that at the New Moon the gravitational forces Sun-Moon are aligned with the Earth increasing the effects of both bodies. At the Southern Hemisphere is the location with the majority of the subduction zones easily influenced by the tidal forces from the Sun-Moon during this pe-riod.
The occurrences of earthquakes are always higher at the Southern Hemis-phere, particularly in the last cycle SC 24 the proportionality was 66% of events were at the Southern. Examining the next search about the causality of New or Full Moon occurrence for larger earthquakes M ≥ 7.5 it is found that for all cycles, the incidence of events on the New moon is above 50% in relation to Full Moon.
A last remark is about the influence of the Sun on Earth that remains into the electromagnetic force interactions between the two bodies rather than gravita-tional ones.
5. Conclusion
DOI: 10.4236/ojer.2019.84016 297 Open Journal of Earthquake Research to be dependent in the area searched. It is contingent on the tectonics, fabric, and zones involved in the study. The locations more susceptible to the Moon-Earth relations are in the Southern Hemisphere. The presence of the subduction is important, and most are located in the Northern or Southern Pa-cific. However, there is a very deep subduction location at the Southern Pacific, as in Fiji with 700 km depth. Finally, the influence of external variables, such as Sun-Earth, Moon-Earth or Sun-Moon-Earth is subtle and is dependent from the location where the event happened. A next study could be developed to under-stand the importance of Moon gravitational forces for earthquakes with smaller magnitudes as M ≥ 5 or for shallow earthquakes.
Conflicts of Interest
The authors declare no conflicts of interest regarding the publication of this paper.
References
[1] Tavares, M. and Azevedo, A. (2011) Influences of Solar Cycles on Earthquakes.
Natural Science, 3, 436-443.
[2] Hagen, M. and Azevedo, A. (2016) Gravitational Moon-Earth Forces Triggering Earthquakes in Subduction Zones. Journal of Geography, Environment and Earth Science International, 8, 1-14.https://doi.org/10.9734/JGEESI/2016/29227
[3] Hagen, M. and Azevedo, A. (2017) Sun-Moon-Earth Interactions, External Factors for Earthquakes. Natural Science, 9, 162-180.
[4] NGDC/NOAA. http://www.ngdc.noaa.gov/hazard [5] https://spaceplace.nasa.gov/solar-cycles/en
[6] Perigee/Apogee. https://www.fourmilab.ch/earthview/pacalc.html [7] http://astropixels.com/ephemeris/phasescat/phasescat.html
[8] http://www.usgs.gov/earthquakes
[9] http://www.iris.edu/
[10] https://www.emsc-csem.org/Earthquake/?filter=yes
[11] Wayne, L., Hamilton, W.L., Lammlein, D., Dorman, J. and Latham, G. (4040) Tidal Triggering of Moonquakes. Science, 176, 1258-1259.
https://doi.org/10.1126/science.176.4040.1258
[12] Marilia, H. and Azevedo, A. (2017) Possible Connections between X-Solar Flares and Worldwide Variation in Seismicity Enhancement. Natural Science, 9, 457-476.
https://doi.org/10.4236/ns.2017.912042
[13] Solar Physics and Terrestrial Effects. Chapter 4, 29-38.
http://www.swpc.noaa.gov/sites/default/files/images/u33/Chapter_4.pdf
[14] Block, L.P. and Falthammar, C.-G. (1968) Effect of Field-Aligned Currents on the Structure of Ionosphere (Magnetic Field-Aligned Electric—Currents Effects on Io-nospheric Structure, Noting Electron Concentration Variations and Plasma Diffu-sion). Journal of Geophysical Research, 73, 4807-4812.
https://doi.org/10.1029/JA073i015p04807
DOI: 10.4236/ojer.2019.84016 298 Open Journal of Earthquake Research Journal of Geophysical Research, 78, 6802-6807.
https://doi.org/10.1029/JA078i028p06802
[16] Potemra, T.A. (1988) Birkeland Currents in the Earth’s Magnetosphere. Astrophys-ical and Space Science, 144, 155-169.https://doi.org/10.1007/978-94-009-3021-6_12 [17] Kvale, E.P (2006) The Origin of Neap-Spring Tidal Cycles. Marine Geology, 235,
5-18.https://doi.org/10.1016/j.margeo.2006.10.001
[18] Ross, D.A. (1995) Introduction to Oceanography. Harper Collins, New York, 236-242.