Does a peer-model’s task proficiency influence children’s solution choice and innovation? 1
2
Lara A. Wood1, Rachel L. Kendal2 and Emma G. Flynn3 3
4 5
1Centre for Coevolution of Biology & Culture, Department of Psychology, Durham 6
University, Durham, DH1 3LE, UK. 7
E-mail: [email protected] (corresponding author) 8
2Centre for Coevolution of Biology & Culture, Department of Anthropology, Durham 9
University, Durham, DH1 3LE, UK. 10
3Centre for Coevolution of Biology & Culture, School of Education, Durham University, 11
Durham, DH1 1TA, UK. 12
13 14
Acknowledgements 15
This work was supported by a Durham Doctoral Fellowship to LAW . We would like to 16
thank the children and schools who participated in the study, Andrew Long for assistance 17
with the design and manufacture of the task, Sarah Bedford for assistance with data collection 18
and inter-rater coding and Cameron Turner for inter-rater coding. 19
Abstract 21
The current study investigated whether four- to six-year-old children’s task solution choice 22
was influenced by the past-proficiency of familiar peer models and the child’s personal prior 23
task experience. Peer past-proficiency was established through behavioural assessments of 24
interactions with novel tasks alongside peer and teacher predictions of each child’s 25
proficiency. Based on these assessments, one peer model with high past-proficiency and one 26
age-, sex-, dominance-, and popularity-matched peer model with lower past-proficiency were 27
trained to remove a capsule using alternative solutions from a three-solution artificial-fruit 28
task. Video demonstrations of the models were shown to children after they had either a 29
personal successful interaction or no interaction with the task. Generally, there was not a 30
strong bias towards the high past-proficiency model, perhaps due to a motivation to acquire 31
multiple methods and the salience of other transmission biases. However, there was some 32
evidence of a model-based past-proficiency bias; when the high past-proficiency peer 33
matched the participant’s original solution there was increased use of that solution whereas if 34
the high past-proficiency peer demonstrated an alternative solution, participants showed 35
increased use of the alternative social solution and novel solutions. Thus, model proficiency 36
Does a peer-model’s task proficiency influence children’s solution choice and innovation? 38
39
Laboratory experiments with unfamiliar models enable a controlled investigation of 40
children’s social learning strategies, influencing the circumstances under which they copy. 41
However, it is hugely beneficial to look at children’s behaviour ‘in the wild’ (Flynn & 42
Whiten, 2010) implementing a controlled design in a naturalistic setting, such as with 43
familiar peers in a child’s classroom or nursery group (Dean, Kendal, Schapiro, Thierry, & 44
Laland, 2012; Flynn & Whiten, 2012). Such paradigms may also identify moments of 45
innovation, whereby children find solutions that have not been socially demonstrated. The 46
current study implemented an experimental procedure designed to mirror a naturalistic 47
context to better understand children’s solution choice and innovation relative to (a) the past-48
proficiency of a known peer model and (b) their personal experience with a task. 49
50
Model Past-Proficiency 51
When faced with divergent novel information from numerous individuals it is 52
adaptive to have a strategy as to whom to copy (Laland, 2004; Rendell et al., 2011). Children 53
demonstrate such model-based biases in their learning (reviewed by Wood, Flynn & Kendal, 54
2013b). For example, from infancy to six-years, children consistently copy reliable, over 55
unreliable, models for linguistic labelling (Koenig, Clément, & Harris, 2004; Koenig & 56
Harris, 2005; Vázquez, Delisle, & Saylor, 2012) and artefact use (Birch, et al., 2008; Zmyj, 57
Buttelmann, Carpenter, & Daum, 2010). Copying a proficient, successful model should 58
increase the chances of personal success. In the current study we use the term past-59
proficiency to refer to a model’s domain-specific ability exhibited in the past. As such we 60
focus on the potential for a model to have a reputation for being skilled within the domain 61
an observer’s solution choice. We used a novel artefacts to establish proficiency reputations 63
so proficiency referred to successful interaction with novel artefacts. The child models either 64
scored high in past-proficiency (hitherto ‘High PPM’) or lower in past-proficiency (hitherto 65
‘Low PPM’) pertaining to the relative degree of exploration or, where appropriate, successful 66
extraction of capsules containing stickers from the series of novel artefacts. 67
The strength of the current study was the use of familiar peer models, enabling an 68
investigation of children’s responses to peers based on their actual abilities rather than staged 69
manipulations from two novel actors. However, this paradigm presents challenges. First, 70
peers will differ in past-proficiency and in other characteristics such as age, sex, popularity 71
and dominance and these characteristics could also bias children’s solution choice. For 72
example, seven- and eight-year-olds copy the food choices of older rather than younger 73
children at the same school (Brody & Stoneman, 1981) and three-year-olds copy the 74
preferences of same-sex (over different-sex) unfamiliar child models for choices of novel 75
food, clothes, toys and games (Frazier, Gelman, Kaciroti, Russell, & Lumeng, 2011; Shutts, 76
Banaji, & Spelke, 2010). These characteristics may also co-vary with proficiency; with an 77
open-diffusion artificial-fruits task, older, more dominant familiar children were watched 78
more and had more successes than younger, less dominant children (Flynn & Whiten, 2012). 79
The second related issue is that young children may struggle to differentiate the subtle 80
differences in their peers’ proficiency. For example, whilst Zmyj et al. (2010) differentiated 81
proficiency through a model placing a shoe on his foot or his hand, the current study asked 82
children to imagine who might be better at a task. If this is challenging, children might select 83
peers based on more salient characteristics such as age and sex. To try and evaluate and 84
minimise these challenges age, sex, popularity and dominance measures of the children were 85
taken and analysed in conjunction with peer ratings. Additionally, for the test phase, models 86
88
Prior Experience 89
Personal prior experience can influence whether a model will be copied; naïve (no 90
prior experience with the task) children that are presented with demonstrations of the same 91
solution faithfully copy this solution, including the copying of causally irrelevant actions, 92
even when other solutions are available, (Bonawitz, Shafto, Gweon, Goodman, Spelke & 93
Schulz, 2011; Flynn & Whiten, 2008; Hopper, Flynn, Wood, & Whiten, 2010; Horner & 94
Whiten, 2005; Horner, Whiten, Flynn, & de Waal, 2006; McGuigan, Whiten, Flynn & 95
Horner, 2007). However, children who interact with a task before witnessing social 96
demonstrations omit subsequently socially-demonstrated causally irrelevant actions, use 97
multiple solutions and explore and innovate new solutions (Wood, Kendal & Flynn, 2013a). 98
Innovation is defined as producing behaviour that has not been socially observed, like 99
a novel solution, although this does not mean that social information has not contributed to 100
the novel solution (XXX, under revision). Innovation can lead to multiple solutions that 101
increases one’s overall knowledge of the task, as well as potentially providing generalisable 102
knowledge regarding the properties of each solution. Wood et al. (2013a) investigated 103
solution choice in naïve children given one social demonstration and previously successful 104
children given a matching or an alternative demonstration. The current study extended this by 105
presenting children with two models demonstrating different solutions; either two novel 106
solutions, or one matching and one novel solution. Giving children multiple social 107
alternatives allowed for further exploration of children’s solution choice and innovation. 108
109
Summary 110
The current study investigated solution choice in relation to the proficiency of peer 111
the point of investigation as during this period children develop important cognitive 113
milestones including inhibitory control, false-belief understanding, executive functions along 114
with increased general intelligence, all of which could affect learning in a peer context (Blair 115
& Razza, 2007). For example, a Theory of Mind is associated with increased helping of a 116
novice peer on a novel task (Flynn, 2010). Further, it is at this age that children within the 117
UK start school, and have regular contact with a group of peers, their classmates, thus 118
allowing peer-based social learning strategies to emerge. Testing within a school also allowed 119
for more complex profiling (perceived proficiency, popularity and dominance measures) of 120
the children from the peers and the teachers that had known the children for at least six 121
months. Finally, this focus mirrors and adds to many current studies with this age group. For 122
example, children of this age range have demonstrated high levels of copying causally 123
relevant and irrelevant actions (e.g. McGuigan et al., 2011) which indicates that if no biases 124
exist, imitation levels should be high.. 125
If children were able to identify the more proficienct peers, we predicted that the 126
children who saw two new solutions, presented by a High PPM and Low PPM, would try 127
both demonstrated solutions but would preferentially copy the solution choice of the High 128
PPM. We also predicted that when the High PPM’s solution matched the child’s original 129
solution and the Low PPM offered an alternative solution children would be more likely to 130
continue using their original solution and less likely to use the alternative social method or 131
innovate other ‘unexperienced’ solutions relative to when the Low PPM matched the child’s 132
solution and the High PPM offered an alternative solution. In line with Wood et al. (2013a) 133
we predicted that those children with no prior personal information would copy a socially 134
demonstrated solution. Conversely, previously successful children would flexibly use 135
personally acquired as well as socially demonstrated solutions and would show innovation 136
allows the complexity of the real-world to be mirrored within an experimentally-controlled 138
investigation, rather than an individual, discrete bias analysis which has been seen in much 139
previous research. 140
141
Method 142
Participants 143
One hundred and ten children (59 males), aged four-to-six-years-old (range = 56 to 80 144
months, M = 65.52, SD = 6.00), were recruited from four primary school classes in County 145
Durham, UK. The class sizes were as follows: class A = 23 (12 males), class B = 27 (14), 146
class C = 28 (13), and class D = 32 (20). There were no significant differences in the number 147
of boys or girls (Binomial p > .5). The children had been in their classes for between eight 148
and nine months. Eight children were used as models, five participants were excluded from 149
the analysis due to experimenter error and the experiment was terminated early for three 150
children as they appeared uncomfortable. The remaining 94 children ranged from 57 to 77 151
months (M = 65.53, SD = 5.74). There was no significant difference in the distribution of sex 152
(χ2 (3, N = 82) = 0.33, p = .96) or age (F3, 78 = 0.10, p = .96) across the five conditions. 153
154
Design 155
The experiment had three phases and participants were systematically allocated 156
(approximate matching of age and sex) to one of four conditions. The presence or absence of 157
an interaction with the task in phase one was the first independent variable: twenty children 158
were selected at random to have no interaction in phase one (Condition 1), while the 159
remaining children (N = 74) interacted with the task (all but 12 found a solution). In phase 160
two, all children watched video demonstrations of models using a solution. The second 161
(one or two). In phase three, all children had up to five interactions with the task. All children 163
in Condition 1 one were necessarily assigned to two novel solutions. The other children were 164
systematically assigned to the remaining three conditions (Two novel solutions, High PPM 165
matched and Low PPM demonstrated a novel solution, or Low PPM matched and High PPM 166
demonstrated a novel solution). The dependent variables were attendance to demonstration, 167
solution choice and irrelevant action reproduction. 168
169
Selecting Models 170
In order to ascertain which children were to be models, all children were assessed 171
through group behavioural observations of their interactions with three novel tasks, such that 172
both the experimenter and peers observed recent peer proficiency. Peers and teachers were 173
also asked to rate children’s proficiency on novel tasks (Pellegrini, et al. 2007). Additionally, 174
children and teachers rated peers/pupils dominance and popularity to investigate whether 175
proficiency ratings were confounded by these traits (Flynn & Whiten 2012). Thus model 176
selection was rigorous in triangulating various sources of information regarding individual’s 177
prior-proficiency reputation (see Table 1 and further detail in the supplementary material). 178
The original intention was to select models based on behaviour with the three novel 179
tasks as indicated by ‘Task Interaction Scores’ (TIS), and peer predictions of proficiency. 180
Children’s TIS with the three novel tasks was consistent, demonstrating that children’s novel 181
task proficiency was robust. However, children were not consistent in their ratings of their 182
peers over a short time period. Furthermore, other characteristics influenced model choice; 183
children of the same sex as the rater and children who were more popular received more peer 184
selections for proficiency. The influence of age approached significance with older children 185
being selected more often as proficient. Conversely, teacher ratings of proficiency correlated 186
behavioural performance (TIS), supported by teaching ratings, was prioritised over peer 188
ratings for the choice of models. Models were age, sex, popularity and dominance matched 189
within each class. Details of model selection are summarised in Table 2 (further details in 190
Table 1 Overview of assessments. Teacher rating traits taken from Freeman et al. (2013).
192
Trait Name of assessment Source Method of assessment
Proficiency Proficiency Proficiency
No-Reward Task Easy-Reward Task Hard-Reward Task
Experimenter Ratings: Interactions during 15-20 mins of free play with novel
tasks
Behavioural assessment of interaction with 3 tasks, including order (relative to the other children) of first proximity (within 1m and oriented towards the task), interaction (placing their hands on part of the task) and success (removing stickers from the task in the reward tasks) as well as frequencies of proximity, interaction and success using one-zero sampling in 40 30second intervals and number of
different types of interactions with the task. This resulted in a Task Interaction Score (TIS)
Proficiency Proficiency Peers: Asked to pick up to five classmates from photographs
Asked, ‘Which five children would be really good at getting the sticker out of this box?’ Popularity Popularity Asked, ‘If you could take five children to a party, who would you take?’
Dominance Dominance Asked, ‘Are there any children who like to tell other children what to do?’
Proficiency Proficiency Proficiency
Proficiency Proficiency Proficiency
Teachers: Asked to place photographs of
children into one of five groups (Likert scale) for each of the
six adjectives
Inquisitive: Likely to explore this task
Intelligent: Quick and accurate in judging and comprehending this task Inventive: Likely to engage in an inventive behaviour with this task
Friends with a significant number of others/a smaller number of more influential individuals
Often initiates conflicts with other children and dominates resources
Able to acquire and monopolise resources over other individuals Popularity Popularity
Dominance Aggressive
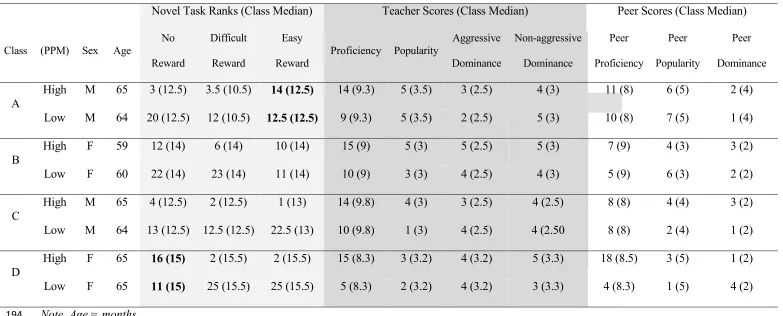
Table 2: Overview of the eight models, two selected from each class
193
Novel Task Ranks (Class Median) Teacher Scores (Class Median) Peer Scores (Class Median)
Class (PPM) Sex Age
No
Reward
Difficult
Reward
Easy
Reward
Proficiency Popularity
Aggressive
Dominance
Non-aggressive
Dominance
Peer
Proficiency
Peer
Popularity
Peer
Dominance
A
High M 65 3 (12.5) 3.5 (10.5) 14 (12.5) 14 (9.3) 5 (3.5) 3 (2.5) 4 (3) 11 (8) 6 (5) 2 (4) Low M 64 20 (12.5) 12 (10.5) 12.5 (12.5) 9 (9.3) 5 (3.5) 2 (2.5) 5 (3) 10 (8) 7 (5) 1 (4)
B
High F 59 12 (14) 6 (14) 10 (14) 15 (9) 5 (3) 5 (2.5) 5 (3) 7 (9) 4 (3) 3 (2)
Low F 60 22 (14) 23 (14) 11 (14) 10 (9) 3 (3) 4 (2.5) 4 (3) 5 (9) 6 (3) 2 (2)
C
High M 65 4 (12.5) 2 (12.5) 1 (13) 14 (9.8) 4 (3) 3 (2.5) 4 (2.5) 8 (8) 4 (4) 3 (2) Low M 64 13 (12.5) 12.5 (12.5) 22.5 (13) 10 (9.8) 1 (3) 4 (2.5) 4 (2.50 8 (8) 2 (4) 1 (2)
D
High F 65 16 (15) 2 (15.5) 2 (15.5) 15 (8.3) 3 (3.2) 4 (3.2) 5 (3.3) 18 (8.5) 3 (5) 1 (2) Low F 65 11 (15) 25 (15.5) 25 (15.5) 5 (8.3) 2 (3.2) 4 (3.2) 3 (3.3) 4 (8.3) 1 (5) 4 (2)
Note. Age = months.
194
Three tasks (No-Reward, Difficult-Reward, Easy-Reward) = sum of ranks for Task Success with lower scores corresponding better proficiency
195
Teacher scores = sum (out of 15) of the Mdn score across teachers; Peer proficiency, Popularity and Dominance
196
Peer scores = sum of nominations by other children; Text in bold indicates unavoidable anomalies to expected rankings
Apparatus 198
The Sweep-Drawer-Lever Box (SDLB, see Figure 1) is a puzzle box containing a 199
reward held in place by a series of defences. The SDLB is transparent with an opening at the 200
top where a capsule containing a sticker can be inserted. The capsule falls to an opaque green 201
mid-level platform where one of three spatially separated, and functionally unique, 202
manipulandi can be used to push the capsule from the mid-level to a lower level. These three 203
manipulandi are, (1) a silver sweeper with a red handle that moves the capsule to a hole 204
through which the capsule falls, (2) a silver lever used to push the capsule to a hole causing it 205
to fall, and (3) a blue drawer upon which the capsules sits and by pulling the drawer handle, a 206
gap is produced through which the capsule falls. These solutions can also be used in 207
combination and therefore there are seven possible solutions: Sweep, Drawer, Lever, Sweep-208
Drawer, Drawer-Lever, Lever-Sweep and Drawer-Sweep-Lever, the latter four of these are 209
termed ‘combination-solutions’. On the lower level the capsule rests behind a black door 210
which can be slid to the side to remove it. 211
[image:12.595.38.515.239.711.2]212
Figure 1. The Sweep-Drawer-Lever Box front view (panel A) and top view (B). Model using
213
the sweep (C), lever (D) drawer (E).
Video Demonstrations 215
The model demonstrations were presented on two laptops, positioned on a table 216
approximately 30cm apart. Children were initially shown consecutive three-second introductory 217
clips of the models, one model on each laptop, smiling and waving. To aid the child’s recall of 218
which model would be shown on which laptop, at the top of each laptop was a photograph (3cm 219
x 5cm) of the corresponding model. Participants were asked to identify each of the models by 220
name. Whether the High PPM or Low PPM model was presented on the left or right and the 221
presentation order of the introductory clips were counterbalanced. The High PPM and Low 222
PPM were individually trained to remove the capsule from the SDLB using the three 223
alternative solutions with each included a sequence of causally irrelevant actions. Once each 224
child was proficient s/he was video recorded completing each of the three sequences of actions 225
ending with the successful extraction of the capsule. 226
The 15 second clip showed the model looking from the camera to the task, then 227
operating one of the three manipulandi to cause the capsule to fall and then moving this same 228
manipulandi back and forth a further five times (irrelevant actions) before opening the door 229
and retrieving the capsule. For example, if they demonstrated the drawer solution they pulled 230
the drawer out to release the capsule then pushed the drawer (1) in, (2) out, (3) in, (4) out and, 231
(5) in. The model retrieved the capsule from the door and held it up to the camera. Related 232
research has shown a primacy effect such that children preferentially copied the 233
demonstration they saw first (YYY, in prep). Thus the clips were shown simultaneously rather 234
than subsequently so that the participant, not random allocation, dictated who the participant 235
watched first. The clips were shown twice so that, in theory, the child could follow both 236
demonstrations in turn from beginning to end. A video camera was placed 60cm in front of the 237
participant between the two screens. Children’s head and eye movements were recorded and 238
240
Procedure 241
Children were tested individually in a quiet place in their school. In phase 1 children 242
were given either a chance to interact with the SDLB or were given no information. Children 243
given no information (condition 1 ‘Naïve’) moved straight into phase 2. All other children 244
were assigned to the conditions involving an initial interaction with the SDLB. These 245
children were given three minutes to interact with the task and remove the capsule before 246
moving to phase 2. Children in conditions 1 (‘Naïve’) and 2 (‘Successful’) were presented 247
with novel social information from both models but differed in their prior personal 248
experience. The remaining successful children were given one of two demonstration 249
combinations: a demonstration of the same solution as the child had previously-used 250
presented by the High PPM and an alternative solution by the Low PPM (condition 3 ‘High 251
PPM match’) or a demonstration of the same solution as the child had previously-used by the 252
Low PPM and an alternative solution by the High PPM (condition 4 ‘Low PPM Match’). A 253
summary of all conditions can be found in Table 3. The solution (sweep, lever, drawer) and 254
model type used was counterbalanced across all trials. In phase 3 all children were told, “It’s 255
your turn (again).” The child was allowed to interact with the SDLB until s/he retrieved the 256
capsule successfully or three minutes had elapsed. If children were successful they were told, 257
“It’s your turn again,” until they had completed six trials. At the end of testing all children 258
were told they had done very well and were rewarded with stickers, irrespective of their level 259
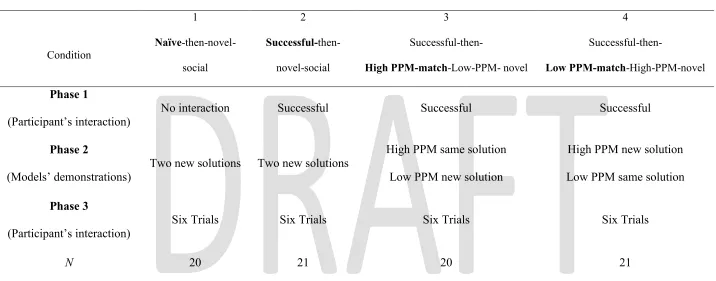
Table 3: Overview of the procedure (three phases) in the five conditions
261
1 2 3 4
Condition
Naïve
-then-novel-social
Successful-then-
novel-social
Successful-then-
High PPM-match-Low-PPM- novel
Successful-then-
Low PPM-match-High-PPM-novel
Phase 1
(Participant’s interaction) No interaction Successful Successful Successful
Phase 2
(Models’ demonstrations) Two new solutions Two new solutions
High PPM same solution Low PPM new solution
High PPM new solution Low PPM same solution
Phase 3
(Participant’s interaction)
Six Trials Six Trials Six Trials Six Trials
N 20 21 20 21
Note: Words in bold font represent abbreviated terms, used in the text, for condition names.
Coding, Inter-Rater Reliability and Analysis 263
Each participant’s performance was scored with regard to eye orientation towards 264
each laptop screen during video demonstrations and three separate variables for each 265
response trial: (a) success (capsule removal), (b) solution used, (c) number of causally 266
irrelevant actions copied (out of five). LW coded 100% of the sample from video tape. An 267
independent observer coded 25% of the sample for 22 variables (the three variables listed 268
above for each of six trials and four variables relating to eye orientation). There was almost 269
perfect agreement (Viera & Garrett, 2005) on 21 of the 22 variables (Kappa scores above .86 270
(p <.01). The remaining variable (the number of causally irrelevant actions on the final trial) 271
had a Kappa score of .64. A second independent observer coded 100% of this variable with a 272
Kappa score of .86 (p < .01). All statistical tests were non-parametric and two-tailed. 273
274
Results 275
In phase 1, 62 (84%) of the 74 children who were given a chance to interact with the 276
task were successful. One child used a combination of the Sweep and the Lever action during 277
his success. The other 61 children used a single solution: 19 Drawer, 12 Sweep and 30 Lever. 278
The higher incidence of using the Lever was significant (χ2(2, N = 61) = 7.71, p < .05). For 279
all subsequent analyses Kruskal-Wallis tests were used to investigate whether the asocial 280
preference for the lever impacted upon results. At no point did the salience of the lever have a 281
significant impact upon the children’s subsequent behaviour (all p values > .05). Twelve 282
children were unsuccessful in Phase 1 and so were removed from further analysis. 283
Children’s Attendance to the Demonstrations 285
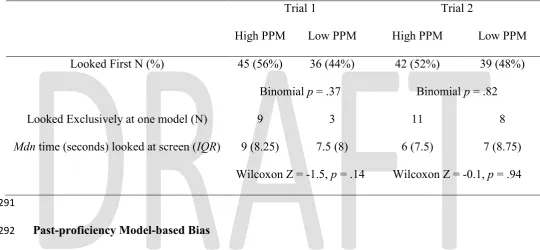
Table 4 gives an overview of looking behaviour and times across the two trials for 286
both models. The majority of children alternated their attendance between the two screens 287
during each demonstration (head direction changes between laptops, M = 4.6, SD = 2.4). 288
[image:17.595.39.580.237.487.2]289
Table 4: Overview of looking behaviour during demonstrations
290
Trial 1 Trial 2
High PPM Low PPM High PPM Low PPM
Looked First N (%) 45 (56%) 36 (44%) 42 (52%) 39 (48%)
Binomial p = .37 Binomial p = .82
Looked Exclusively at one model (N) 9 3 11 8
Mdn time (seconds) looked at screen (IQR) 9 (8.25) 7.5 (8) 6 (7.5) 7 (8.75) Wilcoxon Z = -1.5, p = .14 Wilcoxon Z = -0.1, p = .94
291
Past-proficiency Model-based Bias 292
Across all conditions there was no significant difference in the number of children 293
who used the High PPM solution (N = 36) and children who used the Low PPM solution (N = 294
31, Binomial, p = .63). A further 13 children used an alternative solution and two children 295
were unsuccessful. Which models’ solution (High PPM or Low PPM) was used in the 296
children’s first response trial was entered as the dependent variable into a stepwise binary 297
logistic regression with the fixed factors of (a) which model was attended to first (High or 298
Low PPM), (b) the cumulative duration of attendance to each model in both demonstrations, 299
(c) age and (d) sex of participant. The only significant predictor of which model was copied 300
was which model was attended to first (β= -1.14, p < .05). Across all conditions the model 301
[image:17.595.36.568.239.743.2]Across all six trials there was no significant difference in the number of times the 303
High PPM solution (Mdn = 2.0, IQR = 3.3) or Low PPM solution was used (Mdn = 2.0, IQR
304
= 3.0, Wilcoxon Z = -0.02, p = .98). The number of times a High PPMs solution was used in 305
T1 to T6 was entered as a dependent variable in a Stepwise Linear regression model along 306
with the same four factors. Again, the only significant predictor of High PPM solution use 307
was which model was attended to first (β= 1.08, p < .05) with those children that looked at 308
the High PPM model first using the High PPM solution significantly more than those that 309
looked at the Low PPM first. 310
Conditions where both solutions were novel. There was no significant difference in 311
whether the High or Low PPM’s solution was used in the first trial for children in the Naïve 312
condition (High = 7, Low = 11, p = .48, Binomial) or Successful condition (High = 8, Low = 313
7, p > .99, Binomial). There was no significant difference in the number of times the children 314
use the High and the Low PPM’s solution across all six trials for children in the Naïve 315
condition (High; Mdn = 1.0, IQR = 2.8, Low: Mdn = 3.0, IQR = 5.0, Wilcoxon Z = -1.48, p = 316
.14) or Successful condition (High; Mdn = 1.0, IQR = 2.0, Low: Mdn = 2.0, IQR = 3.0, 317
Wilcoxon Z = -1.07, p = .28,). 318
Conditions where one model matched the child’s personally-acquired solution. 319
Twenty children witnessed the Low PPM match their solution choice and a High PPM 320
demonstrate a new solution. In T1 these children were more likely to use a solution different 321
to their originally discovered (and Low PPM matching) solution (N = 15) than use their 322
original solution (N = 5, Binomial, p < .05). Nine of these 15 children used the High PPM 323
solution and six innovated an unexperienced solution. Twenty-one children witnessed the 324
High PPM match their solution and Low PPM demonstrate an alternative. These children 325
use a solution different to their original (N = 9, Binomial, p = .66) with only one of these 327
children innovating an unexperienced solution. 328
The difference between the two conditions in terms of using their own solution 329
approached significance (p = .06, Fisher’s exact two tailed). Across all trials (T1-6), children 330
in the High PPM-same-and-Low PPM-alternate condition continued to use their original 331
solution (Mdn = 5, IQR = 4) more frequently than children in the Low same-High PPM-332
alternate condition (Mdn = 2.00, IQR = 6; Z2= -2.49, p < .05). Not only were children in the 333
Low PPM-same-High PPM-alternate condition more likely to deviate away from their 334
original solution to that demonstrated by the High PPM, but they were significantly more 335
likely to innovate an unexperienced solution than children in the High PPM-same-and-Low 336
PPM-alternate condition (χ2(1, N = 41) = 7.55, p < .01). 337
338
Additional effects of prior experience 339
All 18 children that had no prior task interaction and were successful (condition 1) 340
used a socially-demonstrated solution in T1. Of the 21 children who discovered a solution in 341
condition 2 (where both models subsequently provide novel solutions), 15 (71%) used a 342
socially-demonstrated solution in T1, so they were significantly more likely to use a socially 343
demonstrated than personally-discovered solution (N = 21, p < .001, Binomial test). 344
However, as six (29%) children did not use a socially demonstrated method, children with 345
prior success were significantly less likely to use a socially-demonstrated solution than 346
children with no prior interaction with a task (Fisher’s Exact Test, two tailed, p < .05). Of 347
these six children, two used the solution they had initially discovered and four explored and 348
innovated an unexperienced combination-solution (using the same manipulandum used in 349
their personal success, with two adding the Low PPM’s manipulandum and two the High 350
solutions beyond those experienced at some point. This was not significantly different from 352
the seven of 21 children in the successful condition that discovered multiple solutions 353
(Fisher’s Exact test, two tailed, p = .99) although these groups are not directly comparable as 354
children in the successful condition had less potential solutions to discover. 355
Concerning irrelevant action reproduction, the baseline for the rate of spontaneous 356
irrelevant action production was 19% of children. Across all conditions, after social 357
information containing the demonstration of irrelevant actions, there was no increase in the 358
proportion of children producing an irrelevant action (ps > .05). Irrelevant actions were not 359
investigated further. 360
361
Discussion 362
Past-proficiency Model-based Bias 363
Our prediction that all children would preferentially copy the solution choice of the 364
High PPM over the Low PPM was only partly supported. Children who witnessed two new 365
solutions from differing models did not preferentially copy the solution choice of the High 366
PPM. A null result should be interpreted with caution, especially with a sample size of 20 or 367
21 per condition, although there was still a null result when the solution choice of all 82 368
participants were analysed together. Whilst this null result stands in contrast to other studies 369
where children have shown model-based transmission biases for past-proficiency (Birch et 370
al., 2008; Koenig et al., 2004; Koenig & Harris, 2005; Zmyj et al., 2010), our study had a 371
different methodology;(1)both demonstrations offered a viable solution and (2) the models 372
were familiar peers. In relation to difference (1), we suggest that when children observe two 373
new, equally viable solutions they are motivated to try them, irrespective of the source of that 374
their identity is less important; perhaps also explaining why there was no looking preference 376
for the High PPM. These results reflect the complexity of real-world dynamics. 377
The challenges of using familiar peers had been partly anticipated. Children’s ratings of peer 378
proficiency did not correlate with behaviour towards the novel tasks and popularity, age and 379
sex confounded peer ratings. Whilst it could be argued that a failure of the children to 380
identifying proficient peers at this earlier stage undermined the experimental hypothesis and 381
manipulation of peer- proficiency, we think it was fruitful to persevere with the main 382
experiment. This failure was not that surprising considering previous research demonstrating 383
the salience of other characteristics and co-varying characteristics (e.g. Flynn & Whiten, 384
2012). We factored in the potential for this failure, by taking multiple measures of 385
proficiency, and matched models on age, sex, dominance and popularity. With this matching, 386
children showed a past-proficiency model-based bias under certain conditions, indicating that 387
they have the ability to distinguish between models of varying historical ability and use this 388
to guide their behaviour. Children whose previously-discovered solution was subsequently 389
matched by the High PPM were more likely to continue using this original solution and less 390
likely to use the Low PPM’s alternative solution or to innovate, relative to children for whom 391
the Low PPM matched their prior solution use and the High PPM offered an alternative. 392
Children appear to be evaluating their own solution in relation to alternative solutions and the 393
characteristics of the models influenced this evaluation. We suggest that when the child and 394
High PPM’s solutions match, that solution is established as a ‘good solution’ and fidelity 395
towards this solution continues over time. This fidelity inhibits the innovation of alternative 396
solutions. Conversely, when the child’s previously-discovered solution matched that of the 397
Low PPM but the High PPM provided an alternate solution, the child perceived that his/her 398
solution (and Low PPM’s solution) is only one of many ways to interact with this task and so 399
solutions. Here, investigating the interaction of other model-based biases, such as conformity 401
(see van Leeuwen et al. 2013) would be fruitful, as well as investigating how model-based 402
transmission biases hamper innovation. 403
As children were not consistent in their peer rating the model choice was based on the 404
relatively objective measures of model proficiency, namely their performance on several 405
tasks (visible to peers) and several teacher ratings of proficiency. Whilst the models may 406
have objectively differed on their proficiency, general perceptions of the models (prior to 407
children observing peers behaviour on the novel tasks) varied greatly amongst each child 408
such that a model might be viewed as proficient by some peers but not by others. Future work 409
could consider the role of peer evaluations of proficiency; however, such future work would 410
need to consider that such ratings can be unreliable and children are prone to rating same-sex 411
older children as proficient, irrespective of the child’s proficiency, and thus any resulting bias 412
may be related more to age and sex than proficiency itself. 413
Children’s choice of which demonstration they looked at first was positively 414
correlated to the method used on the first trial. Whilst a bias of ‘copy the model observed 415
first’ might overwrite a proficiency based bias we think this design was imperative for several 416
reasons. First, it was essential that children were shown both models as previous research 417
(e.g. Wood et al., 2012) indicated that a between-subject design, where a child was shown 418
one model or another, can overwrite a model-based bias because any useful social 419
information is better than no information and thus children will copy their one model with 420
high fidelity irrespective of that model’s identity. Second, when a child sees both models, 421
allowing a child to select which model to watch first provides a level of ecological validity, 422
and allows us to assess model-based biases using a new approach, different to the usual 423
sequential demonstrations. In related research (YYY in prep), when the demonstrations were 424
demonstration, which masked the strength of the bias towards a particular model. Whilst the 426
findings in the current study may have demonstrated a primacy bias, it was the child’s choice 427
as to who s/he watched first, and thus who a child chooses to look at first is another measure 428
of a proficiency learning bias rather than a confound to the detection of a proficiency bias. 429
430
Prior Experience 431
Children who discovered a solution and subsequently observed new alternate 432
solutions were motivated to try these new socially-demonstrated solutions, but these children 433
showed less solution canalisation to the socially-demonstrated solutions than naïve children. 434
Indeed, they reverted back to using their original solutions and innovated additional 435
combination-solutions. This finding corresponds to findings from a simpler version of the 436
SDLB (without the lever) where successful personal experience prior to receiving a social 437
demonstration increased solution discovery (Wood et al., 2013a). We suggest that prior 438
personal task success encourages task related self-confidence and this reduces canalisation to 439
social information and encourages innovation. Such a phenomenon has been found in adults 440
whereby participant’s confidence in their own response predicted the likelihood of them 441
using subsequent social information, such as those with higher self-confidence were less 442
likely to adopt social information (Morgan, Rendell, Ehn, Hoppitt &Laland, 2011). 443
Developing skills that are immediately unnecessary, but may assist in a changing 444
environment, is thought to underpin instances of contra-freeloading where children (Singh, & 445
Query, 1960) and other animals (Jensen, 1963) work for ‘earned’ rewards even though 446
identical ‘free’ awards are available (Inglis, Forkman & Lazarus, 1997). Openness to 447
exploration, innovation, and using multiple solutions for a single challenge may partially 448
underpin cumulative culture, which is widely held to be responsible for the success of 449
451
Causally Irrelevant Actions 452
Generally, children did not imitate the causally irrelevant actions, contrasting with a 453
number of studies showing that children around this age do so (Horner & Whiten, 2005; 454
Lyons, Young, & Keil, 2007; McGuigan et al., 2007). Previous research has shown minimal 455
copying of casually irrelevant actions when the model is a child (Wood et al., 2012) and 456
when the demonstrations were via video rather than live (McGuigan et al., 2007). Viewing 457
two demonstrations simultaneously may have increased cognitive load and thus decreased the 458
precise copying of a model’s solution, although children were able to attend to and copy the 459
relevant solutions. This selective imitation of solution but not causally irrelevant actions 460
could imply that children understand what is causally relevant and what is not and, when a 461
copying context is difficult, parse out non-functional, aspects. 462
463
Conclusion 464
Model solution matching and successful prior experience and influenced children’s 465
solution choice and innovation, demonstrating the complex nature of children’s social 466
learning strategies. Whilst differences were found in solution choice relative to peer past-467
proficiency, other model-based biases that occur amongst familiar peers may ‘overshadow’ a 468
past-proficiency bias. Investigating the relative weightings of different biases is, thus, an 469
important avenue of future research. Biases may encourage or inhibit the innovation of new 470
solutions depending on how they correspond with the child’s personal information. In sum, 471
understanding of children’s social learning benefits from an approach that emphasises the 472
dynamic setting in which it naturally occurs, enabling consideration of personal experience, 473
References 475
Birch, S. A. J., Vauthier, S. A., & Bloom, P. (2008). Three- and four-year-olds spontaneously 476
use others' past performance to guide their learning. Cognition, 107(3), 1018-1034. 477
Blair, C., & Razza, R. P. (2007). Relating effortful control, executive function, and false 478
belief understanding to emerging math and literacy ability in kindergarten. Child
479
development, 78(2), 647-663. 480
Bonawitz, E., Shafto, P., Gweon, H., Goodman, N. D., Spelke, E., & Schulz, L. (2011). The 481
double-edged sword of pedagogy: Instruction limits spontaneous exploration and 482
discovery. Cognition, 120(3), 322-330. 483
Dean, L. G., Kendal, R. L., Schapiro, S. J., Thierrey, B., & Laland, K. N. (2012). 484
Idenitfication of the social-cognitive capabilities underlying human cumulative 485
culture. Science,335(6072), 1114-1118. 486
Dean, L. G., Vale, G. L., Laland, K. N., Flynn, E., & Kendal, R. L. (2014). Human 487
cumulative culture: a comparative perspective. Biological Reviews, 89(2), 284-301. 488
Flynn, E. (2010). Underpinning collaborative learning. In B. Sokol, U. Muller, J. Carpendale, 489
A. Young, & G. Iarocci (Eds.), Self and social regulation: Social interaction and the 490
development of social understanding and executive functions (pp. 312–336). Oxford, 491
UK: Oxford University Press. 492
Flynn, E., & Whiten, A. (2008). Cultural transmission of tool use in young children: A 493
diffusion chain study. Social Development, 17(3), 699-718. 494
Flynn, E., & Whiten, A. (2010). Studying children’s social learning experimentally “in the 495
wild”. Learning & Behavior, 38(3), 284-296. 496
Flynn, E., & Whiten, A. (2012). Experimental “microcultures” in young children: Identifying 497
biographic, cognitive, and social predictors of information transmission. Child
498
Freeman, H. D., Brosnan, S. F., Hopper, L. M., Lambeth, S. P., Schapiro, S. J., & Gosling, S. 500
D. (2013). Developing a comprehensive and comparative questionnaire for measuring 501
personality in chimpanzees using a simultaneous top‐down/bottom‐up design. 502
American journal of primatology, 75(10), 1042-1053. 503
Hopper, L. M., Flynn, E. G., Wood, L. A., & Whiten, A. (2010). Observational learning of 504
tool use in children: Investigating cultural spread through diffusion chains and 505
learning mechanisms through ghost displays. Journal of experimental child
506
psychology, 106(1), 82-97. 507
Horner, V., & Whiten, A. (2005). Causal knowledge and imitation/emulation switching in 508
chimpanzees (Pan troglodytes) and children (Homo sapiens). Animal Cognition, 8(3), 509
164-181. 510
Horner, V., Whiten, A., Flynn, E., & de Waal, F. B. M. (2006). Faithful replication of 511
foraging techniques along cultural transmission chains by chimpanzees and children. 512
Proceedings of the National Academy of Science, 103, 13878–13883. 513
Inglis, I. R., Forman, B. M., & Lazarus, J. (1997). Free food or earned food? A review and 514
fuzzy model of contrafreeloading. Animal Behaviour, 3, 1171-1191. 515
Jensen, E.D. (1963). Preference for bar pressing over free-loading as a function of number of 516
unrewarded presses Journal of Experimental Psychology, 65, 451-454.
517
Koenig, M. A., Clément, F., & Harris, P. L. (2004). Trust in testimony: Children's use of true 518
and false statements. Psychological Science, 15(10), 694-698. 519
Koenig, M. A., & Harris, P. L. (2005). Preschoolers mistrust ignorant and inaccurate 520
speakers. Child Development, 76(6), 1261-1277. 521
Lyons, D. E., Young, A. G., & Keil, F. C. (2007). The hidden structure of overimitation. 523
Proceedings of the National Academy of Sciences of the United States of America,
524
104(50), 19751-19756. 525
McGuigan, N., Whiten, A., Flynn, E., & Horner, V. (2007). Imitation of causally opaque 526
versus causally transparent tool use by 3-and 5-year-old children. Cognitive
527
Development, 22(3), 353-364. 528
McGuigan, N., Makinson, J., & Whiten, A. (2011). From over‐imitation to super‐copying: 529
Adults imitate causally irrelevant aspects of tool use with higher fidelity than young 530
children. British Journal of Psychology, 102(1), 1-18. 531
Morgan, T. J. H., Rendell, L. E., Ehn, M., Hoppitt, W., & Laland, K. N. (2011). The 532
evolutionary basis of human social learning. Proceedings of the Royal Society B:
533
Biological Sciences,279, 653-662 534
Pellegrini, A. D., Roseth, C. R., Mliner, S., Bohn, C. M., Van Ryzin, M., Vance, N et al. 535
(2007). Social dominance in preschool classrooms. Journal of Comparative
536
Psychology, 121(1), 54-64. 537
Rendell, L., Fogarty, L., Hoppitt, W. J. E., Morgan, T. J. H., Webster, M. M., & Laland, K. 538
N. (2011). Cognitive culture: theoretical and empirical insights into social learning 539
strategies. Trends in Cognitive Sciences, 15(2), 68-76. 540
Singh, D., Query, W. T. (1971). Preference for work over ‘freeloading’ in children. 541
Psychonomic Science, 24(2), 77-79 542
Viera, A.J. and Garrett, J.M. (2005). Understanding inter-observer agreement: The Kappa 543
statistic. Family Medicine, 37(5), 360-363. 544
Wood, L. A., Kendal, R. L., & Flynn, E. G. (2012). Context dependent model-based biases in 545
cultural transmission: Children’s imitation is affected by model age over model 546
Wood, L. A., Kendal, R. L., & Flynn, E. G. (2013a). Copy me or copy you? The effect of 548
prior experience on social learning. Cognition, 127(2), 203-213. 549
Wood, L. A., Kendal, R. L., & Flynn, E. G. (2013b). Whom do children copy? Model-based 550
biases in social learning. Developmental Review, 33(4), 341-356. 551
van Leeuwen, E. J., & Haun, D. (2013). Conformity in nonhuman primates: fad or 552
fact?. Evolution and Human Behavior, 34(1), 1-7. 553
Zmyj, N., Buttelmann, D., Carpenter, M., & Daum, M. M. (2010). The reliability of a model 554
influences 14-month-olds' imitation. Journal of Experimental Child Psychology,
555
106(4), 208-220. 556
XXX (under revision). Eureka!: What is innovation, how does it develop and who does it? 557
Child Development
558
Supplementary Material Detailing Model Selection 560
Method 561
Participants 562
All 110 children took part in some aspect of peer ratings although there were 563
inevitable absences on some days. Ten members of staff across the four classes assisted with 564
the study. They were all female and worked full time with the respective classes either as the 565
class teacher or as a teaching assistant, all are henceforth described as teachers. 566
567
Apparatus 568
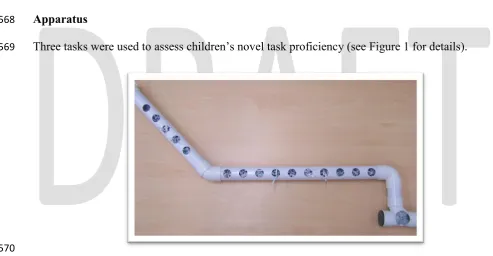
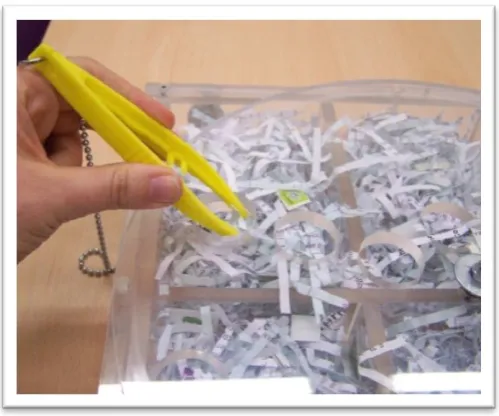
Three tasks were used to assess children’s novel task proficiency (see Figure 1 for details). 569
[image:29.595.39.533.281.537.2]570
Figure 1a. Easy-Reward Task;150cm long white Perspex pipe with a large hole (d = 10cm)
571
at one end and 12 small holes (d = 3cm) along the pipe. The pipe was filled with shredded
572
paper and approximately 100 stickers removable from the holes. This task was designed to be
573
easy with potentially all stickers being accessed in a 20 minute session.
575
Figure 1b.Difficult-Reward Task;25cm x 25cm x 5cm (h x w x d) transparent Perspex box
576
with six compartments containing shredded paper and around 100 stickers. Each
577
compartment had a hole (d = 3cm) at the front. On the front of the box was a circular
578
transparent Perspex disk (d = 25cm) with four holes (d = 3cm). This circular panel could
579
rotate, allowing the panel hole and the compartment hole to line up for access to the stickers.
580
Two plastic tweezers were attached by a 30cm length of flexible wire and could be used to
581
obtain the stickers. This task was designed to be challenging with potentially only a few
582
stickers being accessed in a 20 minute session.
583
584
Figure 1c. No-Reward Task; 100cm long transparent Perspex pipe filled with twelve balls of
585
differing colours, sizes and textures. The pipe had three long slats (l= 10cm, w= 2cm) so that
586
children could touch the balls but the balls could not be removed from the pipe.
Behavioural Proficiency: Assessment and Results 589
At the beginning of testing the children were told that new toys would be available in 590
‘free-play’ and all children could interact with these or they could also choose a different 591
activity. Each novel task was made available to the whole class during these c20min free-play 592
sessions. They were also told that cameras would be recording them, one video camera was 593
placed 2 metres behind the task and another was placed 1 metre to the side of the task. 594
Children’s order (relative to the other children) of first proximity (within 1m and oriented 595
towards the task), interaction (placing their hands on part of the task) and success (removing 596
a sticker from the task in the reward tasks) were recorded. Additionally, the frequencies of 597
proximity, interaction and success were recorded using one-zero sampling, whereby the 598
occurrence or absence of each behaviour was noted within 30second intervals. Scores are 599
expressed as the proportion of the 40 potential 30second intervals that a child was in 600
proximity to, interacting or succeeding with the task. Finally, children were scored for the 601
number of different types of interactions with the task (e.g., for the No-Reward task a child 602
could touch the task, insert finger into slots, move ball with finger, move whole tube, interact 603
with the lid, and interact with the zip-ties attaching the task to a rack) and number of stickers 604
obtained (excluding the No-Reward task). Scores were summarised as a ‘Task Interaction 605
Score’ (TIS). 606
Pearson rank correlations for behaviour with each of the novel tasks demonstrated that 607
each child’s behaviour was similar across the three tasks. No-Reward TIS was positively 608
correlated with Difficult-Reward TIS (r99 = .42, p < .001) and Easy-Reward TIS (r101 = .26, p
609
< .01), which also positively correlated with the Difficult-Reward TIS (r103 = 0.60, p < .001). 610
On occasion, children were absent during the presentation of one of the novel tasks so the 611
TIS for each task was kept separate. The TIS for each task was entered separately as 612
female =1) and age (in months). Sex and age were not significant predictors of the No-614
Reward TIS. For the DifficultReward task age (but not sex) was a significant predictor (β = -615
0.27, t101 = -2.12, p < .05) of TIS with older children receiving better TIS. For the Easy-616
Reward task both age (β = -0.30, t103 = -2.71, p < .01) and sex (β = -6.66, t103 = -4.87, p < 617
.001) were significant predictors of TIS with older children performing better than younger 618
children and females having better TIS. To summarise, children showed behavioural 619
consistency across the three tasks and older children and girls tended to have higher TISs, 620
hence demonstrated greater proficiency, than younger children and boys. 621
622
Peer Ratings: Assessment and Results 623
Individually, children were presented with an artificial fruit used in previous social 624
learning research (the transparent version of the Glass Ceiling Box, see Horner & Whiten, 625
2005). In this task the causally irrelevant actions typically presented with this task were 626
excluded. Children were given a single demonstration of how to retrieve a sticker (by lifting a 627
door, inserting a Velcro topped stick and attaching it to a Velcro sticker) by the experimenter. 628
Children were told it would be their turn after they had answered some questions about their 629
classmates. On a table in front of the participants were photographs of all their classmates, 630
and children were asked three questions; one relating to peer proficiency, “Which five children 631
would be really good at getting the sticker out of this box?” one relating to peer popularity, “If you 632
could take five children to a party with you, who would you take?”, one relating to peer 633
dominance, “Are there any children who like to tell other children what to do?” For the last 634
question children struggled to pick five, therefore the question was adapted so children 635
picked up to five peers. The children were then asked again, “Do you remember that I asked 636
which five children would be really good at getting the sticker out of this box? Can you pick those 637
a short amount of time. For each question, the experimenter noted the identity of the five 639
children and then shuffled the photos and randomly distributed them across the table before 640
the next question was asked. At the end of the questioning children were invited to interact 641
with the GCB and were then given a sticker. This interaction served as a means of rewarding 642
children for their participation. 643
Five children were absent on the day of ratings. Of the 105 children who responded 644
42 (40%) failed to be consistent in their assessment of peer proficiency, that is, they did not 645
choose at least three of the same five children when asked the same question. There was an 646
interaction between sex of peer and sex of participant with boys choosing more boys (M = 647
7.37, SD = 2.14) than girls (M = 4.33, SD = 2.61; t103 = 6.55, p < .001) and girls choosing 648
more girls (M = 5.65, SD = 2.58) than boys (M = 2.72, SD = 2.27; t103 = -6.18, p < .001). 649
Children’s proficiency score (∑peer selections) were entered into a stepwise linear 650
regression in which sex (male = 0 or female =1), age (in months), popularity (∑peer 651
selections) and dominance (∑ peer selections) were entered as predictors. Popularity was the 652
only significant predictor of proficiency rating (β = 1.11, t108 = 6.92, p < .001) with such that 653
children who received more peer selections for party attendance receiving more peer 654
selections for proficiency. Sex (β = -0.15, t108 = -1.85, p = .067) and age (β = 0.14, t(108) = 655
1.74, p = .084) approached significance with males and older children being selected more 656
often as proficient. Dominance was not a significant predictor (β = 0.01, t108 = -0.14, p = .99) 657
of proficiency. To summarise, children were not consistent in their choices of proficiency of 658
their peers and tended to rate proficiency based on the more popular children of the same sex 659
as themselves. 660
661
Teachers were shown the same Glass Ceiling Box as an example of a novel task and, 663
in answer to rating statements, were asked to place photos of the children into one of five 664
groups: 1 (not at all like this child), 2 (not like this child), 3 (neither like nor not like this 665
child), 4 (like this child), and 5 (very like this child). The first statements related to 666
proficiency and required teachers to rank children according to: inquisitive, defined as, Likely 667
to explore this task; intelligent, Quick and accurate in judging and comprehending this task; 668
and inventive, Likely to engage in an inventive behaviour with this task. Teachers were also 669
asked to rank children on popularity (Friends with a significant number of others/a smaller 670
number of more influential individuals), aggressive-dominance (Often initiate conflicts with 671
other children and dominates resources) and unaggressive-dominance (Able to acquire and 672
monopolise resources over other individuals without using aggression). These questions were 673
based on constructs developed by Freeman et al. (2013). The scores of same-class teachers 674
were significantly positively correlated with each other for each trait (Table A) with the 675
exception of some of the ratings from teachers of Class A, possibly due to the smaller size (N 676
= 23) and the inquisitive rating in Class B. As there was good agreement amongst the 677
teachers, children received a mean score for each of the six traits. As the three proficiency 678
adjectives were positively correlated (inquisitive with intelligent; r110 = .44, p < .001, and 679
inventive; r110 = .56, p < .001, inventive with intelligent; r110 = 0.71, p < .001) they were 680
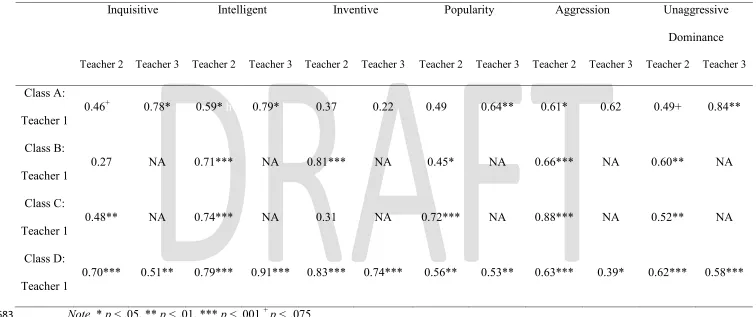
Table A: Correlations for teachers’ rating of children’s traits in each of the four classes
682
Note. * p < .05, ** p < .01, *** p < .001 + p < .075 683
Inquisitive Intelligent Inventive Popularity Aggression Unaggressive
Dominance Teacher 2 Teacher 3 Teacher 2 Teacher 3 Teacher 2 Teacher 3 Teacher 2 Teacher 3 Teacher 2 Teacher 3 Teacher 2 Teacher 3
Class A: Teacher 1
0.46+ h 0.78* 0.59* h 0.79* h 0.37 0.22 0.49 h 0.64** 0.61* 0.62 0.49+ 0.84**
Class B:
Teacher 1 0.27 NA 0.71*** NA 0.81*** NA 0.45* NA 0.66*** NA 0.60** NA
Class C:
Teacher 1 0.48** NA 0.74*** NA 0.31 NA 0.72*** NA 0.88*** NA 0.52** NA
Class D: Teacher 1
Teachers’ mean proficiency ratings were entered as a dependent variable into a 684
stepwise linear regression with the child’s sex (male = 0 or female = 1), age (in months), 685
popularity, and aggressive and unaggressive dominance entered as independent variables. 686
Age (β = 0.59, t107 = 0.89, p = .38) and sex (β = 0.11, t t107 = 1.73, p = .09) were not 687
significant predictors of teacher ratings of proficiency. Teacher ratings of popularity (β = 688
1.22, t107 = .20, p < .001), aggressive (β = -0.91, t(107) = .26, p < .01) and unaggressive 689
dominance (β = 1.48, t 107= .27, p < .001) were all significant predictors of teacher ratings of 690
proficiency, with increased affiliation and unaggressive dominance scores, and decreased 691
aggressive dominance scores, predicting increased proficiency scores. To summarise, it 692
appears that teachers’ proficiency judgements were not influenced by children’s age or sex, 693
but corresponded positively with ratings of popularity and unaggressive dominance. 694
695
Relation between Peer and Teacher Ratings and Behavioural Proficiency 696
The three TIS were entered separately as dependent variables into a stepwise linear 697
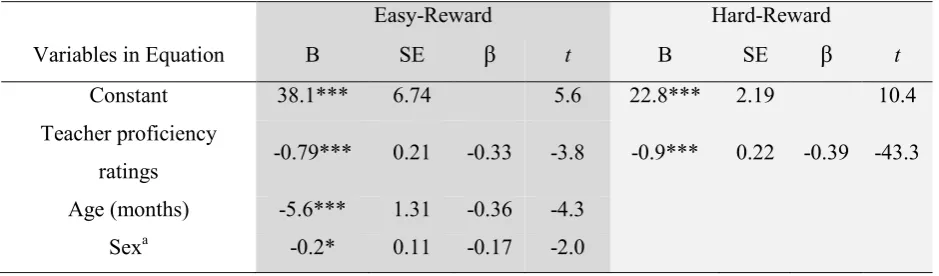
regression with teacher and peer ratings, sex and age, as predictor variables (Table B). For the 698
Easy-Reward task, the model accounting for the most variance (31.7%) of TIS included 699
teacher’s proficiency ratings, sex and age; children with higher teacher’s proficiency ratings, 700
girls and older children had greater TIS than those with lower proficiency ratings, boys and 701
younger children respectively. For the Difficult-Reward task, teacher proficiency ratings was 702
the only variable in the best model which accounted for 14.7% of the variance of TIS; 703
children with higher proficiency ratings from teachers had greater TIS than those with lower 704
proficiency ratings. For the No-Reward task, the best model could only account for 6.4% of 705
the variance and showed a peculiar pattern. Greater TIS was predicted by increased ratings of 706
Table B: Linear Regression (Stepwise) predicting Task Success on two reward novel tasks
a Dichotomous variable Male = 0, Female =1; * p < .05, *** p < .001 (two tailed).
Model Selection
Children were ranked relative to their TIS and teacher proficiency scores. The High PPM was chosen from children who reached the following criteria: in the top 5 TIS rank in at least two of the novel tasks and ranked in the top five children for teacher proficiency rankings. The Low PPM was chosen from children who reached the following criteria: matched the High PPM in sex and age (within 60 days), bottom ten rank for teacher proficiency ratings, did not come in the top ten TIS rank with any novel task. This was possible for three of the four classes, in the fourth class (Class B) no child reached these criteria so for the High PPM model a child who was ranked in the top five children for proficiency by the teachers, and had a TIS rank of 6 and 12 in two novel tasks was selected, and for the Low PPM model a child who was ranked 15th (out of 27) in teacher proficiency and who met the previously described novel task criteria, was selected. All analyses were run with data from this class included and excluded and the results remained the same. The models were also closely matched for popularity and dominance. With popularity, for all classes there was no more than two peer-selections (of a possible range 0-15) difference between models. With unaggressive dominance, for three classes there was no more than three peer-selections (of a possible range 0-7) difference.
Easy-Reward Hard-Reward
Variables in Equation B SE β t B SE β t
Constant 38.1*** 6.74 5.6 22.8*** 2.19 10.4
Teacher proficiency
ratings -0.79*** 0.21 -0.33 -3.8 -0.9*** 0.22 -0.39 -43.3 Age (months) -5.6*** 1.31 -0.36 -4.3
38 References
Freeman, H. D., Brosnan, S. F., Hopper, L. M., Lambeth, S. P., Schapiro, S. J., & Gosling, S. D. (2013). Developing a comprehensive and comparative questionnaire for measuring personality in chimpanzees using a simultaneous top‐down/bottom‐up design. American journal of