How People Visually Represent Discrete Constraint Problems
Xu Zhu, Miguel A. Nacenta, ¨Ozg ¨ur Akg ¨un, and Peter Nightingale
Abstract—Problems such as timetabling or personnel allocation can be modeled and solved using discrete constraint programming languages. However, while existing constraint solving software solves such problems quickly in many cases, these systems involve specialized languages that require significant time and effort to learn and apply. These languages are typically text-based and often difficult to interpret and understand quickly, especially for people without engineering or mathematics backgrounds. Visualization could provide an alternative way to model and understand such problems. Although many visual programming languages exist for procedural languages, visual encoding of problem specifications has not received much attention. Future problem visualization languages could represent problem elements and their constraints unambiguously, but without unnecessary cognitive burdens for those needing to translate their problem’s mental representation into diagrams. As a first step towards such languages, we executed a study that catalogs how people represent constraint problems graphically. We studied three groups with different expertise: non-computer scientists, computer scientists and constraint programmers and analyzed their marks on paper (e.g., arrows), gestures (e.g., pointing) and the mappings to problem concepts (e.g., containers, sets). We provide foundations to guide future tool designs allowing people to effectively grasp, model and solve problems through visual representations.
Index Terms—Problem Visualization, Problem Modeling, Problem Solving, Constraint Programming, Visual Programming Languages
1 INTRODUCTION
People encounter constraint problems often in their daily lives. For example, one might have to create a schedule for a conference in which some events should take place before other events, avoid certain times, and several other constraints. One of the first steps in the process of solving such problems, as highlighted by the problem solving expert George P´olya, is to represent the problem [63, III].
The potential and importance of appropriate representations of prob-lems is difficult to overstate. An effective description of the problem can be useful to communicate the problem to others or to ourselves at a later point in time. We also know thathowthe problem is represented might have a significant effect on a human’s ability to solve it (e.g., [1, 87]). There are multiple examples of notations (representational systems) considered key in the advancement of areas of science (some graphical examples include Feynmann diagrams [34] and Penrose graphical nota-tion [62]). Finally, if software exists that can help solve the problem, a representation of the problem becomes a key element of the interface. One way of representing problems is through visual representation. Visuals can facilitate problem understanding (one could understand a problem faster and more precisely), communication (a common lan-guage of problem description can avoid misunderstanding between people) and in human-machine interaction (a sufficiently precise lan-guage would enable people to create problem specifications that can be interpreted and solved by a computer). Although there has been a large amount of research in InfoVis about how visualdatarepresentations
• Xu Zhu is with the School of Computer Science, University of St Andrews, Jack Cole Building, North Haugh, St Andrews, KY16 9SX, United Kingdom. mailto:xz32@ st-andrews.ac.uk
• Miguel A. Nacenta is with the School of Computer Science, University of St Andrews, Jack Cole Building, North Haugh, St Andrews, KY16 9SX, United Kingdom.mailto:mans@ st-andrews.ac.uk
• Ozg¨ur Akg¨un is with the School of Computer Science, University of St¨ Andrews, Jack Cole Building, North Haugh, St Andrews, KY16 9SX, United Kingdom.mailto:ozgur.akgun@ st-andrews.ac.uk
• Peter Nightingale is with the School of Computer Science, University of St Andrews, Jack Cole Building, North Haugh, St Andrews, KY16 9SX, United Kingdom, and with the Department of Computer Science, University of York, Deramore Lane, Heslington, York, YO10 5GH, United Kingdom.
mailto:pwn1@ st-andrews.ac.uk
Manuscript received xx xxx. 201x; accepted xx xxx. 201x. Date of Publication xx xxx. 201x; date of current version xx xxx. 201x. For information on obtaining reprints of this article, please send e-mail to: reprints@ieee.org. Digital Object Identifier: xx.xxxx/TVCG.201x.xxxxxxx
are perceived, understood and interacted with, we know relatively little about how to build effectiveproblemvisualizations.
In this paper, we gain understanding of how to build problem vi-sualizations by asking people to visually represent problems in their own way. Our explicit assumption is that understanding how people naturally represent problems will benefit the designs of languages for problem description. For example, a language designed with this knowl-edge in mind could be easier to learn and to translate problems into. Instead of addressing all types of problems, we start by looking only at discrete constraint problems.
We asked 30 participants with three different levels of formal pro-gramming expertise (non-computer scientists, computer scientists who are not constraint programmers and constraint programmers) to sketch visual representations of constraint problems using pen, paper, scissors and colour pens. We analyzed their representations and the videos of their processes. From these we generated a tree of visual elements and a tree of parts of problem language (problem concepts that participants visualized) that support a semiotic analysis.
Our analysis provides a first picture of how people with different levels of formal training in programming approach the task of describ-ing problems. We measured the variability of mappdescrib-ings, catalogued regularities, and selected insights grouped around four main issues: di-agrams and mathematics use; containers and symbols vs. textual labels; the problem of abstract representation through graphical means; and implicit information.
At this stage of the research we cannot make inferential quanti-tative claims that are generalizable to the full population (due to the methodology, the sample size, and the inability to estimate the statistical reliability of our prevalence and entropy measurements). Nevertheless, our findings can inform designers of notations and visual languages dealing with the representation of constraint problems and enable the design of visual notations, languages and interfaces that are easier to learn, faster to understand and are accessible to a wider set of the general population. Some of our findings may also have applicability beyond constraint problems (see Section 8.4).
2 EXAMPLEPROBLEM
To give the reader a more concrete idea of what we refer to as a “prob-lem”, and to show the type of problem associated to the tasks that our participant completed (problems modellable through constraint programming), we present here theknapsackproblem:
This problem might seem contrived, but it is equivalent to problems people encounter in their professional and daily lives such as truck loading. An example model in Essence appears in csplib, problem 133 [33].
3 RESEARCHGOAL, SCOPE ANDQUESTIONS
Our main goal is to provide information (e.g., a catalog of regularities, guidelines) that can help design notations and problem specification visual languages that are easily learnable, understandable and effective. As the space of problems that people may encounter is large, we restrict ourselves to studying problems that can be easily described as
discrete constraint optimization problems, as defined in [69, Chap. 3]. Admittedly, these are a subset of constraints problems (not addressed types include geometric and layout [4], graphs [30, 83], and continuous constraints). The reason for this is three-fold: a) a mature set of software tools (such as ECLiPSe Prolog [3], MiniZinc [57], Savile Row [58] and Minion [20]) exist that can efficiently find solutions; b) this problem family is particularly suitable as such problems are common and relevant in many areas of human activity (e.g., timetabling, resource and job allocation, and even common puzzles [33]); and, c) the aforementioned software solvers are inaccessible for non-experts.
In addition, because the way in which people represent problems is influenced by their experience and formal education, we decided to look at three cohorts of people representing a range of levels of familiarity with formal problem specification: non-computer scientists (Non-CS), computer scientists (CS), and constraint programmers (CP).
Based on this goal and scope, we aim to address these questions:
Q1: Which graphical elements do people choose to externalize
problem constructs?
Q2: Which constructs do people choose to represent?
Q3: Which patterns appear in how people and different cohorts
visually represent problems?
4 BACKGROUND ANDRELATEDWORK
Our work connects several domains of knowledge and research. We discuss problem solving and modeling, visual notations, sketching and visual languages, as well as constraint programming and related techniques. We also introduce semiotic analysis as a technique.
4.1 Problem solving and modeling
Because problem solving is a ubiquitous human activity it has received ample attention from multiple disciplines, including psychology and neuroscience (e.g., [68]) and mathematics (e.g., [63]). Existing research recognizes problem representation as one of the key elements or stages for solving a problem, and scientists often propose notations as a way to advance their fields [34, 62]. Writing and sketching are often seen to be a natural extension of internal mental processes and help to augment human memory and processing capacity [75], which has been studied also for the visualization of data [82].
The role of representation has also been studied in educational con-texts (e.g., [38]). Despite this, most externalized problem representation notations are designed ad-hoc for specific problems, and little attention has been paid to how people construct these problem representations. In contrast, there is a significant amount of work in understanding how people build models of working systems (e.g., physical or economic systems [21]) and, more recently, the role of models in understanding data through visualization [43].
4.2 Visual Notations, Sketching and Visual Languages
Circuit design and manufacturing has long been supported by the use of electrical and electronic diagrams. More recently, the growing complexity of software spurred the development of much work on sup-porting the design and understanding of programs, culminating with the most widely used software specification language, UML [71]. These languages typically specify architectures, structure of systems, and instances of user behaviour, but usually not problems. In methodologi-cally related work (although with a different focus), Walny et al. and Cherubini et al. have studied how software engineers use sketching
to support their thinking processes [14, 80, 81]. Our study shares with these the classification and categorization of sketches.
Simultaneously, many visual programming languages have been pro-posed [11, 29, 55], often as attempts to make programming accessible to broader audiences (e.g., [53, 67, 70]), or to manage the complexity of specifying systems that are highly interconnected [16, 48]. Visual programming languages are typically procedural rather than descriptive or declarative and are not free from their own limitations such as scala-bility [12] and clutter [56, 65]. Some classical drawing and simulation tools like Sketchpad and ThingLab also provide a graphical interface while including geometric or simple numerical constraints. [9, 10, 74] Theoretical aspects of the design, parsing and specification of visual programming languages are extensively discussed by Marriott and Meyer [46].
4.3 Constraint programming and related areas
A constraint problem is a problem that can be expressed through variables and a set of constraints. A constraint is a rule that ex-presses the allowable values of variables or of their relationships. Con-straint Programming [69] and closely-related techniques such as In-teger Linear Programming (ILP) [28] and Propositional Satisfiability (SAT) [8] are declarative methods for stating and solving this kind of discrete decision-making and optimization problem. Each technique has strengths and weaknesses in solving efficiency. Hybrid solvers such as SCIP [23] (hybridizing ILP and constraint programming) are increasingly common. Constraint programming is successfully applied in many high-impact areas such as timetabling, staff rostering, logistics, production planning and experiment design [64, 79].
The process of applying constraint programming to a problem can be crudely divided into two parts:modelingandsolving. Once a problem is modeled into a suitable language, it can be automatically solved using a standard constraint solver. For complex real life problems, the modeling step presents a real difficulty: capturing a correct and efficient model is hard, even for experts. High-level modeling languages like Essence [2, 19] and Zinc [17] reduce the need for this expertise somewhat through abstract domain types like sets, functions, and relations.
There are several examples of visualization tools for thesolving pro-cess, we describe a small selection here. Bauer et al. [6] presented an integrated development environment (IDE) for constraint programming. The IDE provides a visual debugger which displays the search tree that is explored by the constraint solver. The debugger is solver-independent, with minor modifications it can support any solver. However their sys-tem only focuses on visualizing the solving process and not modeling. Recently Goodwin et al. [25] described a user-centered design process for tools that visualize the solving process, building on earlier work by Shishmarev et al. [72]. From an Information Visualization perspective Goodwin et al. [25] looked at how different visualizations could be useful in the process of profiling constraint models. In addition, tools for layout constraints such as Auto Layout are also prevalent in IDEs. To the best of our knowledge, our paper is the first on the topic of visualization for the modeling phase of constraint programming.
4.4 Semiotic analysis
In this article we look at people’s problem description ability using the basic concepts of early semiological analysis as initially proposed by Saussure [18], who defines symbol systems as mappings between signs (signifiers) and the signified. In his famousSemiology of Graphics[7] Bertin dissects, among other things, the mappings between elements on the page (marks) and data. More recently, Horn [31] has performed a semiotic analysis of the multimedia signals used in popular and business communication. Although we borrow from Bertin and Horn, we instead look at the relationship between signs in the page and gestures and elements of problem descriptions.
5 METHODOLOGY
5.1 Participants
We recruited 30 participants, 10 belonging to each of the three expertise groups, all from a local university. Non-CS participants (7 female, between 19 and 28 years in age), were non-computer scientists with little or no programming experience. Computer scientists (4 females, between 19 and 42 years in age) were students in a computer science degree with little or no experience in constraints programming but with experience of computer programming. Constraint programmers (CP) (1 female, between 21 and 64 years in age), were a mixture of students and staff who have either taken a constraints programming module, taught one or conduct research in that area. Participants received gift vouchers for their time. The three distinct groups were chosen because the way in which people represent problems is likely to be influenced by their experience and formal education, and they represent a range of levels of familiarity with formal problem specifications.
5.2 Procedure, Tasks and Problem Selection
Each participant provided written consent and was then assigned two problems. Problems were selected from a pool of constraint problems collected from csplib [33] as well as suggested by constraint program-ming experts. We selected six problems according to the following cri-teria: a) should not be too difficult to understand by a non-programming person; b) should contain elements that are familiar to most people; c) problems that are familiar to the general public are preferable; and d) should cover a wide range of constraint problem types. We piloted the selected problems to ensure that participants had sufficient time to explore them and to avoid those not easily understandable. Two of this article’s authors independently rated the problems for solving difficulty on a scale of 1 to 5. We used the difficulty scale as well as thetypeof problem to balance the selection of problems for each participant. All groups addressed all problems the same number of times in aggregate. The final selected problems are: Word Crypto, Subset Sum, Sudoku, Scheduling, Magic Square, and Knapsack. Exact formulations are in the supplementary materials.
For each of the two problems assigned to them, participants had to carry out a visual modelling/specification task as well as a problem solving task, in sequence. Programmers in the CS and CP groups had to perform an additional programming task. The problem solving and programming tasks are not analyzed in this paper. Participants always completed all representation tasks first, which precludes bias due to the additional tasks performed by the CS and CP groups.
In the visual modelling/specification tasks the experimenter asked participants to try to illustrate a problem to a friend assuming that they can only communicate using paper. The experimenter also instructed the participants to try to use as few words as possible in the specifica-tions. Our intention here was to prevent participants simply repeating or rephrasing the textual instruction given to them. Participants had 14 minutes to complete this task. Participants talked aloud, describing their thoughts and actions and, occasionally the experimenter would ask for clarifications or offered short reminders of the task. After the specification tasks they would complete the problem solving task and (if applicable) the programming task. Then they repeated the same process with their second assigned problem.
5.3 Apparatus
The experiment took place in a quiet closed room with the participant and the experimenter sitting at a table. Blank paper, pencil, pen, colored pencils, eraser, scissors and a pencil sharpener were provided. Two different cameras from two vantage points ensured full coverage of the paper as well as a complete view of the participant’s actions.
5.4 Raw Data
The analyzed data consists of the two streams of video for each of the participants (a total of 801 minutes of video per stream), and the paper output from their specifications (available in the supplementary materials). Snippets from these materials in the remainder of this paper appear marked with the expertise group (Non-CS,CS,CP), the number of the participant within that group (from 1 to 10) and whether this was their first or second problem (E.g., CS 7,2).
5.5 Analysis Methodology
We analyzed both the artifacts from each participant (their sketches) and their video. As a preliminary step, we transcoded the two video streams to allow simultaneous viewing of the different camera angles. In a first analysis step, we analyzed the artifacts produced by creating an affinity diagram of common occurrences and general themes. We then iteratively coded the features that appear within the sketches us-ing MAXQDA [78] initially and then usus-ing Microsoft Excel, refinus-ing the code books on each pass, following grounded theory techniques. Towards the end we settled into two main groups of codes: Visual Elements (VE) and Parts of Programming Language (PL). The cate-gories were developed using a langauge based approach as this was most flexible. We also iteratively coded the videos for occurrences of gestures and, in a final pass we analyzed process elements (e.g., in which order did examples and generalizations took place). The authors meet 3 or 4 times during this period to clarify any ambiguities in the categories. These form the basis for the analysis in Sections 6.1 to 6.3.
5.6 Coding Validation Analysis
The bulk of the coding was performed by the first author. In order to ensure the robustness of the coding system, the remaining three authors performed two independent coding passes of a subset of 50 of the 230 artifacts in the first pass, and 25 of the 230 artifacts (3 out of 30 participants) and 6 of the 60 videos, at two stages in the development of the code books (approximately 20 person-hours of joint coding in total). We calculated the inter-coder reliability ratio as the number of agreements divided by the total number of codes in the Visual Elements (VE) category, averaged across all participant outputs (result: 94.5% agreement for the final coding session).1To account for randomness, we also calculated the Cohen Kappa statistic [49] using the scikit-learn python library [61] (κ=0.58 when coding VE and PL as separate codes andκ=0.37 when coding VE-PL pairs). The numbers reported above refer to the final coding validation only and roughly correspond with what is expected in a qualitative coding of this characteristics, especially taking into account that the Kappa coefficient also has limitations [76, 77]. Regarding the nature of the interpretation of participants’ outputs see also Section 8.4. The supplementary materials contain the CSV and python code that we used for these calculations.
6 ANALYSIS
The analysis results are split into three: the graphical elements ( sig-nifiers) that participants used; a catalog of problem constructs (the
signified); and the relationships between elements in the previous two, with frequencies in which participants across groups mapped them as well as a summary of the most relevant regularities. Note that, although we provide multiple numerical measurements from the data (e.g., en-tropy), our analysis approach does not allow statistical estimates of the reliability of these measures; readers should exercise caution when applying or extrapolating these numerical findings.
6.1 Elements of Visual Representation (VE)
Participants created a variety of marks on paper to describe problems. Although we asked them to use graphical means to convey the prob-lems (marks on paper, or paper cut-outs), we noticed early on that, to explain the permanent graphical elements and their relationships, most participants used also gestures. To avoid missing a potentially important source of meaning, we considered gestures in our analysis. From now on we refer to permanent marks on paper or physical objects (cut-outs)2and their characteristics (e.g., color) asmarks, to distinguish them fromgestures(e.g., pointing with a finger). Together, marks
1The data was coded from two perspectives, the Visual Elements (VE) perspective, looking at marks on the paper, and Parts of Problem Language (PL) perspective, looking at problem elements used in representation. See section 6 for more details.
and gestures are thevisual elements of representation(VE), i.e., the graphical vocabulary to visualize problems.
The tree of visual elements in Figure 1.B contains the categoriza-tion of marks and gestures that emerged from the analysis. We made categories based on interesting regularities rather than following pre-defined classifications of marks such as Bertin’s [7, p.44] or Mun-zner’s [54, p.96]3and gestures (e.g., [26, 40, 60, 65]), which might not have captured with sufficient detail some of the interesting phenomena in our specific scenario of problem representation, or might provide too many categories, making the analysis unnecessarily detailed.
6.1.1 Marks (VE1)
We observed a variety ofmarksand mark characteristics (visual chan-nels). We divided them into eight categories for which we provide a brief description and a representative example from our participants’ outputs in Figure 2. The categories are number-coded in Figure 1.B and the colors for the categories are reused in further figures.
VE1.1 - Graphical Containers. In this category we group ele-ments that typically contain other eleele-ments inside. There are three sub categories:boxes and circles(VE1.1.1),grids(VE1.1.2), and ta-bles(VE1.1.3).Boxes and circlesare geometric shapes of a size large enough to fit text or other objects inside. These are common in real-world diagrams and were often used by our participants (21 out of 30 participants).Gridsare different from tables in that position of a cell in the grid is spatially important (e.g., the top left cell might be special, or the adjacency of two cells or two columns carries a meaning), whereas intablesthe order of columns and rows might be less important (rows and columns in tables are typically labeled and it typically does not
matter in which order the columns appear on a table). Gridswere
used by 18 out of 30 participants andtableswere used by 12 out of 30 participants. Seven participants used both grids and tables. These numbers are likely influenced by the problem assignments for those participants (some problems are already in a grid or table form).
VE1.2 - Symbols. This category refers to atomic graphical ele-ments that are not labels or mathematical symbols (technically, labels and mathematics use symbols too but we separate them into their own categories). There are four subcategories ofsymbols: punctuation
marks such as questions marks or exclamation marks (VE1.2.1);people
(VE1.2.2), which are stick figures or people symbols not showing emo-tion;emojis(VE1.2.3), which are people symbols showing emotion; andothers(VE1.2.4), which includes more abstract symbols such as ticks, small arrows4, small geometric shapes (e.g., triangles, circles, squares, stars) and brackets. 25 out of 30 participants usedsymbols.
VE1.3 - Labels. Participants often used single letters or written words to represent objects or to annotate other elements on the page.
Labelsare different fromsymbolsin that they are more directly con-nected to written language, and therefore usually have a pronunciation and could represent conceptual meaning or elements that are difficult to draw in a more straightforward way. Numbers are sometimes also used withlabelsto indicate order, otherwise thelabelsare usually unordered. Only 4 out of 30 participants never usedlabels.
VE1.4 - Text. We classify the use of textual language astext
when it contains complete or incomplete sentences that go beyond just labeling. This typically happens when there is a verb. Note that participants were explicitly discouraged from using text directly in their representations, yet 11 out of 30 did. This is further discussed in sections 7.3 and 8.2.3.
VE1.5 - Maths. Participants used mathematical script in two roughly different ways. We separate‘simple’(VE1.5.1) use ofmaths
such as basic mathematical expressions like numbers and simple op-erators such as+,−,>,=,6=, andΣ, from what we call‘advanced’
(VE1.5.2) mathematical expressions, which might include more com-plex constructions from set theory (∀,∃) or formal logic. 30 out of
3For practical reasons we do not differentiate mark types and channels. 4Arrows that do not go from one place to another and instead indicate change (e.g., increasing or decreasing quantity).
30 usedmaths; this is likely to have been influenced by the problem types. Although maths is graphical, we will not refer to maths notation as graphical notation in this paper.
VE1.6 - Arrows and Lines. Arrows and linesare common ele-ments in most diagrams and were also common in our data set.Arrows and linesare used to connect graphical elements on the page with each other (see – in Figure 2). 28 out of 30 participants usedarrows or lines.
VE1.7 - Colors. Coloris commonly used in visualizations for a variety of purposes, e.g., to show different instances or that two objects are the same. We made color pens available to our participants, which 20 of the 30 participants used to convey some meaning.
VE1.8 - Proximity. Sometimes participants put visual elements next to each other to indicate relationships between them. Although this is a more implicit type of relationship representation (there is not a permanent mark), implicit information might still be important. We coded instances where theproximityof elements was clearly used to convey meaning or when the participants mentioned the spatial relationship verbally. In some casesproximityworks as an implicit version of the graphical containers subcategory (VE1.1 – e.g., grids where the grid is not explicitly drawn). We observedproximityencoding in 27 out of 30 participants.
6.1.2 Gestures (VE2)
To keep the analysis manageable we only categorizedgestureswith hands and fingers that interacted with the elements on the page or the page itself. These gestures took place when the participants explained the representations previously created on paper, were thinking about how to represent the problem, or during the process of writing or
drawing. Gestureswere sometimes complementary to marks on the
page, when participants traced lines or circles already drawn on the paper, although they often did not correspond to marks on the paper. We distinguish between two types ofgestures,pointinggestures and
pathgestures.
VE2.1 - Pointing. We put in this categorygesturesperformed with a finger that highlight an object or area in the page. There are three sub-categories:serialpointing (VE2.1.1), where the participant pointed at one object once or at multiple elements or areas successively;parallel
pointing (VE2.1.2) where the participant would use multiple fingers to point simultaneously at several elements or areas; andmulti-tap
(VE2.1.3) pointing gestures where the same element is being repeatedly tapped. All 30 of the participants used some type of pointing gesture.
VE2.2 - Paths. Pathsrefer togestureswhere the finger or hands trace a meaningful trajectory on the paper. We observed three sub-categories:drag(VE2.2.1) where the finger starts on a page location, usually an object, and moves to a different place while still in contact with the surface;manipulations(VE2.2.2) which move a physical ob-ject from one location of the page or table to another (only applies to cutouts); andlassos(VE2.2.3) where the path traced is closed and delimits a regular or irregular area (usually with multiple elements inside). Due to their ability to connect to separate elements,dragpaths are related toarrows. Lassosare also related to graphical containers because both categories can surround or contain other elements.
6.2 Parts of Problem Language (PL)
Parts of Problem Language
PL1 Objects
PL1.1 Variables PL1.2 Containers
PL1.3 Instances PL1.4 Sets
PL1.5 Examples
PL2 Selection
PL2.1 Elements PL2.2 Groups
PL3 Verbs
PL3.1 Put Into PL3.2 Is Part Of
PL3.3 Is Same As PL3.4 Instance Of
PL4 Modifiers PL5 Sequencers
VE1 Marks
VE1.1 Graphical Containers
VE1.1.1 Grids VE1.1.2 Tables
VE1.1.3 Boxes/Circles
VE1.2 Symbols
VE1.2.1 Punctuation VE1.2.2 People
VE1.2.3 Emoji VE1.2.4 Other
VE1.3 Labels VE1.4 Text VE1.5 Maths
VE1.5.1 Simple VE1.5.2 Advanced
VE1.6 Arrows/Lines VE1.7 Colors VE1.8 Proximity
VE2 Gestures
VE2.1 Pointing
VE2.1.1 Serial VE2.1.2 Parallel
VE2.1.3 Multi-tap
VE2.2 Paths
VE2.2.1 Drag VE2.2.2 Manipulation
VE2.2.3 Lasso Visual Elements
A
[image:5.612.57.567.50.166.2]B
Fig. 1. Tree diagrams of the hierarchy of parts of problem language (PL–A,top) and visual elements (VE–B,bottom).
[image:5.612.55.305.308.675.2]Note also that we chose a classification that expresses a broad range of constructs in problem description, regardless of whether those actu-ally belong to the set of constructs used in actual constraint program-ming languages or other type of programprogram-ming languages. For example, constraint programming languages are generally declarative, but our classification can describe procedural constructs (e.g., “put these ob-jects in these variables, check that their sum is less than 10, if it is...”). Table 1 shows a glossary of approximate correspondences between our categories and the concepts and terms used in linguistics, programming languages and constraint programming languages.
Table 1. Correspondences between PL, CS and CP concepts.
ID Concept Part of speech Programming Constraint Programming PL1 Objects Nouns, Noun
Phrases
PL1.1 Variables Variables Decision variables
PL1.2 Containers Data structures,
collections
Collection of variables
PL1.3 Instances Objects or Structs Values
PL1.4 Sets Types, Enums Domain
PL1.5 Examples Values, Data
structure state, assignment of values to variables
Instance assignment
PL2 Selection Pronouns, demonstratives
Indexing (applied to data), constraints (appl. to variables)
PL2.1 Elements Indexing, Aliases
PL2.2 Groups Slices
PL3 Verbs Verbs Properties,
inheritance
Indexing (appl. to data), constraints (appl. to vars)
PL3.1 Put Into Assignment
PL3.2 Is Part Of Attributes (and
problem decomposition)
PL3.3 Is Same As Equivalence
PL3.4 Instance Of Instantiation
PL4 Modifiers Adjectives Conditional Expressions
Constraints PL5 Sequencers Temporal AdverbsLogical flow
PL1 - Objects. The objects category is analogous to nouns or noun phrases in language grammars. Using the knapsack prob-lem, each uniqueobject (e.g., water bottle) would be aninstance
(PL1.3). Variables(PL1.1) are references toobjectswhere the
ref-erencedobjectmight change over time. For example, thevariable
totalObjectsValuemight refer to the sum of the value of backpack
objects at a particular time, which might vary during the process or for different solutions. Containers(PL1.2) are collections or groupings ofinstancesorvariables, roughly equivalent to the concept of data structures in programming languages. For example, a list of all the ob-jects contained in the knapsack can be acontainerof severalinstances
(e.g., water bottle, raincoat, sandwich) or of several variables (object1,
object2,object3, etc.) if the objects have not been specified.Sets
(PL1.4) are groupings of uniqueobjectsthat denote the possible in-stancesthat can be referenced to by avariableorcontainer. This is
roughly equivalent to the concept ofEnumsin common programming
languages. In our example, asetcould be all available objects to put in the knapsack. When avariableor acontaineris shown in a particular state, we call that anexample(PL1.5). E.g., a possible list of objects contained in the knapsack will be anexampleif it is represented as having four specificinstancesof concrete objects. Examples can also be negative, describing a state that is not valid.
PL2 - Selections. Selectionsrefer to the highlighting of one or moreobjectswhich will be used with averb(PL3, described below). There are two types ofselections: element selections(PL2.1) and
groups(PL2.2), depending on whether one or moreobjectsare being selected. A description of a problem might use selection to denote, in our example, that a particular group ofobjectsmake up thesetof objects that can be placed in the knapsack.
PL3 - Verbs. Verbsare actions or operations that are applied to
objects. They includeput into(PL3.1) which assigns an object or selection to acontainerorvariable,is part of (PL3.2), which describes whencontainersare split into sub-containers to show a sub-part view,
is same as(PL3.3) which indicates that two representations refer to the sameobject, andinstance of (PL3.4) which selects aninstanceout of aset. An example ofput intofor the knapsack would be assigning a particularsetto fit into the knapsackcontainer. If the same object is represented twice, e.g., once to describe what is currently in the knapsack and once in a list of objects ordered by value, then a mark indicating that both are the same would be functioning asis same as.
PL4 - Modifiers. Modifiersis a large category covering all the constraints that can be applied toobjects,selectionsorverbs.Modifiers
can limit values, indicate that values should be all different, to maximize or minimize or to find all possibilities. For example, a representation that indicates a variable that contains the sum of all weights in the knapsack has to be below 30 would be considered amodifier.
PL5 - Sequences. A mark or a gesture functions as asequenceif it provides an indication of temporal order, akin to a temporal adverb or adjective in linguistic terms.Sequenceswere rarely used but some participants implicitly or explicitly provided procedural descriptions (e.g., algorithms). An example sequence in our running example would be an indication that the list of knapsack objects has to be populated first with the object of highest value, then with the second, etc.
6.3 Semiotic Mappings
CS 7,2
VE1.1.1 Grids
VE1.5.1 Simple Maths VE1.6 Arrows/Lines VE1.5.1 Simple Maths
VE1.3 Labels
VE 1.2.4 Other Symbols VE 1.6 Arrows/Lines
VE1.5.1 Simple Maths VE1.4 Text VE1.1.1 Grids
VE1.8 Proximity
VE1.7 Colors VE1.1.3 Boxes/Circles
VE1.5.1 Simple Maths VE1.2.4 Other Symbols
VE1.1.1 Tables VE1.2.2 People Symbols
VE1.2.3 Emoji VE1.5.2 Advanced Maths
VE1.5.1 Simple Maths VE1.3 Labels VE1.2.1 Punctuation VE1.5.1 Simple Maths
Non-CS 9,2
CS 3,2
Non-CS 2,2 CS 8,1
Non-CS 1,1
CS 2,1
CS 6,1
Non-CS 3,2 VE1.1.1 Grids
VE1.2.4 Other Symbols
Non-CS 10,2
[image:6.612.46.560.51.511.2]Non-CS 4,2
Fig. 2. Snippets of participant outputs highlighting examples of all visual marks.
6.4 Input/Output Entropy Analysis
If the same type of visual element is used to carry out many different functions (e.g., if we use textuallabelsto representinstances, name
sets, labelexamplesand tagmodifiers) this might make it harder for the reader of a diagram to recover the meaning of the label when they encounter it. To quantify this we can calculate the Input/Output Entropy of the mappings. In other words, we can calculate how many bits of additional information we would need to recover which PL, a VE is referring to. We perform this calculation using the finer categories in the VE tree, and apply the following formula to the aggregated mappings of each expertise group and the total:
m
∑
o=1
n
∑
i=1
− xio ∑ni=1xio
·log2
xio
∑ni=1xio
· ∑
n i=1xio
∑mo=1∑ni=1xio
!
whereiis the input (PL) index,ois the output (VE) index,xiois a particular number of uses for that input and output combination,mis the total number of outputs andnis the total number of inputs.
Table 2 summarizes the results, and shows how the higher the level of formal education in modelling, the smaller the entropy value. It
[image:6.612.303.559.639.669.2]should be highlighted that, in our calculations we added the rule that the use of maths would not add entropy. The reason is that maths can be effectively used for several purposes, using well established symbols that would not add confusion (e.g., brackets for sets, numbers as instances). Although it would be possible to apply the same logic to other areas of the VE tree (e.g., arrows could be combined with labels or colors to separate different functions), we did not observe occurrences of this.
Table 2. Input/Output Entropy for the different cohorts, in bits.
Cohort Non-CS CS CP Total
Input/Output Entropy 1.26 1.23 1.12 1.31
7 FINDINGS
This section collects the main insights gained from the analysis pre-sented above. Insights are discussed by topic and highlighted bold.
7.1 Participant diagrams are chaotic but there is regularity
Total
(43) Variables
Objects Selection Verbs
Containers (61)
Total: 666
Total: 666 Instances (73) Sets (73) Examples (73)
Elements (27)
Groups (60) Put Into (50)
Is Part Of (16) (41)
Instance Of Modifiers (102)
Sequencers (6)
Graphical Containers
(75) Symbols (100) Labels (79) Text(21) Maths (179) Arrows/Lines (59) Colors (46)Proximity (27)
Pointing (57) Paths (23) (41)
Is Same As
42 17 14 14 14 32 32 18 43 43 43 43 38 19 20 26 15
b j
i
g
a
h c
Non-CS
(15)
Variables Containers (21) Instances (27) Sets (27) Examples (27)
Elements (8)
Groups (21) Put Into (16)
Is Part Of (3) Instance Of (13) Modifiers (36)
Sequencers (2)
Graphical Containers
(30) Symbols (42) Labels (28) Text(6) Maths (65) Arrows/Lines(16) Colors (15)Proximity (8) Pointing (15) Paths (5) (14)
Is Same As
Total: 230
Total: 230
16 7 5 5 5 5 13 8 6 16 16 16 15 12 5 6 7
Objects Selection Verbs
d
CS
(14)
Variables Containers (19) Instances (23) Sets (23) Examples (23) Elements (10)Groups (22) Put Into (20)Is Part Of (7) (16)Instance Of Modifiers (33) Sequencers (4)
Graphical Containers (22)
Symbols (35) Labels (15) Text (8)
Maths (57) Arrows/Lines (30) Colors (21) Proximity (12)
Pointing (17) Paths (11) (14)
Is Same As
Total: 228
Total: 228
15 5 6 6 6 10 10 5 13 13 13 15 16 5 5 7 8 7 7
Objects Selection Verbs
d
e
f
CP
(14)
Variables Containers (21) Instances (23) Sets (23) Examples (23)
Elements (9)
Groups (17) Put Into (14)
Is Part Of (6) (12)
Instance Of Modifiers (33)
Graphical Containers (23)
Symbols (23)
Labels (36)
Text (7)
Maths
(57) Arrows/Lines (13) Colors (10) Proximity (7)
Pointing (25) Paths (7) (13)
Is Same As
Total: 208
Total: 208
11 5 9 14 6 6 7 14 14 14 13 10 6 8 12 5
Objects Selection Verbs
[image:7.612.55.566.49.694.2]d
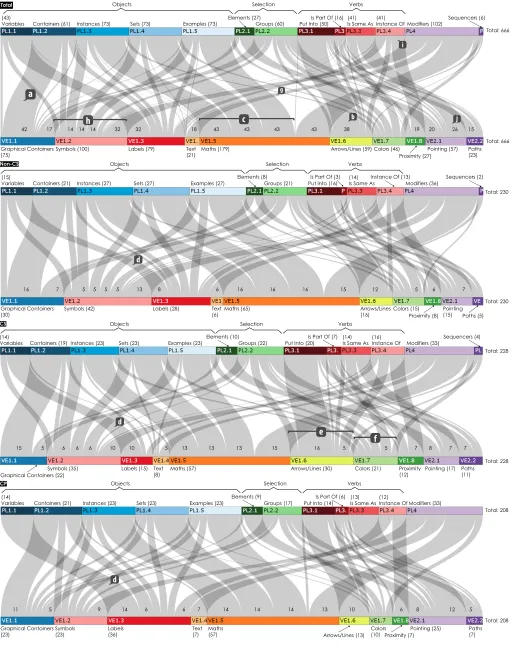
Fig. 3. Sankey diagrams showing the mapping between VEs (top) and PL (bottom) for All, Non-CS, CS, and CP participant groups.
represent constraint problems. A priori, results could have varied from a perfectly chaotic set of graphical representations (the same marks or gestures are used inconsistently to represent any concept), to a perfectly
The findings of the study, especially in the form of the diagrams in Figures 1–3 and the entropy Table 2 show a picture somewhat in
the middle. Participants’ representations of constraint problems
are not consistent(input-output entropy values are not close to zero) and substantial variation exists in how participants represent the same PLs. For example,variables(PL1.1) were represented by participants usinggraphical containers,symbols,labelsand in one instancemaths. Very diversely represented PLs are groupselection(PL2.2 – 7 different first-level marks or gestures at the high level to representselections:
graphical containers,symbols,arrows/lines,colour,proximity, and bothpointingandpathgestures), andinstances, sets and examples
(PL1.3-5 – 6 types of marks). However,neither are the mappings
completely void of regularity; if this was the case the calculated input-output entropy values would not be in the 1.1–1.4 range that we observed (Table 2) and would instead be closer to the theoretical maximum given the number of categories in our scheme—3.7 bits.
7.2 Intrinsic, Expected and Unexpected Regularities
We observed many regularities in the mappings. Here we present the most obvious in three loose groups based on whether they areintrinsic
to the nature of problem language and marks,expecteddue to the setup of the problem or the makeup of the participant groups, andunexpected.
7.2.1 Intrinsic
We saw thatgraphical containersare mostly used ascontainers(42 out of the 61 uses ofcontainers) (Figure 3, a).Graphical containers
(VE1.1) are, by definition, able to contain other elements inside, and therefore their use to representcontainers(PL1.2) is a natural choice for most people (see Figure 4.A). In other words,graphical container
marks and the concept ofcontainersperform very similar functions in the representation and the conceptual sides of the problem respectively, and this leads participants to this pairing.
CS 1,1 (a)
(b)
Non-CS 2,2 Non-CS 10,1
Non-CS 8,1
[image:8.612.47.295.386.482.2]CP 6,2 CP 6,1 Fig. 4. Snippet of artifact showing (a)containers, (b)put into.
In a similar way,verbs, which in language usually connect a subject with an object seemeasier to represent througharrows/lineswhich connect two separate elements in the graphical space (Figure 3, b). A clear example of this isput into(PL3.1), which is represented largely byarrows/lines(38 out of 50 cases–see Figure 4.B). We could describe this as the shape of a visual element determining the syntax of the visual language.
We also found that theuse patterns ofdraggestures(VE2.2.1)are parallel to those ofarrows(VE1.6). This makes sense, sincedrag
gestures replicate the characteristics ofarrows/lines(they connect two separate elements), except that they are transient visual elements rather than permanent marks. Other similar correspondences between gestures and marks exist:lassos(VE2.2.3)sometimes work asboxes/circles
(VE1.1.3) andserialandparallelpointing gestures(VE2.1.1 and
2.1.2)often do the same work aslines/arrows.
The paragraphs above describe regularities that are likely a conse-quence of the intrinsic characteristics of the VEs and their relationship to the PLs; however, we note that there are always representation alter-natives, even if most participants chose not to use them. For example, containment can be represented viaarrows,verbscan be represented by containment; both can also be expressed withtext.
7.2.2 Expected
Numbers, which appear in our scheme assimple maths(VE1.5.2)were often used to representinstances,setsandexamplesthroughout the
different representations and groups (Figure 3, c). This is likely due to the problem set selected for the experiment being often number-based. We also saw differences in patterns across the participant groups that can be expected from their formal training.CP used moreadvanced maths, probably because they are familiar with the advanced notation and regularly use it. Due also to differences in training, the mappings
also show a clear preference by theCS and CP groups for using
labelsto representvariables(as they usually do when programming with editors) (Figure 3, d). In the case of CP,labelswere the only mechanism to representvariables, whereas CS used alsosymbolsand
numbers5. Somenon-CS also used unlabeledgraphical containers
to representvariables(i.e., a box that contains a different value at different times). Although this is a common metaphor in beginner programming textbooks to introduce the concept of variable, we only saw this in three problems by two participants.
7.2.3 Unexpected
Some trends are not easily explainable. We noticed thatCS use ar-rows/linesfor more purposes than other groups(forgroups,put into,
is part of,is same as,instance ofandsequencers, whereas non-CS only used them forgroups,put into,is part of andinstance of, and CP used them only forput intoandis part of) (Figure 3, e).
CP used graphical containers to represent more PLs than any of the other groups(CP:containers, instances, sets, examples, element selection and group selection; CS:containers, element selection and group selection; Non-CS:variables, containers, element selection and group selection).
The Sankey diagrams also show thatCS usedcolor more often
than other groups(for 21 PL-VE problem instance pairs vs CP 10 pairs and non-CS in 15 pairs) (Figure 3, f).
7.3 Use of Text vs. Graphical Marks
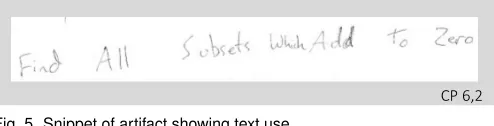
Our experimental protocol included asking participants to minimize the use of text and written language and favor the use of graphical means in their representations. Despite of this, we observed the use oftext(VE1.4) in the form of sentencesin a substantial number of occasions(21 problem instances across all expertises). Participants usedtextas a last resort for elements that they found important but difficult to represent otherwise. Therefore,textuse provides indirect evidence about which PLs are harder to represent visually. For example, CP Participant 6,2, when solving the subset sum problem, encoded the constraints throughtextin the following way:“Find All Subsets Which Add To Zero”(Figure 5.
CS 1,1 (a)
(b)
Non-CS 2,2 Non-CS 10,1
Non-CS 8,1
CP 6,2 CP 6,1
Fig. 5. Snippet of artifact showing text use.
The Sankey diagrams and the tables in the supplementary materials show thattext was mostly used to represent modifiers(PL4),with a few examples of use for instances, sets and examples(Figure 3, g). In other words, participants found it difficult to represent constraints with any other types of visual marks, includingmaths.
7.4 Use of Maths vs. Graphical Marks
The generalized and consistent use of mathematical notation
(maths–VE1.5– is the most commonly used group of marks) is note-worthy. Some concepts such as addition, or inequality comparisons (greater than or less than) are plausibly quite easy to represent through graphical constructions. For example, agreater thancomparison is visually perceived by a visually obvious difference in height when
[image:8.612.311.558.499.562.2]represented in a bar chart, or even by the position of an element in a number line [41]. Yet when representing the concept ofgreater than
the overwhelming majority of our participants chose to simply write a mathematical expression that uses the symbol>. Mathematical lan-guage is a formalized lanlan-guage that is used to represent reality and that is learned by most people early in their education; therefore it is not altogether surprising, although still significant, that our participants chose touse mathematical notation instead of drawing from visual properties or inventing their own graphical notations. The point also extends to the use of numbers—although there might be other rep-resentations of cardinality and ordered sets that might be visually more evident, people’s use of numbers and digits is second-nature. These points are further elaborated in Section 8.
7.5 Use of Symbols vs Labels
We separatedsymbols (VE1.2) as a separate category of graphical
marks. Symbolsare similar to labelsin that they are very flexible marks that can represent many PLs, and be quite abstract.Participants usedsymbols to represent specificinstances, variables, modifiers (constraints) or to refer tocontainers(see (Figure 3, h)). Just as
labels, they often provide a shorthand to refer to other elements on the page that might otherwise be time consuming to redraw (see Figure 6).
CS 1,1 (a)
(b)
Non-CS 2,2 Non-CS 10,1
Non-CS 8,1
[image:9.612.317.567.94.174.2]CP 6,2 CP 6,1 Fig. 6. Alabelused to avoid redrawing the grid.
CS 1,1
(a)
(b)
Non-CS 2,2
Non-CS 10,1
Non-CS 8,1
[image:9.612.316.573.278.646.2]CP 6,2
CP 6,1
Fig. 7.Symbolsrepresenting aninstance(l),variable(r) andset(below).
Despite the similarity of functions withlabels,symbolswerestill
heavily used. Figure 7 shows the use ofsymbolsfor ainstance, set and variable, demonstrating their versatility (symbolswere used by 25 out of 30 participants andlabelswere used by 26 out of 30).
7.6 Implicit Representations
Not everything is represented using marks on the paper.Participants often represented elements, especiallyverbs(PL3), moreimplicitly either through proximity on the page or gestures. This is important because implicit graphical relationships and gestures can be difficult to recognize by human and computer interpreters (this is further discussed in Section 8.2.5). Some examples of the most common implicitly represented elements follow.
Participants often indicated implicitly that something is an in-stance of(PL3.4)throughproximityon the page(VE1.8–18 out of
27 times–Fig 8.a) (Figure 3, i). Similarly,same as(PL3.3),is often signalled bypointing(VE2.1–26 out of 57 times–Fig 8.b) (Figure 3, j). Interestingly,CP did not makesame asexplicit in a graphical way.6
Non-CS 2,1
CS 10,2 Non-CS 2,2
(a)
Non-CS 3,2
[image:9.612.318.567.282.357.2]CP 1,2 (b)
Fig. 8. Figure showing (a)instance ofthroughproximity (b)same as withparallel pointinggesture.
Another part of problem language that isnot commonly
repre-sented on paper but appears sometimes as gestures iselement se-lection(PL2–Fig 9), especially for CS and CP cohorts (39 times overall, out of which 15 times for CS and 15 times for CP). Participants also denotedis part ofthrough gestures (5 times–Fig 10) andproximity(5 times–Fig 11). Interestingly, CP did makeis part of explicit for the most part (4 out of 6 times).
Non-CS 2,1
CS 10,2 Non-CS 2,2
(a)
Non-CS 3,2
CP 1,2 (b)
Fig. 9.Element selectionrepresented throughlassogesture.
Non-CS 2,1
CS 10,2 Non-CS 2,2
(a)
Non-CS 3,2
[image:9.612.55.304.287.586.2]CP 1,2 (b)
Fig. 10.Is part ofrepresented through aserial pointinggesture.
Non-CS 2,1
CS 10,2 Non-CS 2,2
(a)
Non-CS 3,2
CP 1,2 (b)
Fig. 11.Is part ofrepresented throughproximity.
Finally, looking at the Sankey diagrams from the bottom-up,implicit representation elements(Proximity and Gestures, VE1.8 and VE2)
are only used to representverbsandselections.
7.7 Bottom-up vs Top-down Processes
We were interested in understanding not only the kind of mappings that people make, but also how the process of creating representations
[image:9.612.317.566.455.639.2]takes place and may support understanding of the problem. For this purpose we carried out an initial process analysis by looking at the videos of participants creating their representations. More specifically, we looked at when they created examples as opposed to when they described general structures or relationships.
The analysis revealed thatmost participants(all but one)start try-ing to describe the problem with general rules and abstract struc-tures. Participants then resort to examples that often expose the incompleteness of their specifications(26 out of the remaining 29), andfinally they review their output to establish relationships be-tween the general and the specific. Of the three participants that stayed at the abstract level without examples, two were CP and one CS.
An additional observation about process is thatparticipants often redraw parts of their representations, perhaps to clarify and clean their output, but perhaps also to give themselves the time to understand, review, and debug what they have done as part of their thinking process. Ten out of the thirty erased or crossed out parts of their previous marks.
8 DISCUSSION
Here we interpret the findings from Sections 6 and 7 and elaborate on their implications for the goals stated in Section 3.
8.1 Addressing the Research Questions
Our analysis of the data from thirty participants provides a picture of the visual elements that they used (Q1), and the kinds of constructs that they aim to represent (Q2). These are represented as the VE categories tree in Figure 1.B and the PL categories tree in Figure 1.A respectively. The bulk of our results, however, is the description of the ways in which VEs are used to represent the PLs by the different groups (Q3). These are summarized in the diagrams in Figure 3 which are then dissected and complemented by examples in Section 7. The following discusses the findings around the most important topics.
8.2 Key Topics
8.2.1 Towards a consistent problem graphical language
InVisual Language, Global Communication for the 21st century, Horn argues that visual forms of communication “have begun to encounter one another and integrate into a larger, more inclusive language” [31, p. 5]. The question occupying us is whether this “confluence visual language” seems to be happening, and whether it applies to the spec-ification of constraint problems. Within this chosen area of interest, our evidence suggests that the use of graphical means to represent problems is not consistent across people and that people only partially know how to take advantage of graphical means to represent problems effectively. More formal modelling expertise translates into slightly improved consistency (Table 2).
Nevertheless, the found regularities provide a starting point for the design of languages for constraint problem specification. We can lever-age this knowledge in three ways: first, designers can choose graphical representations, concepts and mappings that are somewhat familiar or “natural” to people, with the associated advantage of making the language easier to learn and more straightforward; second, when peo-ple’s current representations fail to be complete, accurate, or readable, designers can use this information to design better alternatives; and third, knowing which concepts are hardest to represent highlights what will require better solutions and more training.
8.2.2 Diagrams vs Maths
One might claim that we already have an appropriate language to represent problems: the language of mathematics. This is somewhat corroborated by our analysis; we found examples in our data that indi-cate that maths notation does already much of the work of representing problems. A basic example is representing ordered sets. It is difficult to beat numerals (which we classify asmaths) to express order (our participants all used numbers when trying to represent order). We also observed that participants very rarely use graphical means to represent number comparisons, instead using mathematical symbols (e.g.,>, <). Although these symbols are not completely abstract or arbitrary (see Figure 12.left), there exist graphical alternatives in visualization to
represent differences and comparisons (e.g., Figure 12.right) yet people generally still prefer the short hand.
[image:10.612.310.555.83.132.2]2 < 4 5 > 2 2 = 2 2 < 5 5 > 1 2 = 2 Fig. 12. The greater than, lesser than and equals symbols can be considered shorthand for visual representations of comparison (left); other graphical representations of comparison are also possible (right).
Mathematical notation is powerful enough to represent most prob-lems, and its symbols are mostly consistent and precise [86]. However, translation into maths is often difficult, time-consuming to write and comprehend and does not always fit the problem. For example, geo-metrical axioms are easily representable through mathematical equa-tions but a simple diagram can be faster to understand and remember. Whether illustration and graphical representation enriches or detracts from maths is a debate of philosophical consequence out of scope for us here (see [59]). We make the assumption that graphical representa-tion can facilitate people’s understanding of problems and data. The existence of early illustrations in science [42], and of InfoVis as a field can be considered a form of support for this position.
Our findings suggest that forcing people to use new graphical repre-sentations for elements that are already well assimilated from maths, as in Figure 12, is probably unnecessary and, at worse, counterproductive; yet restricting ourselves to maths only is not a good option either, for the reasons in the previous paragraph, and because there are likely cognitive benefits that escape current mathematical representations. Among these are the benefits already highlighted by Margaret Burnett and others in the long history of the study of visual languages (e.g., [12, 13, 50, 55]), such as the higher dimensionality of visuals, which can lead to better concreteness, directness, explicitness and feedback. We also discuss visual indexing as another possible advantage in the next section.
8.2.3 Containers and Symbols vs Labels
The choice between a (textual)labeland agraphical containerto repre-sent a content abstraction (e.g., avariable) has interesting consequences in terms of visual language: alabelis a referent that exists in the domain of language (a name), whereas a box is a referent that exists mostly in the domain of space (the page). Both accomplish the same kind of work (a form of abstraction as defined in [35,52]: a way of representing multiple elements by hiding them behind a single referent) yet they require very different types of retrieval. In the case of a box, when someone needs to go back to it, they can remember the approximate location on the page and its shape/size/color, or follow arrows from where they are currently looking (if they know they are connected). Conversely, a text label can retrieved by phonological or conceptual memory, or by pattern matching the label text within the content of the page to find other references to the same label. We suspect that the different ways of retrieving elements can have important repercussions for the building and reading of these diagrams because the retrieval mechanism is a key part of cognition itself [5]. However, the exact impact and importance of retrieval within the representation process of is not well known and requires further study.
Unlike graphical containers,symbolswere used often in all expertise groups and for non-CS and CS more often thanlabels. Since text-based
labelsandsymbolscan fulfill the same functions, why do participants usesymbolsinstead of onlylabels? We see three possible advantages: First, ifsymbolsare only used to represent one concept, one part of problem language, or even a subset of elements, recognizing the symbol provides straightforward association to its function in the diagram. If instead we uselabelsfor virtually anything (e.g., to designate variables, containers, instances, sets), the reader will have to retrieve the function based on cues and context. For example, the author/reader of the diagram may have to remember the function of that object, or derive it from its use in context/syntax (e.g., acontainercannotbe same as
avariable), or from another hint in the meaning or form of thelabel
as inmatrixKnapsackObjects). This is often the case in text-based programming languages, and is sometimes addressed through color and fonts automatically changed by syntax highlighting. In our data set we did not find any instance of the use of color or any typographic (calligraphic) parameter for the purpose of differentiating PLs. Another example of the use of special symbols to designate function is inmaths, where vectors are often marked with an arrow on top, or the use of Greek letters, which might denote a particular type of variable (e.g., angles). Note that these graphical distinctions are not strictly necessary, but might provide cognitive advantages.
Second,symbolsare special types of glyphs, some easier to find on a visual search due to pre-attentive processing [84, p.152], [85]), as opposed to uniform-looking textlabels. Although one could argue that visual search does not matter when specifying a problem description, we believe, from our observation of the participants, that going back and forth between the different areas of the page (or pages) is common enough for this to have an impact (see also arguments that present marks on paper as a key part of the cognitive process [5, 15]).
Third, participants might like representing some objects in a more literal way. Turning asymbolinto an icon (e.g., using a stick person figure to represent a person in the problem) establishes a more direct link between the significant and the signifier (see, e.g., Non-CS 10,2 in Figure 2). This, in turn, might facilitate thinking about the problem by bringing it closer to a familiar situation through analogy [22].
It is important to remark that the use ofsymbolsto denote a particular type of elements in the page also has an input and cognitive cost that increases with the number of special symbols or categories of symbols used. Most ad hoc symbols will take longer to create and to redraw (the nice simple shapes are, for the most part, already taken by letters and maths) and some energy to remember and keep consistent.
This might be the reason why we found that the CS and CP groups usedsymbolsless, with three CP participants never using symbols. People with a more formal expertise in the programming area are constrained to labels in their daily practice, and might have developed strategies to cope with the ambiguity.
8.2.4 Graphical Abstraction, Deduction, Induction and Solving
During the analysis it became evident that one of the difficulties of visual representation is that abstraction and some actions and relation-ships are hard to represent graphically. For example, it is hard to find effective visual representations for a structure (e.g., agrid) that has a variable number of columns or rows. A similar problem appears when trying to represent some constraints (for which our participants often resorted totext), or when representing procedures, sequences, repetition or recursion. This does not mean that it is impossible to graphically represent those (e.g., Figure 13). Stenning and Oberlander [73] discuss a similar problem in the context of Euler diagrams; graphical represen-tations make complex structures concrete and explicit, which makes them easier to acquire and process, yet this involves a tradeoff with the ability to represent multiple alternatives through abstraction.
[image:11.612.323.566.232.481.2]2 < 4 5 > 2 2 = 2 2 < 5 5 > 1 2 = 2
Fig. 13. Example of variable size representation in a matrix grid.
In 7.7 we described how participants generally start with the abstract and general parts of the problem representation and then become spe-cific (examples), often going back and forth. Although our observations are undoubtedly affected by how problems were formulated in our em-pirical design, the evidence suggests that processes are not exclusively bottom-up or top-down, but a combination of the two, often with several iterations. In other words, it would be inaccurate to assess the process that participants go through as entirely inductive or deductive.
Anecdotally, we have seen this when teaching constraint program-ming. Constraint programs (models) are very abstract; before one can get to a final model of the problem one might need to understand spe-cific cases (this is particularly true for novices). Thus we suspect that,
although most current tools to solve constraint problems seem appropri-ate for describing the final formulation of the problem, they may not be ideal to support the process of building and understanding it. Tools that support people’s complex and non-linear thought processes have the potential to increase their effectiveness, especially when learning. This “constructive” approach showed benefits in other areas of visualization (e.g., [32, 51]).
A related issue is description vs. solving of problems. Although tex-tual constraint programming languages are considered declarative (as opposed to imperative), we observed that many participants describe problems procedurally (e.g., CS 2 in Figure 14). This might be an important source of friction between how people naturally think about problems and how most current constraint programming languages work, and therefore an opportunity to improve constraint modeling learning and make it more accessible. Nevertheless, we note that con-straint programming is inherently declarative and integrating procedural elements requires further research in constraint solvers.
CS 2,2
CS 10,2 Fig. 14.Word cryptosolved through procedure: definecontainersand instances, assignvariable, defineinstance, consider next value.
CS 2,2
[image:11.612.321.565.515.712.2]CS 10,2
[image:11.612.142.214.569.603.2]