Measuring Feature Diversity in Native Language Identification
Shervin Malmasi
Centre for Language Technology Macquarie University Sydney, NSW, Australia
Aoife Cahill
Educational Testing Service 660 Rosedale Rd Princeton, NJ 08541, USA
Abstract
The task of Native Language Identification (NLI) is typically solved with machine learn-ing methods, and systems make use of a wide variety of features. Some preliminary studies have been conducted to examine the effective-ness of individual features, however, no sys-tematic study of feature interaction has been carried out. We propose a function to mea-sure feature independence and analyze its ef-fectiveness on a standard NLI corpus.
1 Introduction
Researchers in Second Language Acquisition (SLA) investigate the multiplex of factors that influence our ability to acquire new languages and chief among these is the role of the learner’s mother tongue. This core factor has recently been studied in the task of Native Language Identification (NLI), which aims to infer the native language (L1) of an au-thor based on texts written in a second language (L2). Machine Learning methods are usually used to identify language use patterns common to speak-ers of the same L1 (Tetreault et al., 2012). While NLI has applications in security, most research has a strong linguistic motivation relating to language teaching and learning. In this context, by identifying L1-specific language usage and error patterns, NLI can be used to better understand SLA and develop teaching methods, instructions and learner feedback that is tailored to their mother tongue (Malmasi and Dras, 2014b).
Although researchers have employed tens of fea-ture types, no effort has been made to measure the overlap of information they capture. Results from previous studies show that while some feature types yield similar accuracies independently, combining them can improve performance (Brooke and Hirst,
2012). This indicates that the information they cap-ture is diverse, but how diverse are they and how can we measure the level of independence between the feature types?
This is a question that has not been tackled in NLI, despite researchers having examined numerous fea-ture types to date. We examine one approach to mea-suring the degree of diversity between features and perform several analyses based on the results.
2 Data and Methodology
We use the TOEFL11corpus (Blanchard et al., 2013)
released with the 2013 NLI shared task (Tetreault et al., 2013). It includes12,100learner texts from11 L1 groups, divided into train, dev. and test sets.
We use a linear Support Vector Machine1to
per-form multi-class classification in our experiments. We experiment with a wide range of previ-ously used syntactic and lexical features: Adap-tor Grammars (AG) (Wong et al., 2012), charac-ter n-grams (Tsur and Rappoport, 2007),2
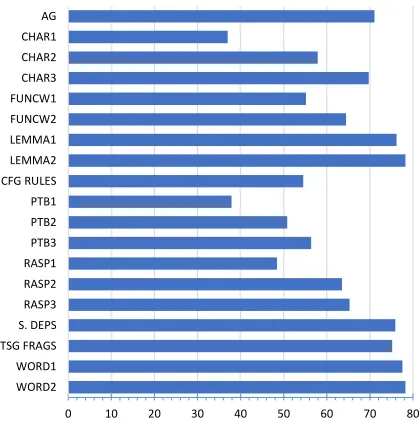
Func-tion word unigrams and bigrams (Malmasi et al., 2013), Lemma and Word n-grams, CFG Produc-tion Rules (Wong and Dras, 2011), Penn Tree-bank (PTB) part-of-speechn-grams, RASP part-of-speechn-grams (Malmasi et al., 2013), Stanford De-pendencies with POS transformations (Tetreault et al., 2012), and Tree Substitution Grammar (TSG) fragments (Swanson and Charniak, 2012). The in-dividual feature accuracies3are shown in Figure 1.4
1We use LIBLINEAR. Additional preliminary experiments with alternative learners yielded similar results.
2We treat charactern-grams as lexical features in this work but restrict our investigation to 1–3-grams. Recent work has also shown improvements from longer sequences (Jarvis et al., 2013; Ionescu et al., 2014).
3Obtained by training on the TOEFL11train and develop-ment sets and evaluating on the test set.
4Listed in alphabetical order.
0 10 20 30 40 50 60 70 80 WORD2
[image:2.612.81.291.52.263.2]WORD1 TSG FRAGS S. DEPS RASP3 RASP2 RASP1 PTB3 PTB2 PTB1 CFG RULES LEMMA2 LEMMA1 FUNCW2 FUNCW1 CHAR3 CHAR2 CHAR1 AG
Figure 1: Individual classification accuracy for each one of our features on the TOEFL11test set.
3 Measuring Feature Diversity
An ablation study is a common approach in machine learning that aims to measure the contribution of each feature in a multi-component system. This ab-lative analysis is usually carried out by measuring the performance of the entire system with all com-ponents (i.e.features) and then progressively remov-ing the components one at a time to measure how the performance degrades.5
While useful for estimating the potential contri-bution of a component, this type of analysis does not directly inform us about the pairwise relation be-tween any two given components. This shortcoming has been noted by other researchers,e.g.Wellner et al. (2009, p. 122), and highlights the need to quan-tify the overlap between any two given components in a system. Our approach to quantifying the diver-sity between two feature types is based on measuring the level of agreement between the two for predict-ing labels on the same set of documents. Here, we aim to examine feature differences by holding the classifier parameters and data constant.
Past research suggests that Yule’s Q-coefficient statistic (Yule, 1912) is a useful measure of pair-wise dependence between two classifiers (Kuncheva et al., 2003). This notion of dependence relates to complementarity and orthogonality, and is an impor-tant factor in combining classifiers (Lam, 2000).
Yule’s Q statistic is a correlation coefficient for binary measurements and can be applied to
classi-5Other variations exist, e.g. compare Richardson et al. (2006) and Wellner et al. (2009)
fier outputs for each data point where the output val-ues represent correct (1) or incorrect (0) predictions made by that learner. Each classifierCi produces a
result vectoryi = [yi,1, . . . , yi,N]for a set ofN
doc-uments whereyi,j = 1ifCi correctly classifies the jth document, otherwise it is0. Given these output
vectors from two classifiersCi andCk, a2×2
con-tingency table can be derived, as shown in Table 1.
CkCorrect CkWrong CiCorrect N11 N10
CiWrong N01 N00
Table 1: Contingency table for two classifiers.
Here N11 is the frequency of items that both
classifiers predicted correctly,N00where they were
both wrong, and so on. The Q-coefficient for the two classifiers can then be calculated as:
Qi,k = N
11N00−N01N10 N11N00+N01N10.
This distribution-free association measure6 is
based on taking the products of the diagonal cell fre-quencies and calculating the ratio of their difference and sum. Q ranges between −1 to+1, where −1 signifies negative association,0indicates no associ-ation (independence) and+1means perfect positive correlation (dependence).
Here our classifiers are always of the same type, a linear SVM, but they are trained with different fea-tures on the same data, allowing us to measure the dependence between feature types themselves.
4 Results
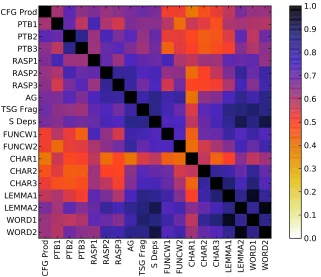
The matrix of the Q-coefficients for all features is shown graphically in Figure 2. The most discernible feature is the red cluster in the bottom left of the matrix. This region covers the correlations between syntactic and lexical features, showing that they dif-fer the most.
Another interesting aspect is the strong correla-tions between the lexical features, shown by the clustering of high values in the bottom right corner. It also shows that charactern-grams capture similar information to word unigrams and bigrams. Even character unigrams – the lowest performing lexical feature – show much stronger dependence with word unigrams than other syntactic features. Addition-ally, the high values in the bottom middle section
CFG Prod
PTB1 PTB2 PTB3 RASP1 RASP2 RASP3
AG
TSG Frag
S Deps FUNCW1 FUNCW2 CHAR1 CHAR2 CHAR3 LEMMA1 LEMMA2 WORD1 WORD2
CFG Prod
PTB1
PTB2
PTB3
RASP1
RASP2
RASP3
AG
TSG Frag
S Deps
FUNCW1
FUNCW2
CHAR1
CHAR2
CHAR3
LEMMA1
LEMMA2
WORD1
WORD2
0.0
[image:3.612.149.470.54.331.2]0.1
0.2
0.3
0.4
0.5
0.6
0.7
0.8
0.9
1.0
Figure 2: The Q-coefficient matrices of our feature set. The matrices are displayed as heat maps.
of the matrix show that Stanford Dependencies and TSG fragments largely capture the same information as Word and Lemma bigrams. These issues are ex-plored further in§5.
In contrast to the lexical features, the syntactic ones show much lower inter-correlation levels, ev-idenced by lower values in the top left corner and absence of a visible cluster. This seems to indicate that there is greater diversity among these features.
Such analyses can help us better understand the linguistic properties of features and guide interpre-tation of the results. This knowledge can also be useful in creating classifier ensembles. One goal in creating such committee-based classifiers is the identification of the most diverse independent learn-ers and this method can be applied to that end. To assess this, we also measure the accuracy for all171 possible feature pair combinations fi andfj in our
feature set. Each pair is combined in a weighted sum ensemble classifier (Malmasi et al., 2013) and run against the TOEFL11test set. For each pair we
also calculate the relative increase over only using the more accurate feature of the two;7this measures
7The relative increase is defined as:
Accuracyfi+fj −max(Accuracyfi, Accuracyfj)
An alternative metric here for this could be the “Oracle” base-line used by Malmasi et al. (2015).
-10 -5 0 5 10
0.4 0.5 0.6 0.7 0.8 0.9 1
Inc
re
ase
in A
cc
ur
ac
y
(%)
Q-coefficient
Figure 3: Scatterplot of the Q-coefficient vs relative in-crease in accuracy for all171feature pairs.
the net effect of combining the two: positive for im-provements and negative for degradation.
The increase for each pair is compared against the Q-coefficient, and Pearson’s correlation for the two variables shows a medium, statistically significant negative correlation (r=−.303,p=.000). A scat-terplot is shown in Figure 3, where we observe that almost all feature pairs withQ < 0.5yielded a net increase while many pairs withQ > 0.6resulted in performance degradation.
[image:3.612.315.537.365.506.2]Dependencies Word Unigrams Word Bigrams 1 Skip Bigrams 2 Skip Bigrams 3 Skip Bigrams
Dependencies
Word Unigrams
Word Bigrams
1 Skip Bigrams
2 Skip Bigrams
3 Skip Bigrams
[image:4.612.81.298.52.242.2]0.0 0.1 0.2 0.3 0.4 0.5 0.6 0.7 0.8 0.9
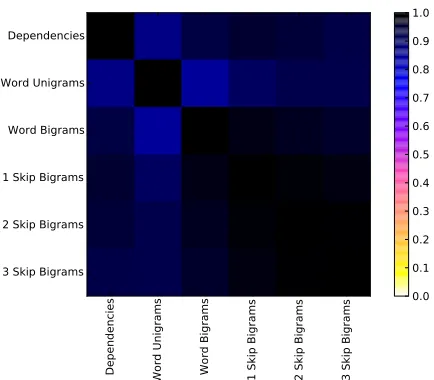
Figure 4: The Q-coefficient matrix for dependencies, wordn-grams and skip-grams.
diversity itself cannot be the sole criterion for fea-ture selection; a weak feafea-ture such as character uni-grams will be very diverse to a strong one like POS
n-grams but this does notipso factomake it a good feature and we must also consider accuracy.
5 Analyzing Words and Dependencies
Grammatical dependencies have been found to be a very useful NLI feature and thought to capture a “more abstract representation of syntactic struc-tures” (Tetreault et al., 2012; Bykh and Meurers, 2014). Accordingly, we were initially surprised to find the high correlation between dependencies and word bigrams (Q = 0.93). However, this relation may not be unexpected after all.
One source of supporting evidence comes from examining dependency distances. Using English data,8 Liu (2008) reports a Mean Dependency
Dis-tance (MDD) of2.54with51%of the dependencies being adjacent and thus also captured by word bi-grams. This also suggests that we can capture more of this information by considering non-adjacent to-kens. We test this hypothesis by usingk-skip word bigrams (Guthrie et al., 2006) as classification fea-tures, withk= 1–3.
The 1-skip bigrams yield an accuracy of 79.3%
on the TOEFL11 test set, higher than either word
bigrams or Stanford Dependencies. The 2- and 3-skip grams achieve78.4%and77.9%. The matrix of Q-coefficients for these features is shown in Fig-ure 4, showing that the1-skip word bigrams feature is the closest to the dependencies feature with a
Q-8120k sentences averaging21tokens each.
coefficient of0.96. It is also the closest to standard word unigrams and bigrams with Q-coefficients of
0.91and0.97, respectively.
These results suggest that skip-grams are a very useful feature for NLI.9 They could also be used
as a substitute for dependencies in scenarios where running a full parser may not be feasible, e.g. real-time data processing. Moreover, with NLI being in-vestigated with other languages (Malmasi and Dras, 2014a), this feature can be a good approximation of the dependencies feature for low-resourced lan-guages without an accurate parser. However, re-sults may vary by language and possibly genre (Liu, 2008). We also note that the skip-gram feature space grows prodigiously askincreases.
Another related issue is whether sub-lexical char-acter n-grams are independent of word features. Previously, Tsur and Rappoport (2007) hypothe-sized that these n-grams are discriminative due to writer choices “strongly influenced by the phonol-ogy of their native language”. Nicolai and Kon-drak (2014) also investigate the source of L1 dif-ferences in the relative frequencies of character bi-grams. They propose an algorithm to identify the most discriminative words and subsequently, the bi-grams corresponding to these words. They found that removing a small set of highly discriminative words greatly degrades the accuracy of a bigram-based classifier. Based on this they conclude that bi-grams capture differences in word usage and lexical transfer rather than L1 phonology. Evidence from our analysis also points to a similar pattern with the predictions of character bigrams and trigrams being strongly correlated with word and lemma unigrams. Such lexical transfer effects have been previously noted by others (Odlin, 1989). The effects are me-diated not only by cognates and word form similar-ities, but also semantics and meanings. We also ex-amine the link between L1 and word usage.
Using the Etymological WordNet10 database (de
Melo, 2014), we extracted two lists of English words with either Old English (508words) or Latin origins (1,310words). These words were used as unigram features to train two classifiers. The F1-scores for classification on TOEFL11 are shown in Figure 5.
The Old English words, with their West Germanic roots, yield the best results for classifying German data. Conversely, the Latinate features achieve the
9Hladka et al. (2013) and Henderson et al. (2013) previ-ously used a skip-gram variant that did not include0skips as per (Guthrie et al., 2006) and did not improve accuracy.
0 0.05 0.1 0.15 0.2 0.25 0.3 0.35 0.4
[image:5.612.80.292.54.183.2]ARA CHI FRE GER HIN ITA JPN KOR SPA TEL TUR Old English Word Features Latin Word Features
Figure 5: F1-scores for classifying L1 using English words with Old English or Latin origins.
ROOT
S
.
. VP
PP
NP
NN
dog JJ
lazy DT
the IN
over VBD
jumped NP
NN
fox JJ
brown JJ
quick DT
The
ROOT Ȳ S S Ȳ NP VP . NP Ȳ DT JJ JJ NN PP Ȳ IN NP VP Ȳ VBD PP NP Ȳ DT JJ NN Production Rules Extracted from Tree:
Figure 6: A constituent parse tree for an example sen-tence along with the context-free grammar production rules which can be extracted from it.
best results for Italian followed by French, both lan-guages descended from Latin.
This experiment, albeit limited in scope, provides some empirical evidence suggesting that small sets of words can capture lexical transfer effects poten-tially mediated by L1 similarity and cognates.
6 Parent-Annotated CFG Rules
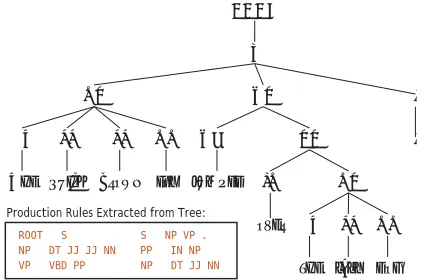
As demonstrated by our results, CFG production rules are a diverse syntactic feature with good ac-curacy. This feature type is processed by first gener-ating constituent parses for each sentence and then extracting its production rules,11 excluding
lexical-izations. Each rule is then used as a feature. Figure 6 illustrates this with an example tree and its rules. They have been successfully used in NLI (Wong and Dras, 2011) and in this section we experiment with a new extension of this feature type previously not applied to NLI.
Parent-annotated PCFG models have previously been applied in parsing and shown to yield improved
11These are the phrase structure rules used to generate con-stituent parts of sentences, such as noun phrases.
ROOT → S^<ROOT> S^<ROOT>→ NP^<S> VP^<S> .
NP^<S> → DT JJ JJ NN
VP^<S> → VBD PP^<VP> PP^<VP> → IN NP^<PP>
[image:5.612.80.292.225.365.2]NP^<PP> → DT JJ NN
Figure 7: Parent-annotated CFG rules from Fig. 4. results over other models (Johnson, 1998). In this experiment we apply this feature to NLI and eval-uate whether it can provide any improvement over standard production rule models.
This feature involves a modification of the lin-guistic tree representation, appending the category of each node’s parent as additional contextual in-formation (Johnson, 1998, p. 623). This transfor-mation can be described as adding “pseudo context-sensitivity” (Charniak and Carroll, 1994). Figure 7 shows the parent-annotated CFG rule features ex-tracted from the tree shown in Figure 6.
Testing this feature on the TOEFL11 test set, we
achieve an accuracy of 55.6%, a +1.3% increase over the standard CFG rules feature. Analyzing fea-ture diversity, we observe a Q-coefficient of0.92 be-tween the two CFG rule based features. These re-sults show that parent annotation leads to a sizeable increase in accuracy and also a notable change in di-versity levels.
Although these initial results suggest that this is a useful feature, more testing with other data can help determine if these patterns hold across corpora (Malmasi and Dras, 2015). This additional informa-tion could also help in other tasks such as language transfer hypothesis formulation (Malmasi and Dras, 2014b) through the examination of more specific en-vironmental contexts for features.
We leave to future work the investigation of im-proved ensemble classifiers that would be informed by the results of this study. The exploration of other linguistic tree representations and transformations, including Chomsky Normal Form, is another avenue for future work.
7 Conclusion
Acknowledgments
We would like to thank the anonymous reviewers for their helpful comments. We would also like to thank Keelan Evanini, Yoko Futagi and Jidong Tao for their thoughtful suggestions for improving this work.
References
Daniel Blanchard, Joel Tetreault, Derrick Higgins, Aoife Cahill, and Martin Chodorow. 2013. TOEFL11: A Corpus of Non-Native English. Technical report, Ed-ucational Testing Service.
Julian Brooke and Graeme Hirst. 2012. Robust, Lexical-ized Native Language Identification. InProceedings of COLING 2012, pages 391–408, Mumbai, India, De-cember. The COLING 2012 Organizing Committee. Serhiy Bykh and Detmar Meurers. 2014. Exploring
Syntactic Features for Native Language Identification: A Variationist Perspective on Feature Encoding and Ensemble Optimization. In Proceedings of COLING 2014, the 25th International Conference on Compu-tational Linguistics: Technical Papers, pages 1962– 1973, Dublin, Ireland, August. Dublin City University and Association for Computational Linguistics. Eugene Charniak and Glenn Carroll. 1994.
Context-sensitive statistics for improved grammatical language models. InAAAI, pages 728–733.
Gerard de Melo. 2014. Etymological wordnet: Trac-ing the history of words. InProceedings of the Ninth International Conference on Language Resources and Evaluation (LREC-2014). European Language Re-sources Association (ELRA).
David Guthrie, Ben Allison, Wei Liu, Louise Guthrie, and Yorick Wilks. 2006. A Closer Look at Skip-gram Modelling. InProceedings of the Fifth International Conference on Language Resources and Evaluation (LREC 2006), pages 1222–1225, Genoa, Italy. John Henderson, Guido Zarrella, Craig Pfeifer, and
John D. Burger. 2013. Discriminating Non-Native English with 350 Words. InProceedings of the Eighth Workshop on Innovative Use of NLP for Building Edu-cational Applications, pages 101–110, Atlanta, Geor-gia, June. Association for Computational Linguistics. Barbora Hladka, Martin Holub, and Vincent Kriz. 2013.
Feature Engineering in the NLI Shared Task 2013: Charles University Submission Report. In Proceed-ings of the Eighth Workshop on Innovative Use of NLP for Building Educational Applications, pages 232– 241, Atlanta, Georgia, June. Association for Compu-tational Linguistics.
2014. Can characters reveal your native language? A language-independent approach to native language identification. InProceedings of the 2014 Conference on Empirical Methods in Natural Language Process-ing (EMNLP), pages 1363–1373, Doha, Qatar, Octo-ber. Association for Computational Linguistics. Scott Jarvis, Yves Bestgen, and Steve Pepper. 2013.
Maximizing Classification Accuracy in Native Lan-guage Identification. In Proceedings of the Eighth Workshop on Innovative Use of NLP for Building Edu-cational Applications, pages 111–118, Atlanta, Geor-gia, June. Association for Computational Linguistics. Mark Johnson. 1998. PCFG models of
linguis-tic tree representations. Computational Linguistics, 24(4):613–632.
Ludmila I Kuncheva, Christopher J Whitaker, Cather-ine A Shipp, and Robert PW Duin. 2003. Limits on the majority vote accuracy in classifier fusion.Pattern Analysis & Applications, 6(1):22–31.
Louisa Lam. 2000. Classifier combinations: implemen-tations and theoretical issues. In Multiple classifier systems, pages 77–86. Springer.
Haitao Liu. 2008. Dependency distance as a metric of language comprehension difficulty. Journal of Cogni-tive Science, 9(2):159–191.
Shervin Malmasi and Mark Dras. 2014a. Chinese Native Language Identification. Proceedings of the 14th Con-ference of the European Chapter of the Association for Computational Linguistics.
Shervin Malmasi and Mark Dras. 2014b. Language Transfer Hypotheses with Linear SVM Weights. In
Proceedings of the 2014 Conference on Empirical Methods in Natural Language Processing (EMNLP), Doha, Qatar, October. Association for Computational Linguistics.
Shervin Malmasi and Mark Dras. 2015. Large-scale Na-tive Language Identification with Cross-Corpus Eval-uation. InProceedings of NAACL-HLT 2015, Denver, Colorado, June. Association for Computational Lin-guistics.
Shervin Malmasi, Sze-Meng Jojo Wong, and Mark Dras. 2013. NLI Shared Task 2013: MQ Submission. In
Proceedings of the Eighth Workshop on Innovative Use of NLP for Building Educational Applications, pages 124–133, Atlanta, Georgia, June. Association for Computational Linguistics.
Garrett Nicolai and Grzegorz Kondrak. 2014. Does the phonology of L1 show up in L2 texts? In Proceed-ings of The 52nd Annual Meeting of the Association for Computational Linguistics (ACL), pages 854–859. Terence Odlin. 1989. Language Transfer: Cross-linguistic Influence in Language Learning. Cambridge University Press, Cambridge, UK.
Matthew Richardson, Amit Prakash, and Eric Brill. 2006. Beyond PageRank: machine learning for static ranking. InProceedings of the 15th international con-ference on World Wide Web, pages 707–715. ACM. Benjamin Swanson and Eugene Charniak. 2012.
Na-tive Language Detection with Tree Substitution Gram-mars. InProceedings of the 50th Annual Meeting of the Association for Computational Linguistics (Vol-ume 2: Short Papers), pages 193–197, Jeju Island, Ko-rea, July. Association for Computational Linguistics. Joel Tetreault, Daniel Blanchard, Aoife Cahill, and
Mar-tin Chodorow. 2012. Native Tongues, Lost and Found: Resources and Empirical Evaluations in Na-tive Language Identification. InProceedings of COL-ING 2012, pages 2585–2602, Mumbai, India, Decem-ber. The COLING 2012 Organizing Committee. Joel Tetreault, Daniel Blanchard, and Aoife Cahill. 2013.
A Report on the First Native Language Identification Shared Task. InProceedings of the Eighth Workshop on Innovative Use of NLP for Building Educational Applications, pages 48–57, Atlanta, Georgia, June. Association for Computational Linguistics.
Oren Tsur and Ari Rappoport. 2007. Using Classifier Features for Studying the Effect of Native Language on the Choice of Written Second Language Words. InProceedings of the Workshop on Cognitive Aspects of Computational Language Acquisition, pages 9–16, Prague, Czech Republic, June. Association for Com-putational Linguistics.
Ben Wellner, James Pustejovsky, Catherine Havasi, Anna Rumshisky, and Roser Sauri. 2009. Classification of discourse coherence relations: An exploratory study using multiple knowledge sources. InProceedings of the 7th SIGdial Workshop on Discourse and Dialogue, pages 117–125. Association for Computational Lin-guistics.
Sze-Meng Jojo Wong and Mark Dras. 2011. Exploiting Parse Structures for Native Language Identification. In Proceedings of the 2011 Conference on Empiri-cal Methods in Natural Language Processing, pages 1600–1610, Edinburgh, Scotland, UK., July. Associa-tion for ComputaAssocia-tional Linguistics.
Sze-Meng Jojo Wong, Mark Dras, and Mark Johnson. 2012. Exploring Adaptor Grammars for Native Lan-guage Identification. InProc. Conf. Empirical Meth-ods in Natural Language Processing (EMNLP), pages 699–709.