http://www.scirp.org/journal/ijaa ISSN Online: 2161-4725 ISSN Print: 2161-4717
DOI: 10.4236/ijaa.2017.73014 Aug. 16, 2017 174 International Journal of Astronomy and Astrophysics
The Implications of the Sun’s Dragging Effect on
Gravitational Experiments
Jose L. Parra
Department of Physics, Florida International University, Miami, FL, USA
Abstract
Experimental determinations of Newton’s gravitational constant, Big G, have increased, in number and precision, during the last 30 years. There is, howev-er, a persistent discrepancy between various authors. After examining some literature proposing that the differences in Big G might be a function of the length of the day along the years, this paper proposes an alternative hypothe-sis in which the periodicity of said variation is a function of the relative peri-odicity of the Sun-Earth distance. The hypothesis introduced here becomes a direct application of the Kerr Metric that describes a massive rotating star. The Kerr solution for the equations of the General Theory of Relativity of Al-bert Einstein fits well with this relative periodicity and adequately predicts the arrangement of the experimental G values reported by sixteen different labor-atories. Also, the author explains how the Sun disturbs gravity on the surface of the Earth.
Keywords
Spinning Black Holes, Kerr’s Metric, General Relativity, Torsion Measurements, Gravitational Constant G, Precession
1. Introduction
One of the oldest constants in Physics, the constant G (commonly called Big G) that appears in Newton’s Law of Universal Gravitation, is the least precise value reported in official tables. In academia, this situation is justified by stating that the gravitational force is weak. The previous argument, however, is not justified if we consider the very precise experiments that had determined G in the last 30 years. Those results, however, show bar errors depicting a gap in error between scholars thus indicating that one, or more, systematic errors might be present. In 2015, Anderson, et al. [1] proposed a possible correlation between the observed How to cite this paper: Parra, J.L. (2017)
The Implications of the Sun’s Dragging Effect on Gravitational Experiments. Inter-national Journal of Astronomy and Astro-physics, 7, 174-184.
https://doi.org/10.4236/ijaa.2017.73014
Received: June 4, 2017 Accepted: August 13, 2017 Published: August 16, 2017
Copyright © 2017 by author and Scientific Research Publishing Inc. This work is licensed under the Creative Commons Attribution International License (CC BY 4.0).
DOI: 10.4236/ijaa.2017.73014 175 International Journal of Astronomy and Astrophysics experimental variations of G and the length of the day, which is known to have a period of 5.9 years as shown by the 2013 work of Holme and Viron [2]. Howev-er, in 2015, M. Pitkin [3] applying a Bayesian model, concluded that the previous period of around six years is not admissible when a complete table reported by Schlamminger et al. [4], is included in the analysis. Pitkin ran a function with an age ranging from two to eight years (logically covering the six-year periodicity) and showed no strong correlation between data and hypothesis. This letter in-troduces a simple model to solve this apparent variability in the experimental determination of the universal gravitational constant.
The author assumes that gravitational interactions do not obey the superposi-tion principle. That is, a third body can perturb the interacsuperposi-tion between two bo-dies (or parts of an extended body). This idea is not new in physics. Hawking and Rayner express in [5] that per the Mach’s principle, the “Local physical laws are determined by the large-scale structure of the universe”. In addition, Pugach
[6] reports extensive experimental work indicating that torsion balances are dis-turbed by the Sun’s activity. The work reported in this paper will be limited to create the connection between a well-established theory and the experimental data available. Also, the author will make an evaluation of the possible perturba-tive parameters that disturbs the determination of Big G.
2. Quantitative Characterization
2.1. Model
Let’s separate the experimental value of gravitational constant G [G(exp)] into the universal constant Big G and a perturbative effect δG(r) that is a function of the distance to the perturbative source. In other words, G(exp.) = G + δG(r). Considering that the Sun produces the next biggest gravitational field on Earth (only superseded by the Earth’s field) we can redefine the perturbation parame-ter δG(r) as expressed in Equation (1)
exp d
n
s
a
G G G
r
= +
, (1)
where a is the average separation between the Earth and the Sun, rS is the
in-stantaneous Earth-Sun distance, and dG is a gravitational range that must be founded. A combination of theory and experimental data will help to set the number n that is expected to be an integer power (with more probable values of 1, 2, 3 or 4).
The ratio a/rs was calculated using the monthly Earth-Sun distance reported by the
web page [7]. A table with the monthly Earth-Sun distance along a 19-year interval was prepared to fit in as a function of time. Equation (2) describes that variation where the variable t represents the time in years,
1 2π
1 cos 3.2
1.0 s
a r
e t
=
+ −
DOI: 10.4236/ijaa.2017.73014 176 International Journal of Astronomy and Astrophysics Equation (2) was made using astronomical data, and consequently, its para-meters are independent of our choice. Parapara-meters in Equation (2) are a unit base of 1, an amplitude of 0.017 that is the Earth’s orbital eccentricity e, a period of 1.0 year, and a negative initial phase of 3.2 rad.
The total perturbative influence of the planets and the Moon in G(exp) are too low in comparison with the contribution of the Sun. So, they were ignored in the calculations. However, to get seven significant figures in Big G, it will be neces-sary to include at least Jupiter.
2.2. Direct Observations of G
Over the last 30 years, a good number of experimental points with very precise results defining Big G’s value with six significant figures have been accumulated.
Figure 1 combines the experimental points of G(exp) from references [8]-[22]
and our function (1) using n = 2. (The yellow spot representing the Sun was off-set a little intentionally). The only two degrees of freedom that we have are the base value of the universal constant Big G and the value of the perturbative pa-rameter dG to minimize the difference between our function and the experi-mental data as much as possible. A minimum quadratic regression was used to better fit the experimental points up to six significant figures. The values of the universal constant G and the perturbative amplitude dG for this purpose is 6.65471 × 10⁻¹¹ Nm2∙kg−2 and 0.019372 × 10⁻¹¹ Nm2∙kg−2. The last two values
come from statistical data that is affected for more than one unnoticed effect; that means that the real values could be a little offset from those values that come from these experiments. This paper has the main intention to indicate the way to clean up that statistical error. Figure 1 shows the trajectory of the Earth (lower ellipse), the experimental points of Big G (closed circles), and our fitting model (upper ellipse). The biggest experimental G values occur around the pe-rihelion of the orbit and the lower values occur around the aphelion.
2.3. Influence of Big G on Terrestrial Gravity
An additional correlation between the author’s model and other parallel gravita-tional measurements connected indirectly with Big G is available. For example, the work done by Nicolas et al. [23] in Grasse, France shows the correlation.
Figure 2 has three parts that include: Nicolas et al. experimental points of abso-lute gravity, the paper model, and the experimental points of Big G [8]-[22] from 1998 to 2004.
DOI: 10.4236/ijaa.2017.73014 177 International Journal of Astronomy and Astrophysics
Figure 1. Plots of our Equation (1) and the experimental points from [8]-[22]. Points with same color come from same lab in
dif-ferent attempts. The x-axis and y-axis are in units of the Astronomical Unit a and the z-axis shows the values of Big G times ten the eleventh power in units of Nm2∙kg−2.
Figure 2. Plots of our Equation (1) (yellow) and some G(exp) points from 1998 to 2004 (points with horizontal error bars). The
[image:4.595.56.542.423.696.2]DOI: 10.4236/ijaa.2017.73014 178 International Journal of Astronomy and Astrophysics
3. Experimental Approach
The possible variation of the gravitational interaction between any two masses with the distance to the Sun is something relatively easy to corroborate in com-parison with the mathematical evaluation of that interaction. Besides that, the variation will not be easy to observe because those values could be many times smaller than the ambient noise if the apparatus is not carefully prepared.
The author’s setting included three variations to the Cavendish’s balance [24]. The main one is the introduction of two strings versus the one used by Caven-dish. The nine-millimeter separation of the two strings works like a mechanical filter that reduces the effect of weak perturbations with low duration of time. The second variation was the introduction of a microscope because the micro-scopic displacement of the balance’s iteration is stable enough to be observed. That happens because the change of the gravitational influence of the Sun is large enough in time. The microscopic motion output is digitally recorded on every trial. The observation was conducted every day approximately before su-nrise to give the balance enough time to clean out the noise coming from the human activity of the previous day.
The third improvement on the balance was the use of four masses in the form of a cone. That is the most effective form to produce the greatest gravitational interactions. The spherical masses are not the most effective, as is assumed by many scholars, because the mass of a body increases with radius but the distance between centers of masses decreases when the radius is squared. On a cone, if the cone’s vertex is keeping constant, the center of mass does not move if the size of the base is increased.
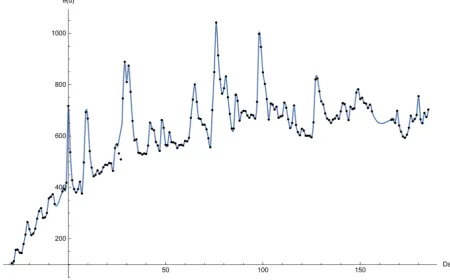
The experimental balance has a permanent state of vibration. The technique for this kind of situation is to accumulate enough data to find the average posi-tion and its standard deviaposi-tion. In this case, that method is not efficient. A better method is to record the two points that are farthest from the equilibrium point daily and represent both points in the graph. Of course, the size of the error bar of every point will fit inside the two points that were recorded. Figure 3 has the observations from December the 2nd to July the 4th. The negative slope on the
graph is matching well with the results reported over the last 30 years.
A bonus from Figure 3 is that the curve shows the superposition of two per-manent signals with an average repetition of around ten and six days respective-ly. Both periodicities can be explained if the nucleus of the Sun is a plasma torus that rotates with an angular momentum of value J. We can associate the ten days with a plasma torus precession of 20 days’ period and the six days with its nuta-tion. This idea is in correspondence with the visual information that the Sun’s equator is rotating with a period of approximately 25 days.
The General Theory of Relativity (GTR) of Albert Einstein [25] is the neces-sary tool to understand this problem. The solution of the GTR found by Kerr
DOI: 10.4236/ijaa.2017.73014 179 International Journal of Astronomy and Astrophysics following solution,
(
)
(
)
(
)
(
)
2
2 2 2 2 2
2
2 2
2 2
2 2
2
d 1 d , , , d
cos
, , , d , , , d , , , d d ,
GM r c
c c t A r M J r
J r
M c
B r M J C r M J D r M J c t
τ θ
θ
θ θ θ φ θ φ
= − − + − − + (3)
where the mass of the rotating body is M, and J is its angular momentum. The functions A, B, C, and D were introduced in (3) because these functions are not directly related to this paper. A consequence of the Kerr’s Metric is a dragging effect on the spin of any gyroscope localized inside the gravity field of the rotat-ing mass. It is interestrotat-ing that the draggrotat-ing effect cannot change the spin’s value of the gyroscope (even if the spin is zero) but generates the spin precession. The author observed in his non-rotating horizontal bar the precession effect stated by Kerr’s Metric as a variation of the azimuthal angle φ (see Figure 3) and the vertical angle θ (originally around 90 degrees; see Figure 4. It can be checked that Figure 3 and Figure 4 peaks coincide with each other in time.
The qualitative correspondence between theory and observation moves the author to do a quantitative analysis. Per the Kerr’s Metric, a gyroscope spinning inside the field of a rotating mass has a precession at the frequency [27],
(
)
22 5 3 J J
p
G
c ρ ρ
= ⋅ −
Ω ρ ρ , (4)
where G is the gravitational constant, J is the total angular moment of the rota-tion mass, c is the speed of light, and ρ is the distance to the dragging source. Starting from Equation (4) and the condition that the plane of rotation of the nuc-leus of the Sun almost coincides with the plane of the solar system allows us to calculate the Sun’s plasma torus velocity with the necessary relativistic equation,
(
)
3 23 2
1 1 0
4
pc GM R
α ρ Ω −β − + β =
, (5)
where R is the Sun’s plasma torus major radius, and α is the ratio of minor ra-dius to the major rara-dius (the value α comes close to 0.01 from the relativistic condition that the velocity of the plasma torus’s faster points must be smaller than the speed of light), M is the mass of the Sun, and ρ is the Earth-Sun dis-tance. The precession period of the Earth-axis of rotation is 26,000 years, and the core radius of the Sun is close to 280 million meters. Those numbers indicate that the speed of the Sun’s plasma torus is around 0.986216c.
The Sun’s static gravitational influence makes the Earth revolve around the Sun, and does not affect gravity on the Earth’s surface. However, the dragging gravitational effect of the Sun’s rotating nucleus is working here on Earth. We use the temporal part of Kerr’s solution to calculate an equivalent gravity com-ing from the draggcom-ing effect. The resultcom-ing equation is
2 2
2
dragging 4 2 cos
1 GMR g r β θ β ≈ −
DOI: 10.4236/ijaa.2017.73014 180 International Journal of Astronomy and Astrophysics
Figure 3. Azimuthal angle of the modified Cavendish’s balance on the y-axis. According to the Newton’s gravitational theory that
angle should be constant and should not have any oscillating pattern if the distance between the attracting masses is kept constant.
Figure 4. Variation of the microscopic angle between the horizontal plane and the vertical direction. According to Newton, that
[image:7.595.69.520.391.671.2]DOI: 10.4236/ijaa.2017.73014 181 International Journal of Astronomy and Astrophysics The author, correlating its experimental points with the result from [8]-[22], deduces that the Sun’s plasma torus plane of rotation makes an angle of 80 de-grees with the zenith of the solar system (nutation cover only 2 dede-grees). Apply-ing that angle in Equation (6), the gravity on Earth should oscillate annually be-tween 100 × 10−8 m/s2 and 92 × 10−8 m/s2. The difference between those numbers
(8 × 10⁻⁸ m/s2) is close to the 9 × 10⁻⁸ m/s2 annual variation of g in France,
re-ported by Nicolas et al. [23]. By now, the reader will know that the power of the inverse of the distance in our initial hypothesis becomes n = 3 per Equation (4). That inverse power is the same that appears in the tidal equation and that maybe is not a numerical coincidence. The analysis of that coincidence will also be dis-cussed in a following paper.
Figure 1 only has 20 points affected without control of the Sun’s dragging ef-fect. On the other hand, the author report here 185 well characterized points taken in the first six months of 2017. An increment in accuracy could be done by mixing both data. The axis of Figure 4 were converted with the functions,
(
day)
(
)
0.985 0.030 182 3 and 6.6695 0.0009 exp 0.0008
x= + N − G= + ϕ , (7)
where Nday represent the number of the day from January first to July fourth, x is a parameter without units that represent the distance to the Sun
(
x=r a)
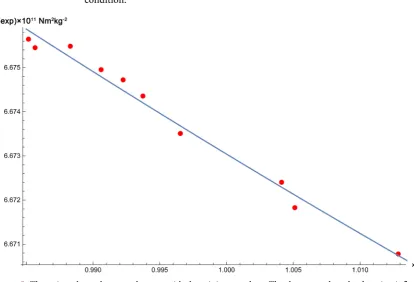
, and [image:8.595.122.537.421.703.2]φ is the balance’s microscopic deflection. The author selects the points with minimum deflection. The idea was to minimize as much as possible the influ-ence of the precession and the nutation effects. It is, for those points in Equation (8), the angle θ was close to 90 degrees. Figure 5 showed all the points under this condition.
Figure 5. The points shown here are the ones with the minimum values. That happens when the dragging
DOI: 10.4236/ijaa.2017.73014 182 International Journal of Astronomy and Astrophysics The Fit function from Wolfram Mathematica 11.1 reported the numbers,
(
)
(
)
( )
exp 3
2
11 2 2
3
d
0.0616 0.0031 1 9 cos
6.6114 0.0031 10 N m kg .
G
G G
x
x
θ − −
= +
± +
= ± + × ⋅ ⋅
(8)
4. Conclusions
The most influential labs in the world always turn toward the values of the fun-damental constants in physics. Not just for trustworthiness but also for safe comparison with the reliable values from other labs. The constant’s errors may not overlap; however, the scientific community expects those errors to be close to the same significant figure on every constant. That has not been happening to the gravitational constant Big G in the last 30 years. Some differences cover three orders of magnitude, far away from every error. The explanations proposed by now to solve this contradiction have not been established without reasonable doubt.
The author proposed that the experimental values of Big G will depend in-versely on some power of the distance to the Sun, and show an experimental work to test the hypothesis. Its experimental confirmation justifies the search for any theory that interconnects all the information available.
The author founded the mathematical explanation that covers all the points on the determination of Big G in the General Theory of Relativity under the as-sumption that the core of the Sun has the form and condition of a relativistic ro-tating plasma torus. The Sun’s core is massive enough to produce visible drag-ging effects here on Earth assuming its spin suffers precession and nutation.
DOI: 10.4236/ijaa.2017.73014 183 International Journal of Astronomy and Astrophysics
References
[1] Anderson, J.D., Schubert, G., Trimble, V. and Feldman, M.R. (2015)Measurements of Newton’s Gravitational Constant and the Length of Day. Europhysics Letters, 110, Article ID: 10002. https://doi.org/10.1209/0295-5075/110/10002
[2] Holme, R. and De, V.O. (2013)Characterization and Implications of Intradecadal Variations in Length of Day. Nature, 499, 202-204.
https://doi.org/10.1038/nature12282
[3] Pitkin, M. (2015)Comment on “Measurements of Newton’s Gravitational Constant and the Length of Day”. EPL, 110, Article ID: 10002.
http://arxiv.org/abs/1505.06725
[4] Schlamminger, S., Gundlach, J.H. and Newman, R.D. (2015) Recent Measurements of the Gravitational Constant as a Function of Time. Physical Review D, 91, Article ID: 121101. http://arxiv.org/abs/1505.01774
https://doi.org/10.1103/PhysRevD.91.121101
[5] Stephen, W. (1973) Hawking and George Francis Rayner Ellis, the Large-Scale Structure of Space-Time. Cambridge University Press, Cambridge, 1.
[6] Pugach, A. (2015) Diurnal Variations and Spikes by the Torsind Registered and Their Impact on the Accuracy of G Measurement. International Journal of Astro
-nomy and Astrophysics, 5, 28-37. https://doi.org/10.4236/ijaa.2015.51005
[7] https://www.timeanddate.com/sun/usa/miami?month=1&year=2017
[8] Quinn, T., Speake, C., Parks, H. and Davis, R. (2014)Improved Determination of G Using Two Methods. Physical Review Letters, 113, 3019-3023.
https://doi.org/10.1103/PhysRevLett.113.039901
[9] Rosi, G., Sorrentino, F., Cacciapuoti, L., Prevedelli, M. and Tino, G.M. (2014) Preci-sion Measurement of the Newtonian Gravitational Constant Using Cold Atoms.
Nature, 510, 518-521. https://doi.org/10.1038/nature13433
[10] Luther, G.G. and Towler, W.R. (1982)The Teaching of the Natural Sciences in Re-lation to Religious Concepts. Physical Review Letters, 48, 121-123.
https://doi.org/10.1103/PhysRevLett.48.121
[11] Bagley, C.H. and Luther, G.G. (1997)Preliminary Results of a Determination of the Newtonian Constant of Gravitation: A Test of the Kuroda Hypothesis. Physical Re-view Letters, 78, 3047. https://doi.org/10.1103/PhysRevLett.78.3047
[12] Hu, Z.K., Guo, J.Q. and Luo, J. (2005) Correction of Source Mass Effects in the HUST-99 Measurement of G. Physical Review D, 71, Article ID: 127505.
https://doi.org/10.1103/PhysRevD.71.127505
[13] Gundlach, J.H. and Merkowitz, S.M. (2000) Measurement of Newton’s Constant Using a Torsion Balance in Angular Acceleration Feedback. Physical Review Let-ters, 85, 2869-2872. https://doi.org/10.1103/PhysRevLett.85.2869
[14] Quinn, T.J., Speake, C.C., Richman, S.J., Davis, R.S. and Picard, A. (2001) A New Determination of Using Two Methods. Physical Review Letters, 87, Article ID: 111101. https://doi.org/10.1103/PhysRevLett.87.111101
[15] Kleinevoß, U. (2002) Bestimmung der Newtonschen Gravitationskonstanten G. Ph.D. Thesis, University of Wuppertal, Wuppertal.
[16] Armstrong, T.R. and Fitzgerald, M.P. (2003) New Measurements of G Using the Measurement Standards Laboratory Torsion Balance. Physical Review Letters, 91, Article ID: 201101. https://doi.org/10.1103/PhysRevLett.91.201101
[17] Parks, H.V. and Faller, J.E. (2010)Simple Pendulum Determination of the Gravita-tional Constant. Physical Review Letters, 105, Article ID: 110801.
DOI: 10.4236/ijaa.2017.73014 184 International Journal of Astronomy and Astrophysics
[18] Schlamminger, S., Holzschuh, E., Kundig, W., Nolting, F., Pixley, R.E., Schurr, J. and Straumann, U. (2006) A Measurement of Newton’s Gravitational Constant.
Physical Review D, 74, 19-20. https://doi.org/10.1103/PhysRevD.74.082001
[19] Quinn, T., Parks, H., Speake, C. and Davis, R. (2013)Improved Determination of G Using Two Methods. Physical Review Letters, 111, 3019-3023.
https://doi.org/10.1103/PhysRevLett.111.101102
[20] Luo, J., Liu, Q., Tu, L.C., Shao, C.G., Liu, L.X., Yang, S.Q., Li, Q. and Zhang, Y.T. (2009) Determination of the Newtonian Gravitational Constant G with Time-of- Swing Method. Physical Review Letters, 102, Article ID: 240801.
https://doi.org/10.1103/PhysRevLett.102.240801
[21] Karagioz, O. and Izmailov, V. (1996) Measurement of the Gravitational Constant with a Torsion Balance. Measurement Techniques, 39, 979-987.
https://doi.org/10.1007/BF02377461
[22] Newman, R., et al. (2014) A Measurement of G with a Cryogenic Torsion Pendu-lum. Philosophical Transactions of the Royal Society, 372, Article ID: 20140025. [23] Nicolas, J., Nocquet, J.M., Van Camp, M., Van Dam, T., Boy, J.P., Hinderer, J.,
Ge-gout, P., Calais, E. and Amalvict, M. (2006)Seasonal Effect on Vertical Positioning by Satellite Laser Ranging and Global Positioning System and on Absolute Gravity at the OCA Geodetic Station, Grasse, France. Geophysical Journal of the Royal As-tronomical Society, 167, 1127-1137.
https://doi.org/10.1111/j.1365-246X.2006.03205.x
[24] Cavendish, H. (1798) Experiments to Determine the Density of the Earth. Philo-sophical Transactions of the Royal Society of London, 88, 469-526.
https://doi.org/10.1098/rstl.1798.0022
[25] Einstein, A. (1916) Die Grundlage der Allgemeinen Relativitätstheorie. Annalen der Physik, 49, 769-822. https://doi.org/10.1002/andp.19163540702
[26] Kerr, R.P. (1963) Gravitational Field of a Spinning Mass as an Example of Algebra-ically Special Metrics. Physical Review Letters, 11, 237-238.
https://doi.org/10.1103/PhysRevLett.11.237
[27] Mashhoon, B., Gronwald, F. and Lichtenegger, H.I.M. (2001) Gravitomagnetism and the Clock Effect. Lecture Notes in Physics, 562, 83-108.
https://doi.org/10.1007/3-540-40988-2_5
Submit or recommend next manuscript to SCIRP and we will provide best service for you:
Accepting pre-submission inquiries through Email, Facebook, LinkedIn, Twitter, etc. A wide selection of journals (inclusive of 9 subjects, more than 200 journals)
Providing 24-hour high-quality service User-friendly online submission system Fair and swift peer-review system
Efficient typesetting and proofreading procedure
Display of the result of downloads and visits, as well as the number of cited articles Maximum dissemination of your research work
![Figure 1. Plots of our Equation (1) and the experimental points from the eleventh power in units of Nm[8]-[22]](https://thumb-us.123doks.com/thumbv2/123dok_us/1586093.704898/4.595.56.542.423.696/figure-plots-equation-experimental-points-eleventh-power-units.webp)