D S Sharma, R Sangal and J D Pawar. Proc. of the 11th Intl. Conference on Natural Language Processing, pages 223–231, Goa, India. December 2014. c2014 NLP Association of India (NLPAI)
Text Readability in Hindi: A Comparative Study of Feature
Performances Using Support Vectors
Manjira Sinha
Department of Computer
Science and Engineering
Indian Institute of Technology
Kharagpur
West Bengal, India
[email protected]
rnet.in
Tirthankar Dasgupta
Department of Computer
Science and Engineering
Indian Institute of
Technology Kharagpur
West Bengal, India
[email protected]
rnet.in
Anupam Basu
Department of Computer
Science and Engineering
Indian Institute of
Technology Kharagpur
West Bengal, India
[email protected]
rnet.in
Abstract
In this paper, we have presented support vector classification of Hindi text documents based on their reading difficulty. The study is based on diverse textual attributes over a broad spectrum to examine their extent of contribution in determining text readability. We have used support vector machines and support vector regressions to achieve our objective. At each step, the models are trained and tested on multiple combinations of text features. To achieve the goal, we have first built a novel readability annotated dataset of Hindi comprising of 100 documents ranked by 50 users. The outcomes of the models are discussed in context of text comprehensibility and are compared against each other. We have also provided a comparative analysis of our work with the existing literatures.
1
Introduction
Readability of a text indicates its reading or comprehension difficulty as perceived by a reader (Dale, 1949). Research on text readability has a vast and well developed literature; in the past century, numerous measures and approaches towards text readability has been developed (refer to (Benjamin, 2012) for a detailed survey). Consequently, it has been established that
readability is subjective to the corresponding language of the text; for this reason different metrics of readability has been developed in different languages (Rabin et al., 1988). Languages of India such as Hindi have vast characteristics differences from the Indo-European counterparts like English. Therefore, the widely used readability metrics for English have been observed to be not appropriate for determining the same property of Hindi texts (Sinha et al., 2012). Yet, despite the large user pool, till now very little have been achieved in analyzing reading difficulty in Hindi (see section 2).
In this paper, we have modeled Hindi text readability with support vector machines (SVM) and support vector regression (SVR). Using both SVM and SVR view the problem of text readability from two perspectives: as a classification problem for SVM and as an estimation problem for SVR. By far, the only definitive model to predict readability of a Hindi text has been proposed by Sinha et al. (2012). Their work is based on six syntactic and lexical parameters of a text and they have used least square regression technique for modeling. We have used a vast range of text features (a total of 20) from lexical, syntactic to discourse
perspective: among them, the six features from Sinha et al. (2012) have also been included. Therefore, our feature set consists of 14 „new‟ features and 6 „old‟ features (refer to section 3). We have explored the relative effect of the new
and old features in the context of text readability in Hindi as well as the performances of regression and support vector techniques.
The rest of the paper is organized as follows: section 2 presents a brief background on text readability in general and Hindi in specific; section 3 presents the annotated corpus preparation and justification behind the selection of features; section 4 describes results and analysis and finally we conclude our work in section 5.
2
Related Works
The quantitative analysis of text readability started with L.A. Sherman in 1880 (Sherman, 1893). Till date, English and other languages have got over 200 readability metrics (DuBay, 2004; Rabin et al., 1988).The existing quantitative approaches towards predicting readability of a text can be broadly classified into three categories (Benjamin, 2012):
Classical methods: they analyze the syntactic features of a text like sentence length, paragraph length etc. The examples are Flesch Reading Ease Score (Flesch, 1948), FOG index (Gunning, 1968), Fry graph (Fry, 1968), SMOG (McLaughlin, 1969) etc. The formulae do not take into account the background of the reader and the semantic features of the text such as whether the actual contents are making sense or not. Despite their shortcomings, these simple metrics are easy to calculate and provide a rough estimation of reading difficulty of a text provided.
Cognitively motivated methods: texts are analyzed based on the cognitive features like, cohesion, organization and users‟ background. Proposition and inference model (Kintsch and Van Dijk, 1978), prototype theory (Rosch, 1978), latent semantic analysis (Landauer et al., 1998), Coh-metrix (Graesser et al., 2004) are some
prominent members of this group. This group of models moves beyond the surface features of a text and try to measure objectively the different cognitive indicators associated with text and the reader. However, it has been observed that, many situations, some traditional indicators perform as well as the newer and more difficult versions (Crossley et al., 2007).
Statistical language modeling: This class of approaches incorporates the power machine learning methods to the field of readability. They are particularly useful in determining readability of web texts (Collins-Thompson and Callan, 2005; Collins-Thompson and Callan, 2004; Si and Callan, 2003) (Liu et al., 2004). SVM has been used to identify grammatical patterns within a text and classification based on it (Schwarm and Ostendorf, 2005; Heilman et al., 2008; Petersen and Ostendorf, 2009). Although, these methods sound promising, the problem is that they cannot act as standalone measure as they need an amount of training data for classifiers appropriate to a particular user group.
conceptual organisation. Sinha et al. (Sinha et al., 2012) have developed two readability formulae for Hindi texts using regression analysis. They have considered six structural or syntactic features of a text for the work. They have demonstrated that the English readability formulae such as Flesch Reading Ease Index, SMOG Index do not perform appropriately while being applied to Hindi documents. They have found the textual features like average word length, number of polysyllabic words and number of jukta-akshars (consonant conjuncts) in a text to be the most influential ones.
3
Annotated
Corpus
and
Feature
Selection
3.1 Data preparation
At present, by the best of our knowledge, there is no accessible resource pool of Hindi text documents that are annotated by multiple users according to their reading level, and are suitable for automatic processing. To address the issue, we have developed a corpus of 100 documents of length about 1000 words in Unicode encoding. The documents range from domain like literature to news and blogs. The distribution has been provided in table 1.
Source of text Number
Literary corpora_classical 13 Literary corpora_contemporay 12 News corpora_general news 13 News corpora_interview 13 Blog corpora_personal 12 Blog corpora_official 12 Article corpora_ scholar 13 Article corpora_general 12
Table1: Text details
For the present study, we have selected 50 out of the 100 texts. The documents were annotated by a group of 25 native users of Hindi. The participants have mean age of 23 years (standard deviation = 1.74); they all have similar educational background pursuing undergraduate or graduate studies and represents medium to low socio-economic background. Each participant was asked 2 questions:
1. “How easy was it for you to understand/comprehend the text?”
2. “How interesting was the reading to you? (here interesting refers to the document specific interest not the topic specific, we have assumed that the participants did not have any previous bias towards a particular topic)
They were to answer on a 10 point scale (1=easy, 10=very hard). One point worth to be mentioned here is that although the blog data sometimes contains emoticons and other non text parts, we have considered only the pure text for our analysis. However, we have retained the punctuation symbols for the cause of sentence segmentation, but we have treated all of them as equal.
3.1.1. Normalization of user data
Perception of difficulty of a text is quite subjective in nature. Some annotators perform strict scrutiny than the others, consequently the range of ratings used by different annotators vary. Therefore, instead of considering the absolute user rating, we have performed a step of user data normalization. From this point onwards, reference to user ratings by default means normalized ratings unless stated otherwise. Gaussian normalization (Resnick et al., 1994) technique has been to map each user data in the range [-1, 1]. This method takes into account two variations that occur when feedbacks from different individuals are collected over a topic: shift of average ratings of different users and different rating scale by different users. The normalization method works as:
𝑅 𝑦 𝑥 =
𝑅𝑦 𝑥 − 𝑅 𝑦
𝑅𝑦 𝑥 − 𝑅 𝑦 2 𝑥
𝑅 𝑦 𝑥 = normalized rating for item x by user y
𝑅𝑦 𝑥 = actual rating for item x by user y
𝑅𝑦
= average of ratings for user y
Inter-annotator reliability was measured through Krippendorff‟s alpha1
and 𝛼 = 0.81 was found. Therefore, we concluded that annotators agree more often than would have occurred by chance. We have measured the correlation between the outcomes of two questions corresponding to each of the fifty annotators; and found that in each case the correlation was greater than 0.8 (p < 0.05). Therefore, the questions can be considered as equivalent, and subsequently we have considered the rating for the first question as user input for our readability models. Against each text, the median of the user ratings was taken as the central tendency for further processing.
3.2 Feature set
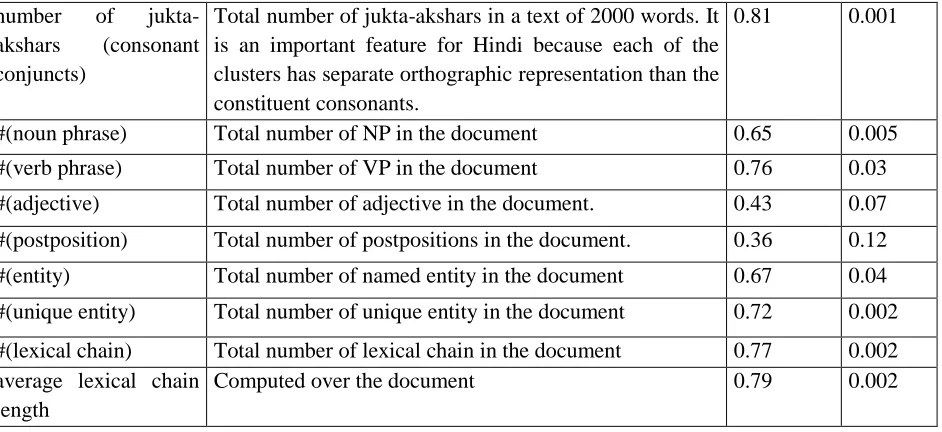
We have extracted 20 text features at different textual level (refer to table 2) to study their effect on reading difficulty. We have determined the textual features following the rationale:
Inferring form the cognitive load theory (Paas et al., 2003), we have assumed that the cognitive load exerted by a text on a reader depends on syntactic and lexical properties of a text like, average sentence length, average word length, number of polysyllabic words and as well as discourse features like the counts of the different parts of speeches and the number of co-references one has to resolve in order to comprehend the text. While processing a text a user has to parse the sentences in it and extract semantically relevant meaning from those sentences and the words. In order to process a sentence, one has to take into account the length of the sentence and types of words contained in it; it is also important to establish the connections or the nature of dependencies among the different words in a sentence. The role of a word is determined by its parts of speech and its way of use in that context; apart from it, the words can have varied complexity based on factors like their length, count of syllables. In the discourse level, a reader not only has to comprehend each sentence or paragraph, but also has to infer the
1
http://en.wikipedia.org/wiki/Krippendorff's_alpha
necessary co-references among them to understand the message conveyed by the text. The complexity of this task depends on the number of entities (noun, proper nouns) in the text and the way one entity is connected with other. To capture the effects of all these parameters in our readability models, we have considered text features over a broad range. The word features like average word length, average syllable per word, sentence features like average sentence length and discourse features like number of polysyllabic words, number of jukta-akshars (consonant conjuncts) have been calculated as stated by Sinha et al. (Sinha et al., 2012), as the features need customizations for Hindi. The calculations based on lexical chains have been followed from Galley and McKeown (Galley and McKeown, 2003).
4
Result and Analysis
4.1 Correlation coefficients (CC)
We have performed partial spearman rank correlation (Zar, 1998) between each of the features and user rating. The values are given in table 2 along with the feature descriptions. The values of correlation are divided in three groups: low (r<0.35), moderate (0.35<r<0.65), high (r>0.65); and test of significance by p>0.05 condition. Some observations that can be made from the results are:
Average sentence length has been considered as a strong predictor of text difficulty (Crossley et al., 2007), however, in our case although it has a moderate correlation with the user rating, the value is insignificant.
Average word length and number of consonant conjuncts have significant and high correlation with user data. This result is in tune with the study by Sinha et al. (2012).
Discourse features have altogether high correlation coefficients than sentence level features.
Discourse features like #(noun phrase), #(unique entity), #(verb phrase) have significant correlation.
Postpositions in both sentence and discourse contexts have insignificant effect on text comprehension.
Properties like lexical chain, which require a reader to establish connections among different
attributes of a concept and are indicators of text cohesion, have high and significant correlation.
4.2 Modeling the data
In the previous section, we have observed correlation of different text attributes with text features. But correlation does not provide a measure of causality. Therefore, to investigate
Feature Description CC (r) p value
word features
average word length Standard Hindi uses the Devanagari script which is of the style abugida; the consonants have an inherent vowel or vowel diacritic2, a consonant with the attached vowel, or an independent vowel is considered as a single visual unit. Average word length is total word length in terms of visual units divided by number of words.
0.75 0.01
average syllable per word
Total word length in terms of syllable divided by total number of words.
0.7 0.03
sentence features
average sentence length
Total sentence length in terms of words divided by number of sentence.
0.63 0.14
$(noun phrase) Average number of NP per sentence 0.46
$(verb phrase) Average number of VP per sentence 0.69 0.004
$(adjective) Average number of adjectives per sentence
$(postposition) Average number of postpositions per sentence. Hindi grammar has postpositions, instead of prepositions present in English. Unlike English, postpositions in Hindi do not belong to separate part of speech. The postpositions require their object noun to take possessive, objective or locative case. Suffixes act as the case markers.
0.34 0.21
$(entity) average number of named entity per sentence 0.73 0.007
$(unique entity) Average number of unique entity per sentence 0.52 0.07
$(clauses) Average number of clauses per sentence 0.73 0.003
discourse features
Number of
polysyllabic words and normalized measure for 30 sentences
Polysyllabic words are the words whose count of syllable exceeds 2.
0.71 0.004
2
number of jukta-akshars (consonant conjuncts)
Total number of jukta-akshars in a text of 2000 words. It is an important feature for Hindi because each of the clusters has separate orthographic representation than the constituent consonants.
0.81 0.001
#(noun phrase) Total number of NP in the document 0.65 0.005
#(verb phrase) Total number of VP in the document 0.76 0.03
#(adjective) Total number of adjective in the document. 0.43 0.07
#(postposition) Total number of postpositions in the document. 0.36 0.12
#(entity) Total number of named entity in the document 0.67 0.04
#(unique entity) Total number of unique entity in the document 0.72 0.002
#(lexical chain) Total number of lexical chain in the document 0.77 0.002 average lexical chain
length
[image:6.612.75.546.45.261.2]Computed over the document 0.79 0.002
Table 2: Details of the text features and their correlations with user rating.
how different features cause the comprehension difficulty of text to vary, we have used support vector machine (SVM) and support vector regression (SVR) modeling techniques. The reason behind using support vectors as tools of trade is to compare the outcomes with the regression analysis present in literature. The features have been used in three combinations. First they were divided in two categories i) comprising of only the six features used by Sinha et al. (2012) [they are termed as „old‟] and ii) second category consists of the rest 14 features and the group is termed „new‟; finally, third combination consists of all the features. Therefore, we have evaluated three different types of SVM and SVR models for each type of kernel.
We have employed a binary SVM classifier in this paper. Given a training set instance-class pairs (𝑥𝑖, 𝑦𝑖 ), i = 1…l, where 𝑥𝑖∈ 𝑅𝑛 and
𝑦 ∈ 1, −1 l , the general equation of a SVM is
(Manning et al., 2008):
1 2𝑤
𝑇
𝑤 + 𝐶 𝜉𝑖 𝑖
𝑖𝑠 𝑚𝑖𝑛𝑖𝑚𝑖𝑧𝑒𝑑,
𝑤 = 𝑤𝑒𝑖𝑔ℎ𝑡 𝑣𝑒𝑐𝑡𝑜𝑟, 𝐶
= 𝑟𝑒𝑔𝑢𝑙𝑎𝑟𝑖𝑧𝑎𝑡𝑖𝑜𝑛 𝑡𝑒𝑟𝑚 … (1)
𝑦𝑖 𝑤 𝑇
Φ 𝑥𝑖 + 𝑏 ≥ 1 − 𝜉𝑖,
𝜉𝑖 𝑠𝑙𝑎𝑐𝑘 𝑣𝑎𝑟𝑖𝑎𝑏𝑙𝑒
≥ 0 … (2)
Table 3: SVM results for different text features
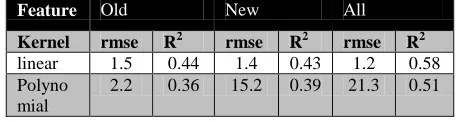
Table 3 and 4 present the SVM and SVR classification results for different combination of features. The classifications were evaluated for a number of SVM and SVR parameter
combinations and only the result corresponding to the most efficient one is presented.
Feature Old New All
Kernel rmse R2 rmse R2 rmse R2
linear 1.5 0.44 1.4 0.43 1.2 0.58 Polyno
mial
2.2 0.36 15.2 0.39 21.3 0.51
Table 4: SVR results for different text features
Table 5 provides a comparison between performances of three combinations of features. It can be seen that, both feature
Method R2 RMSE
First model proposed by Sinha et al. (2012): takes average word length and number of polysyllabic words
0.44 1.04
Second model proposed by Sinha et al. (2012): takes average word length and number of consonant conjuncts
0.36 0.81
Our models
SVM with three features 0.37 -
SVM with old features 0.44 -
SVM with all features 0.67 -
SVR with three features 0.28 1.3
SVR with old features 0.44 1.5
SVR with all features 0.58 1.2
Table 5: Comparison of our model predictions with existing literature
combinations (old and new) are comparable in terms of their prediction accuracy and explanatory power if taken one set at a time; however, if all the old and new features are used together, the performance and accuracy improves significantly. This is true for in case of SVM as well as for SVR. This observation indicates that to develop an efficient model for text readability prediction in Hindi, we need to take into account various types of text attributes such as part of speech features, sentential features, text cohesion and lexical aspects. Moreover, from the above tables it can also be inferred that binary classification using support vector machines yields better results than estimation of text difficulty using support vector regression, in terms of the goodness of fit. In addition, linear kernel was found to do better in all cases than polynomial kernel.
Now, we will compare the outcomes of our models with the outcomes reported by Sinha et al.(2012). For this comparison, we have also
evaluated SVM and SVR with only the three text features shortlisted by them as most influential in determining text difficulty. Table5 below presents the results (against SVM, only R2 values are provided), only linear kernels are compared for SVM and SVR.
From table 5, it can be inferred that support vector classification and support vector regression performs better in terms of the goodness of fit than linear regression models reported by Sinha et al. (2012). In a close comparison of two types of regression reveals that support vector regression performs poorly than linear regression when only three features are considered; performs comparably when the
old features are involved and do very well when all the features are incorporated. However, the root mean square errors of SVR are found to be slightly more than those by linear regression, for all the cases.
From the above results and discussions, we can state prediction of text readability in Hindi
Features Old New All
SVM parameters
C = 1; d = 2; 𝜸 = 𝟏/𝟔 = 0.1; 𝝃𝒊= 𝟎. 𝟎𝟎𝟏
Kernel R Acc. R Acc. R Acc.
linear 0.67 70% 0.73 75.5% 0.81 79% Polynomial 0.65 65% 0.69 67% 0.75 72%
language can be done more efficiently and accurately if various text features at different textual levels are taken into account instead of taking a small subset. Moreover, model developed using support vectors to determine reading difficulty in Hindi performs better than models which use linear regression.
5
General Discussion and Conclusion
In this paper, we have studied and compared different text feature performances in the context of text readability in Hindi. Support vector classification and regression techniques are used to develop models for determining the reading difficulty of a text document in Hindi. During our work, we have built a novel readability annotated Hindi text resource pool. We have compared the performances of our models with that are present in the literature. According to our analysis, in contrast to applying only the old
features or the new features, performance of the classifier improves if both types of features are used. This is true for classification as well as regression techniques. Overall, we have achieved 79% accuracy for binary text classification approach and root mean square error of 1.2 for regression approach. To the best of our knowledge, no such work on text readability has been recorded earlier in Hindi. In future, we are planning to develop for multi-class text readability models along with extending our user annotation database to incorporate better user perception in our studies. In addition, we will also explore the performances of SVM and SVR when applied separately to different genres of text.
The work will also be extended to model text comprehensibility for reading disabilities in Hindi.
Reference
Agnihotri, R. K. and Khanna, A. L. (1991). Evaluating the readability of school textbooks: An indian study. Journal of Reading, 35(4):pp. 282– 288.
Benjamin, R. (2012). Reconstructing readability:
analysis of text difficulty. Educational Psychology Review, 24:1–26.
Bhagoliwal, B. (1961). Readability formulae: Their reliability, validity and applicability in hindi. Journal of Education and Psychology, 19:13–26.
Bhagoliwal, B. (1965). Typographic dimensions affecting the legibility of hindi print: a factorial experiment. Journal of Education and Psychology.
Chang, C.-C. and Lin, C.-J. (2011). Libsvm: a library for support vector machines. ACM Transactions on Intelligent Systems and Technology (TIST), 2(3):27.
Collins-Thompson, K. and Callan, J. (2004). A language modeling approach to predicting reading difficulty. In Proceedings of HLT/NAACL, volume 4.
Collins-Thompson, K. and Callan, J. (2005). Predicting reading difficulty with statistical language models. Journal of the American Society for Information Science and Technology, 56(13):1448–1462.
Crossley, S., Dufty, D., McCarthy, P., and McNamara, D. (2007). Toward a new readability: A mixed model approach. In Proceedings of the 29th annual conference of the Cognitive Science Society, pages 197–202.
Dale, E. (1949). Readability.
DuBay, W. (2004). The principles of readability. Impact Information, pages 1–76.
Farr, J., Jenkins, J., and Paterson, D. (1951). Simplification of flesch reading ease formula. Journal of applied psychology, 35(5):333.
Flesch, R. (1948). A new readability yardstick. Journal of applied psychology, 32(3):221.
Fry, E. (1968). A readability formula that saves time. Journal of reading, 11(7):513–578.
Galley, M. and McKeown, K. (2003). Improving word sense disambiguation in lexical chaining. In IJCAI, volume 3, pages 1486–1488.
Graesser, A., McNamara, D., Louwerse, M., and Cai, Z. (2004). Coh-metrix: Analysis of text on cohesion and language. Behavior Research Methods, 36(2):193–202.
Gunning, R. (1968). The technique of clear writing. McGraw-Hill NewYork, NY.
Heilman, M., Collins-Thompson, K., and Eskenazi, M. (2008). An analysis of statistical models and
features for reading difficulty prediction. In Proceedings of the Third Workshop on Innovative Use of NLP for Building Educational Applications, pages 71–79. Association for Computational Linguistics.
Johnson, R. and Bond, G. (1950). Reading ease of commonly used tests. Journal of Applied Psychology, 34(5):319.
Kintsch, W. and Van Dijk, T. (1978). Toward a model of text comprehension and production. Psychological review, 85(5):363.
Landauer, T., Foltz, P., and Laham, D. (1998). An introduction to latent semantic analysis. Discourse processes, 25(2-3):259–284.
Liu, X., Croft, W., Oh, P., and Hart, D. (2004). Automatic recognition of reading levels from user queries. In Proceedings of the 27th annual international ACM SIGIR conference on Research and development in information retrieval, pages 548–549. ACM.
Manning, C. D., Raghavan, P., and Schütze, H. (2008). Introduction to information retrieval, volume 1. Cambridge University Press Cambridge.
McLaughlin, G. (1969). Smog grading: A new readability formula. Journal of reading, 12(8):639– 646.
Paas, F., Renkl, A., and Sweller, J. (2003). Cognitive load theory and instructional design: Recent developments. Educational psychologist, 38(1):1–4.
Petersen, S. E. and Ostendorf, M. (2009). A machine learning approach to reading level assessment. Computer Speech & Language, 23(1):89–106.
Rabin, A., Zakaluk, B., and Samuels, S. (1988). Determining difficulty levels of text written in languages other than english. Readability: Its past, present & future. Newark DE: International Reading Association, pages 46–76.
Resnick, P., Iacovou, N., Suchak, M., Bergstrom, P., and Riedl, J. (1994). Grouplens: an open architecture for collaborative filtering of netnews. In Proceedings of the 1994 ACM conference on Computer supported cooperative work, pages 175– 186. ACM.
Rosch, E. (1978). Principles of categorization. Fuzzy grammar: a reader, pages 91–108.
Schwarm, S. and Ostendorf, M. (2005). Reading level assessment using support vector machines and statistical language models. In Proceedings of the 43rd Annual Meeting on Association for Computational Linguistics, pages 523–530. Association for Computational Linguistics.
Sherman, L. (1893). Analytics of literature: A manual for the objective study of english poetry and prose. Boston: Ginn.
Si, L. and Callan, J. (2003). A semisupervised learning method to merge search engine results. ACM Transactions on Information Systems (TOIS), 21(4):457–491.
Sinha, M., Sharma, S., Dasgupta, T., and Basu, A. (2012). New readability measures for Bangla and Hindi texts. In Proceedings of COLING 2012: Posters, pages 1141–1150, Mumbai, India. The COLING 2012 Organizing Committee.
Zar, J. (1998). Spearman rank correlation. Encyclopedia of Biostatistics.