Research and
Development in the
Public Sector, 2000
Volume Two – The Research and
Development Element of the Science
Functions of Forfás
Is é Forfás an bord náisiúnta um polasaí agus comhairle le haghaidh fiontraíochta, trádála, eolaíochta, teicneolaíochta agus nuála. Is é an comhlacht é a bhfuil comhactaí dlíthiúla an stáit maidir le cur-chun-cinn tionscail agus forbairt teicneolaíochta dílsithe ann. Is é an comhlacht é freisin trína dciomnaítear cumhachtaí ar Fhiontraíocht Éireann le tionscail dúchais a chur chus cinn agus ar ghníomhaireacht Forbartha Tionscail na hÉireann (GFT Éireann) le
hinfheistíocht isteach sa tir a chur chun tosaight. Is iad feighmeanna Fhorfáis:
comhairle a chur ar an Aire ó thaobh cúrsaí a bhaineann le forbairt tionscail sa Stát
comhairle maidir le forbairt agus comhordú polasaithe a chur ar fáil d’Fhiontraíocht Éireann, d’GFT Éireann agus d’aon fhoras eile dá leithéid (a bunaíodh go reachtúil) a d’fhéadfadh an tAire a ainmniú trí ordú
forbairt na tionsclaíochta, na teicneolaíochta, na
margaíochta agus acmhainní daonna a spreagadh sa Stát
bunú agus forbairt gnóthas tionsclaíoch ón iasacht a spreagadh sa Stát, agus
Fiontraíocht Éireann agus GFT Éireann a chomhairliú agus a chomhordú ó thaobh a gcuid feidhmeanna.
Forfás is the national policy and advisory board for enterprise, trade, science, technology and innovation. It is the body in which the State’s legal powers for industrial promotion and technology development have been vested. It is also the body through which powers are delegated to Enterprise Ireland for the promotion of indigenous industry and to IDA Ireland for the promotion of inward investment. The broad functions of Forfás are to:
advise the Minister on matters relating to the development of industry in the State
to advise on the development and co-ordination of policy for Enterprise Ireland, IDA Ireland and such other bodies (established by or under statute) as the Minister may by order designate
encourage the development of industry, technology, marketing and human resources in the State
encourage the establishment and development in the State of industrial undertakings from outside the State, and
advise and co-ordinate Enterprise Ireland and IDA Ireland in relation to their functions.
Board Members
Peter Cassells Chairman
Sean Dorgan Chief Executive, IDA Ireland
Dan Flinter Chief Executive, Enterprise Ireland
Paul Haran Secretary General, Department of Enterprise, Trade & Employment
Professor Michael Hillery Chair of Manufacturing Engineering,
University of Limerick
Rody Molloy Director General, FÁS
William Murphy Partner, Tynan Dillon and Company
Feargal O’Rourke Partner, Taxation, PricewaterhouseCoopers
Professor Yvonne Scannell Faculty of Law, Trinity College
John Travers Chief Executive, Forfás
Toni Wall Managing Director,
Wall-2-Wall Ltd
Research and
Development in the
Public Sector, 2000
Financial allocations by Government for 2000 to
institutions engaged in research & development.
Volume Two – The Research and
Development Element of the
Executive Summary 3
Commentary 4
1 Introduction 7
2 Funding of Research and Development by the State 7
3 Performance of Research and Development in the Public Sector 13
4 Research and Development Performers 17
5 International Comparisons on Public Sector Research and Development 24
Executive Summary
For the first time this year’s ‘State Expenditure on Science and Technology’ includes a separate volume on research and development. Altogether R&D represents about a quarter of public science and technology expenditure, and the 2000 budget allocation amounts to £232.9m (€295.7m). This represents a very significant increase over the actual expenditure in 1999 of £147.7m (€187.5m).
The levels of R&D performed in the various Government Departments and their agencies is not the same as the total amounts they fund. An individual Department or its agencies might perform little or no R&D themselves while providing funding to other performers in either the public or private sectors.
In terms of public funding, the Departments and their agencies are allocating £232.9m (€295.7m) to R&D in 2000, up from £147.7m (€187.5m) in 1999. The major increases in allocations relate to additional allocations by the Department of Education and Science via the Higher Education Authority (£31m (€39.4m)) for research in the third level institutions, to the new Technology Foresight Fund (£25m, €31.7m) introduced by the Department of Enterprise, Trade and Employment (DETE) to establish Ireland as a leading research player in biotechnology and
information and communications technologies, and to extra funding by DETE via Enterprise Ireland (£14m (€17.8m)) for R&D grants to industry.
Commentary
For the first time this year’s ‘State Expenditure on Science and Technology’ includes a separate volume on research and development. Altogether R&D represents about a quarter of public science and technology expenditure, and the 2000 budget allocation amounts to £232.9m (€295.7m). This represents a very significant increase over the actual expenditure in 1999 of £147.7m (€187.5m). This additional investment alone justifies the need for a separate analysis of the funding and performance of R&D within the state sector.
Public Funding of Research and Development
On the expenditure side, £85.2m (€108.2m) extra has been allocated to R&D funding by the State in 2000. This represents an increase of 57.7% over 1999. The major increases relate to additional allocations by the Department of Education and Science via the Higher Education Authority (£31m (€39.4m)) for research in the third level institutions, to the new Technology Foresight Fund (£25m, €31.7m) introduced by the Department of Enterprise, Trade and Employment (DETE) to establish Ireland as a leading research player in biotechnology and information and communications technologies, and to extra funding by DETE via Enterprise Ireland (£14m (€17.8m)) for R&D grants to industry.
These additional allocations are to be welcomed, particularly the increased support for strategic research in the third level sector, an area where Ireland has long experienced significant under-investment compared to other developed countries. It should be noted, however, that the need to put in place a new organisation, Science Foundation Ireland, and completely new mechanisms to ensure that expenditures under the new Foresight Fund (over £500m (€634.9m) for the period 2000 – 2006) are distributed in line with best international practice for the funding of research will mean that not all of the £25m (€31.7m) allocated for 2000 will be spent by the end of the year.
Another welcome trend is the decreasing reliance, in percentage terms, on EU structural funds to support R&D in Ireland. Almost all of the increased allocations in 2000 are from exchequer sources, with the result that exchequer funds account for 68.0% of total allocations this year compared with 62.4% in 1999. The EU CSF (Community Support Framework) contribution is still significant in absolute terms and indeed is expected to increase substantially from £56m (€71.1m) in 1999 to £75m (€95.2m) in 2000, although these are provisional estimates by Departments which will only be confirmed when the various Operational Programmes are finalised with the European Commission.
Performance of R&D in the Government Sector
The two major productive sector Government Departments – Agriculture and Food, and Enterprise, Trade and Employment – have adopted different approaches to the development of their respective sectors. For agriculture and food there is a policy to support the sector by significant levels of research performed in public sector institutes. For the manufacturing and service industries supported by the Department of Enterprise, Trade and Employment there is a policy to encourage and fund the performance of R&D within the individual firm; at the same time, considerable efforts have been devoted to strengthening the third level colleges’ performance of industry-relevant research and to improving interaction and collaboration between the business sector and the colleges.
This report shows that Ireland relies less on research in public research institutes than many other countries. This is reflected in the overall balance of research performance in Ireland. Taking Finland as a comparison, Table 1 shows the different composition of total research performance between the two countries. The comparison is useful because Finland also has a national strategy to develop a high technology business sector based on the generation and application of new knowledge.
Table 1
Performers (%) Ireland Finland
Business Sector 74 68
Higher Education Sector 19 19
Public Sector 7 13
Total 100 100
The level of R&D performed in the business sector in Ireland is still below the EU average, at 1.02% of GDP. Other economies which also rely on high technology industries have a much higher level – Sweden 2.9%, Japan and Korea 2.1%, US and Finland 2.0%. Much of the innovation underlying the performance of multinational enterprises located here is based on research and development performed elsewhere. It could be argued, therefore, that Ireland is not generating the level of innovation appropriate to its industrial structure.
This year the Department of Enterprise, Trade and Employment put in place the most significant development ever in the history of support for science and technology. This was the
establishment of Science Foundation Ireland and the allocation of over £500m (€634.9m) to it to fund research in niche areas of biotechnology and information and communications
technologies.
The strategic rationale behind this initiative is the need to stimulate a greater level of top class research in the economy in support of high-technology sectors and to ensure that a sufficient supply of good researchers become available to drive a more sophisticated research
1
Introduction
The role of research has become increasingly relevant in modern society where the complexity and technology-content of most activities offers significant opportunities for innovation based solutions to complex problems. The R&D element of the government’s STI expenditure is important because it is the most discretionary component when compared to other Government expenditures in support of regulatory and statutory functions.
Research and development (R&D) in all countries is performed in three distinct sectors of the economy – the business sector, the universities and technological institutes of the third level sector, and the government sector. The State both funds R&D activities performed in all three sectors and also arranges for R&D to be performed within the state sector in order to promote its own strategic objectives. This section examines both performance and funding of R&D by the State.
2
Funding of R&D by the State
[image:9.595.81.553.416.740.2]Table 2 shows the Government funding of R&D, which can be performed either in the Government sector itself (as discussed in the previous sections), in the business sector or in third level education colleges. The total allocation is £232.9m (€295.7m), up from £147.7m (€187.5m) in 1999 (an increase of 57.7%).
Table 2: Public Funding of Research and Development
Exchequer £'000
CSF £'000
Public Funding
£'000
Exchequer £'000
CSF £'000
Public Funding
£'000
1999 2000
Funding Dept./Agency
Allocating Organisation
Enterprise, Trade Enterprise Ireland 2,775 20,081 22,856 5,320 31,290 36,610
& Employment Forfás 25,000 25,000
PAT's 1,928 5,787 7,715 3,028 7,533 10,561
Higher Education Authority 1,791 5,374 7,165 1,900 5,700 7,600
Shannon Development 1,403 4,008 5,411 1,560 4,000 5,560
IDA Ireland 42 3,878 3,920 50 4,000 4,050
NMRC 684 2,052 2,736 659 1,978 2,637
FÁS 567 599 1,166 640 494 1,134
Údarás na Gaeltachta 766 766 800 800
Dept. of Enterprise, T&E 149 375 524 21 375 396
Innovation Centre 162 83 245 129 71 200
ESRI 200 200 58 58
DIAS 5 18 23 12 28 40
NMAC 19 57 76
Table 2: Public Funding of Research and Development
Education & Science Higher Education Authority 23,436 2,089 25,525 56,873 56,873 Education & Science 19,288 47 19,335 8,204 8,570 16,774
DIAS 1,256 1,256 1,285 1,285
ESRI 76 76 97 97
Sub-total 44,056 2,136 46,192 66,459 8,570 75,029
Agriculture & Food Teagasc 14,040 5,064 19,104 17,761 2,509 20,270 Higher Education Authority 900 2,702 3,602 1,148 3,445 4,593 Department of Agri & Food 4,214 179 4,393 4,154 238 4,392
Enterprise Ireland 5 14 19
ESRI 11 11
Sub-total 19,170 7,959 27,129 23,063 6,192 29,255
Marine & Natural COFORD 73 787 860 273 554 827
Resources Marine Institute 995 346 1,341 164 496 660
Higher Education Authority 107 322 429 156 470 626
Marine & Natural Resources 436 436 396 396
Enterprise Ireland 64 193 257 70 131 201
Teagasc 25 75 100 16 47 63
DIAS 10 28 38 28 10 38
ESRI 10 10 9 9
Sub-total 1,720 1,751 3,471 1,112 1,708 2,820
Health & Children Health Research Board 5,512 5,512 9,152 9,152
Health & Children 553 553 634 634
ESRI 334 334 398 398
Sub-total 6,399 6,399 10,184 10,184
Environment & Environmental Protection
Local Government Agency 608 362 970 589 650 1,239
Higher Education Authority 219 219 1,200 1,200
National Roads Authority 534 534 570 570
Environment & Local Gov 186 186 173 173
ESRI 11 11 165 165
Teagasc 7 7 50 50
Met Éireann 10 10 20 20
Sub-total 1,349 588 1,937 1,518 1,900 3,418
Table 2: Public Funding of Research and Development
Arts, Heritage, Údarás na Gaeltachta 1,352 1,352 1,250 1,250
Gaeltacht & the Dept. of Arts, Heritage, etc 892 892 1,150 1,150
Islands Natural History Museum 169 169 169 169
Sub-total 2,413 2,413 2,569 2,569
Public Enterprise Met Éireann 688 688 844 844
R.P.I.I. 271 271 268 268
Sub-total 959 959 1,112 1,112
Social, Community Social, Community etc 3,632 3,632 10,844 10,844
And Family Affairs ESRI 81 81 52 52
Sub-total 3,713 3,713 10,896 10,896
Finance ESRI 1,667 1,667 1,852 1,852
Taoiseach NESC 464 464 470 470
Central Bank Central Bank 387 387 481 481
Ordnance Survey Ordnance Survey 130 130 135 135
Total 92,152 55,513 147,664 158,228 74,639 232,866
%Total 62% 38% 100% 68% 32% 100%
* Public funds are exchequer & CSF funds
1999 2000
Exchequer £'000
CSF £'000
Public Funding
£'000
Exchequer £'000
CSF £'000
Public Funding
£'000 Funding
Dept./Agency
Table 2A: Public Funding of Research and Development
Enterprise, Trade Enterprise Ireland 3,523 25,498 29,021 6,755 39,730 46,485
& Employment Forfás 31,743 31,743
PAT's 2,448 7,348 9,796 3,845 9,565 13,410
Higher Education Authority 2,274 6,824 9,098 2,413 7,238 9,650
Shannon Development 1,781 5,089 6,871 1,981 5,079 7,060
IDA Ireland 53 4,924 4,977 63 5,079 5,142
NMRC 869 2,606 3,474 837 2,512 3,348
FÁS 720 761 1,481 813 627 1,440
Údarás na Gaeltachta 973 973 1,016 1,016
Dept. of Enterprise, T & E 189 476 665 26 476 502
Innovation Centre 205 105 311 164 90 254
ESRI 254 254 74 74
DIAS 6 23 29 15 36 51
NMAC 24 72 97
Sub-total 12,348 54,699 67,046 48,728 71,448 120,175
Education & Science Higher Education Authority 29,758 2,652 32,410 72,213 72,214 Education & Science 24,491 60 24,550 10,417 10,882 21,299
DIAS 1,595 1,595 1,632 1,632
ESRI 97 97 123 123
Sub-total 55,940 2,712 58,652 84,385 10,882 95,267
Agriculture & Food Teagasc 17,828 6,430 24,258 22,552 3,186 25,737 Higher Education Authority 1,143 3,431 4,574 1,458 4,374 5,832 Department of Agri & Food 5,351 227 5,578 5,274 302 5,577
Enterprise Ireland 6 18 24
ESRI 14 14
Sub-total 24,341 10,106 34,447 29,284 7,862 37,146
Marine & Natural COFORD 93 999 1,092 347 703 1,050
Resources Marine Institute 1,263 439 1,703 208 630 838
Higher Education Authority 136 409 545 198 597 795
Marine & Natural Resources 554 554 503 503
Enterprise Ireland 81 245 326 89 166 255
Teagasc 32 95 127 20 60 80
DIAS 13 36 48 36 13 48
ESRI 13 13 11 11
Sub-total 2,184 2,223 4,407 1,412 2,169 3,581
Exchequer
€'000 CSF
€'000
Public Funding
€'000
Exchequer
€'000
CSF
€'000
Public Funding
€'000 Funding
Dept./Agency
[image:13.595.79.546.84.668.2]Allocating Organisation
Table 2A: Public Funding of Research and Development
Health & Children Health Research Board 6,999 6,999 11,621 11,621
Health & Children 702 702 805 805
ESRI 424 424 505 505
Sub-total 8,125 8,125 12,931 12,931
Environment & Environmental Protection Agency 772 460 1,232 748 825 1,573
Local Government Higher Education Authority 278 278 1,524 1,524
National Roads Authority 678 678 724 724
Environment & Local Gov. 236 236 220 220
ESRI 14 14 210 210
Teagasc 9 9 64 64
Met Éireann 13 13 25 25
Sub-total 1,713 747 2,459 1,927 2,413 4,340
Arts, Heritage, Údarás na Gaeltachta 1,717 1,717 1,587 1,587
Gaeltacht & the Dept. of Arts, Heritage, etc 1,133 1,133 1,460 1,460
Islands Natural History Museum 214 214 215 214
Sub-total 3,064 3,064 3,262 3,262
Public Enterprise Met Éireann 873 873 1,072 1,072
RPII 344 344 340 340
Sub-total 1,217 1,218 1,412 1,412
Social, Community Social, Community etc 4,612 4,612 13,769 13,769
And Family Affairs ESRI 103 103 66 66
Sub-total 4,715 4,715 13,835 13,835
Finance ESRI 2,117 2,117 2,352 2,352
Taoiseach NESC 589 589 597 597
Central Bank Central Bank 491 491 611 611
Ordnance Survey Ordnance Survey 165 165 171 171
Total 117,008 70,487 187,495 200,908 94,774 295,679
%Total 62% 38% 100% 68% 32% 100%
* Public funds are exchequer & CSF funds
The anticipated level of funding in 2000 shows an increase of about £85m (€107.9m) over 1999 levels. The major components of this increase are :
Department of Education and Science / Higher Education Authority :£31m (€39.4m) additional under the Programme for Research in Third Level Colleges
Department of Enterprise, Trade and Employment / Forfás :£25m (€31.7m) for the Technology Foresight Fund to be administered by Science Foundation Ireland. In practice, the bulk of this money will not be spent until 2001.
Department of Enterprise, Trade and Employment / Enterprise Ireland :£14m (€17.8m) additional for R&D grants to the business sector and £3m (€3.8m) for research conducted by the PATs
(Programmes in Advanced Technologies), mainly in third level colleges.
Department of Social, Community and Family Affairs :£7m (€8.9m) to fund the development of new systems
[image:14.595.96.520.397.796.2]Department of Health and Children / Health Research Board : £3.5m (€4.4m) additional for health-related research.
[image:14.595.90.520.412.608.2]Figure 1 depicts the sources of funds for total R&D expenditure over the past decade. The most notable aspect is the fact that while Exchequer funding has slightly increased its percentage of the total funding from 52% in 1990 to 54%, it has in real terms increased by £106.1m (€134.7m) or 203% since 1990. The contribution of EU Community Support Framework programmes has increased from 14% of the total funding in 1990 to 26% of the total in 2000.
Figure 1 Sources of Total R&D Funding 1990-2000 (2000 prices, £m)
0 200 180 160 140 120 100 80 60 40 20
1990 1991 1992 1993 1994 1995 1996 1997 1998 1999 2000
Exchequer CSF Earned Income
3 Performance of R&D in the
Public Sector
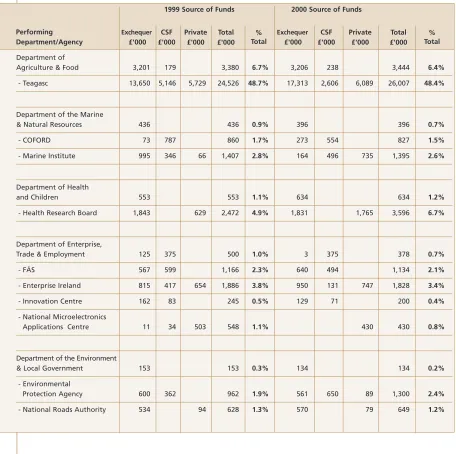
[image:15.595.90.546.267.721.2]Table 3 gives the profile of R&D performance in the public sector. The total 2000 allocation is £53.8m (€68.3m), representing about 0.3% of total government budget allocations of over £21 billion (€26.7 billion). Indeed, nearly £11.4m (€14.5m) of the total comes from earned income, so that the public investment in R&D, which is performed in the state sector, is £42.4m (€53.8m). There was an increase in total exchequer R&D support in 2000 of £4.1m, €5.2m (12.5%) over the 1999 outturn. This is to offset the decrease in funding from the CSF programmes of £2.7m, €3.5m (-32.5%).
Table 3: Performance of Research and Development in the Government Sector
1999 Source of Funds 2000 Source of Funds
Performing Department/Agency Exchequer £'000 CSF £'000 Private £'000 Total £'000 % Total Exchequer £'000 CSF £'000 Private £'000 Total £'000 % Total Department of
Agriculture & Food 3,201 179 3,380 6.7% 3,206 238 3,444 6.4%
- Teagasc 13,650 5,146 5,729 24,526 48.7% 17,313 2,606 6,089 26,007 48.4%
Department of the Marine
& Natural Resources 436 436 0.9% 396 396 0.7%
- COFORD 73 787 860 1.7% 273 554 827 1.5%
- Marine Institute 995 346 66 1,407 2.8% 164 496 735 1,395 2.6%
Department of Health
and Children 553 553 1.1% 634 634 1.2%
- Health Research Board 1,843 629 2,472 4.9% 1,831 1,765 3,596 6.7%
Department of Enterprise,
Trade & Employment 125 375 500 1.0% 3 375 378 0.7%
- FÁS 567 599 1,166 2.3% 640 494 1,134 2.1%
- Enterprise Ireland 815 417 654 1,886 3.8% 950 131 747 1,828 3.4%
- Innovation Centre 162 83 245 0.5% 129 71 200 0.4%
- National Microelectronics
Applications Centre 11 34 503 548 1.1% 430 430 0.8%
Department of the Environment
& Local Government 153 153 0.3% 134 134 0.2%
- Environmental
Protection Agency 600 362 962 1.9% 561 650 89 1,300 2.4%
Performing Department/Agency
Exchequer £'000
CSF £'000
Private £'000
Total £'000
% Total
Exchequer £'000
CSF £'000
Private £'000
Total £'000
[image:16.595.88.554.113.584.2]% Total
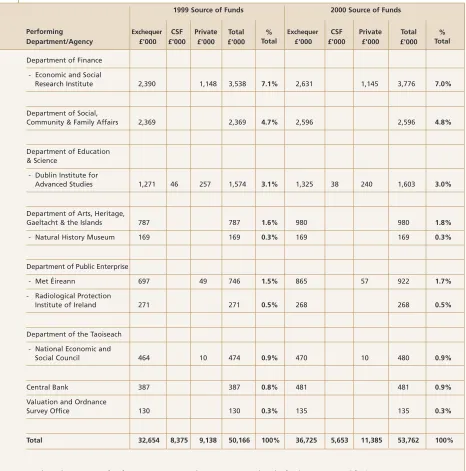
Table 3: Performance of Research and Development in the Government Sector
Department of Finance - Economic and Social
Research Institute 2,390 1,148 3,538 7.1% 2,631 1,145 3,776 7.0%
Department of Social,
Community & Family Affairs 2,369 2,369 4.7% 2,596 2,596 4.8%
Department of Education & Science
- Dublin Institute for
Advanced Studies 1,271 46 257 1,574 3.1% 1,325 38 240 1,603 3.0%
Department of Arts, Heritage,
Gaeltacht & the Islands 787 787 1.6% 980 980 1.8%
- Natural History Museum 169 169 0.3% 169 169 0.3%
Department of Public Enterprise
- Met Éireann 697 49 746 1.5% 865 57 922 1.7%
- Radiological Protection
Institute of Ireland 271 271 0.5% 268 268 0.5%
Department of the Taoiseach - National Economic and
Social Council 464 10 474 0.9% 470 10 480 0.9%
Central Bank 387 387 0.8% 481 481 0.9%
Valuation and Ordnance
Survey Office 130 130 0.3% 135 135 0.3%
Total 32,654 8,375 9,138 50,166 100% 36,725 5,653 11,385 53,762 100%
* Where there are transfers from one S&T agency/department to another the funds are accounted for in the performing agency
Table 3A: Performance of Research and Development in the Government Sector
Department of Agriculture
& Food 4,064 227 4,292 6.7% 4,071 302 4,373 6.4%
- Teagasc 17,332 6,534 7,274 31,141 48.9% 21,983 3,309 7,731 33,022 48.4%
Department of the Marine
& Natural Resources 554 554 0.9% 503 503 0.7%
- COFORD 93 999 1,092 1.7% 347 703 1,050 1.5%
- Marine Institute 1,263 439 84 1,787 2.8% 208 630 933 1,771 2.6%
Department of Health
and Children 702 702 1.1% 805 805 1.2%
- Health Research Board 2,340 799 3,139 4.9% 2,325 2,241 4,566 6.7%
Department of Enterprise,
Trade & Employment 159 476 635 1.0% 4 476 480 0.7%
- FÁS 720 761 1,481 2.3% 813 627 1,440 2.1%
- Enterprise Ireland 1,034 530 830 2,394 3.8% 1,206 166 949 2,321 3.4%
- Innovation Centre 205 106 311 0.5% 164 90 254 0.4%
- National Microelectronics
Applications Centre 14 43 638 696 1.1% 546 546 0.8%
Department of the Environment
& Local Government 194 194 0.3% 170 170 0.2%
- Environmental Protection
Agency 762 460 1,221 1.9% 712 825 113 1,651 2.4%
- National Roads Authority 678 119 797 1.3% 724 100 824 1.2%
Department of Finance - Economic and Social
Research Institute 3,035 1,458 4,492 7.0% 3,341 1,454 4,795 7.0%
Department of Social,
Community & Family Affairs 3,008 3,008 4.7% 3,296 3,296 4.8%
Performing Department/Agency
Exchequer
€'000 CSF
€'000 Private
€'000 Total
€'000 % Total
Exchequer
€'000 CSF
€'000
Private
€'000
Total
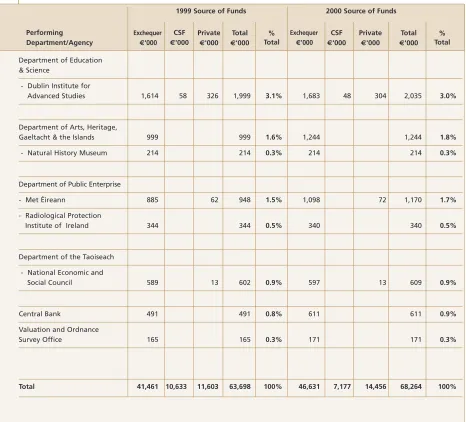
Table 3: Performance of Research and Development in the Government Sector
Department of Education & Science
- Dublin Institute for
Advanced Studies 1,614 58 326 1,999 3.1% 1,683 48 304 2,035 3.0%
Department of Arts, Heritage,
Gaeltacht & the Islands 999 999 1.6% 1,244 1,244 1.8%
- Natural History Museum 214 214 0.3% 214 214 0.3%
Department of Public Enterprise
- Met Éireann 885 62 948 1.5% 1,098 72 1,170 1.7%
- Radiological Protection
Institute of Ireland 344 344 0.5% 340 340 0.5%
Department of the Taoiseach - National Economic and
Social Council 589 13 602 0.9% 597 13 609 0.9%
Central Bank 491 491 0.8% 611 611 0.9%
Valuation and Ordnance
Survey Office 165 165 0.3% 171 171 0.3%
Total 41,461 10,633 11,603 63,698 100% 46,631 7,177 14,456 68,264 100%
* Where there are transfers from one S&T agency/department to another the funds are accounted for in the performing agency
1999 Source of Funds 2000 Source of Funds
Performing Department/Agency
Exchequer
€'000 CSF
€'000 Private
€'000 Total
€'000 % Total
Exchequer
€'000 CSF
€'000
Private
€'000
Total
R&D performed in the public sector (known as GOVERD) has remained static since 1994 in real terms. In 2000 it amounted to £53.8m (€68.3m) or 0.07% of GDP. Figure 2 shows the trend since 1994.
Figure 2 Performance of R&D in the Public Sector 1994-2000
4
Research and Development
Performers
[image:19.595.85.519.153.544.2]The major public sector performers (with expenditure over £1m, €1.27m in 2000) are listed in Table 4.
Table 4: Public Sector Performers in 2000
£m €m
Teagasc 26.0 33.0
Economic and Social Research Institute 3.8 4.8
Health Research Board 3.6 4.6
Department of Agriculture & Food 3.4 4.3
Department of Social, Community and Family Affairs 2.6 3.3
Enterprise Ireland 1.8 2.3
Dublin Institute for Advanced Studies 1.6 2.0
Marine Institute 1.4 1.8
IR£m
0 10 20 30 40 50 60
1994 1995 1996 1997 1998 1999 2000
0.13%
0.11% 0.11% 0.10% 0.09%
0.07% 0.07%
Constant Prices
Goverd as a % of GDP
52.7 53.2
55.8 56.0
58.5
53.8 52.6
45.8
50.5
47.4
50.3 55.1
51.5
Teagasc is the only significant performer of R&D in the public sector. Its research budget for 2000 is £26.0m (€33.0m), compared to an actual level of £24.5m (€31.1m) in 1999. The Department of Agriculture & Food performs a further £3.4m (€4.3m) of R&D in its food related research. Nearly an order of magnitude lower in terms of scale comes the Economic and Social Research Institute, which performs research to the value of £3.8m (€4.8m). There are four or five other minor players with budgets over £1m (€1.27m) and a larger number who perform relatively small amounts less than £1m annually. It can be seen, therefore, with the significant exception of the agriculture and food sectors, that there is very little research performed in the Irish public sector. Details about the work of these organisations are given below.
Teagasc
£'000 £'0001999 2000
R&D Budget 24,526 26,007
(€31,142) (€33,022)
The 2000 research and development budget on a total cost basis is £26.0m (€33m), of which £18.5m (€23.5m) relates to research in sustainable agriculture and rural development and £7.5m (€9.5m) to food research.
Figure 3 presents the sources of funding for research carried out by Teagasc over the last decade. The most significant increase is from exchequer sources, which has increased by £8.4m, €10.7m (93%) over the 1990 figure.
Figure 3 R&D by source of funds, current prices
1990
1993
1999 1996
2000
Exchequer EU CSF Irish Industry
EU Framework contract income Other Income
[image:20.595.94.421.450.742.2]Teagasc’s research activities are grouped together into nine main programmes outlined below.
1 Agri food economics
The programme aims to develop the strategic knowledge base on:
changes in the economic performance and competitiveness of the main farm enterprises;
developments in export markets and changes in consumer preferences;
the impacts of policy changes and market trends on the competitiveness of the Irish agri-food industry.
The work is classified under four sub-programmes as follows:
Production Economics
Competitiveness
Policy Analysis
Market Trends
2 Rural Development
A major objective in 2000 is to develop a capacity to model rural change to pinpoint the factors which contribute to rural viability; assess the effects of policy proposals and current trends and evaluate the potential role of alternative enterprises in supplementing farm incomes.
Additional resources are being devoted to a major project on forestry involving the development of a forest soils classification and productivity. Projects are also underway investigating mushroom, vegetable and nursery stock production.
3 Rural Environment
Aims to develop viable nutrient and waste management strategies designed to minimise the adverse impact of agricultural and other enterprises on the rural environment and to develop strategies for the enhancement of rural landscapes and the ecological management of set-aside areas. The programme comprises the following three sub-programmes:
Sustainable Farming Systems
Soil Fertility
Nutrient Management
4 Food Processing
Emphasis is placed on meats, food ingredients, new cheese varieties, new consumer products and new technology. Research on the quality, safety and nutritional value of foods are key features of this programme. The programme covers the full spectrum of the innovative process, ranging from market studies through strategic research to technology development services and training programmes. The programme comprises the following areas:
Dairy Products and Food Ingredients
Meat and Fish Products
5 Dairy Production
The objective of the research programme is to improve the competitiveness of Irish dairy production while ensuring product quality and safety and reducing the seasonality of milk supply. It must also ensure that the systems of production are compatible with animal health and welfare and with the protection of the environment.
6 Beef Production
The objective of the research programme is to provide technologies to allow the profitability of Irish beef farmers to be enhanced, through improved cost efficiencies of grassland and forage production and optimal animal husbandry practices, and meeting consumer needs for quality.
7 Sheep Production
The objectives of the research programme are to improve the competitiveness of sheep production by increasing ewe productivity and improving product quality based on sustainable systems designed to reduce production costs and reduce seasonality of supply. Work on grass and clover production and utilisation for intensive grazing systems is ongoing. Studies into human resources and labour requirements for sheep farming are also underway.
8 Pig Production
The objectives of the programme are to develop an integrated pig production system and to reduce the unit cost and improve the quality of pigmeat while reducing environmental impact and improving animal welfare.
9 Crops Production
The objective of the research programme is the development of more efficient production systems designed to increase competitiveness and improve product quality, whilst reducing chemical inputs. Projects are carried on in areas such as:
Reduced chemical and fungicide inputs for weed and pest control in winter and spring cereals;
The development of pest and virus control strategies for cereals;
Reduced-input winter wheat production systems.
Analysis and testing in connection with food composition, quality and safety.
Economic and Social Research Institute
£'000 £'0001999 2000
R&D Budget 3,538 3,776
(€4,492) (€4,794.5)
The Economic and Social Research Institute undertakes research designed to provide knowledge relevant to solving the major economic and social problems in Ireland. An important secondary function of the Institute is to assist in the development of top quality research workers through its training and education programmes.
incomes, demography and labour, social policy, values and attitudes, data and methodology. It also undertakes commissioned studies, surveys and data analysis on behalf of outside organisations and provides training in research for young graduates.
Health Research Board
£'000 £'0001999 2000
R&D Budget 2,472 3,596
(€3,139) (€4,566)
The main function of the Health Research Board is to allocate research funds to other organisations. It does, however, conduct some research itself.
The HRB’s research activities are outlined below:
Medico-Social Research Surveys
The Board designs and interprets surveys covering projects on for example, child health and neural tube defects, schizophrenia, drug misuse, alcoholism and evaluation of mental health services.
Research Units
The Board will support ten units in 1999 which are researching Hepatitis C, Inflammatory Bowel Disease, Cystic Fibrosis Pulmonary Disease, Eicosanoids in Vascular Disease, Suicide, Gene Therapy for Cancer, Retinopathies Research and Cancer, Early Arthritis, Diabetic Nephropathy, and health status and health gain. It is co-funding a unit in conjunction with the Irish Heart Foundation conducting research into Vascular Disease and Homocysteine Metabolism.
Department of Agriculture, Food and Rural Development
£'000 £'0001999 2000
R&D Budget 3,380 3,444
(€4,292) (€4,373) The Department’s research activities are grouped together into three main programmes outlined below.
1 Improvement of Crops
Improving the quality of crops and crop products through the use of the highest quality varieties and seeds. The main activities leading to achievement of this objective include:
the operation of two stations/farms at Ballinacurra in Co. Cork and Backweston in Co. Dublin, where plant varieties are evaluated
the operation of a potato laboratory at Raphoe in Co. Donegal
the carrying out of trials in farmers’ fields throughout the country.
2 Veterinary and Meat Laboratory Services
3 Improvement of Livestock
Improving the quality of livestock and livestock products through adoption of better breeding and selection practices. The main activities leading to achievement of these objectives are operation of on-farm and central testing stations; recording schemes; collaboration with and support for research in animal breeding at research institutions.
Department of Social, Community and Family Affairs
£'000 £'0001999 2000
R&D Budget 2,369 2,596
(€3,008) (€3,296)
The Department’s research programmes in 2000 are funded entirely from exchequer funds.
The Department’s main research activities are:
the systematic review and evaluation of existing social welfare policies, programmes and schemes
the monitoring of economic and demographic developments and their impact on social welfare;
the formulation of new social policy developments
In addition the department has responsibility for the Combat Poverty Agency. The Agency’s four main functions are policy advice, project support and innovation, research and public education. The Agency undertakes, commissions and publishes research, evaluations policy reports and other information on aspects of poverty. Approximately half of the Agency’s activities can be classified as research.
Enterprise Ireland
£'000 £'0001999 2000
R&D Budget 1,886 1,828
(€2,394) (€2,321)
Enterprise Ireland’s research activities are in the following areas:
Forest Products
Applied research is carried-out to identify opportunities for Irish timber and to develop new applications and standards. In addition, training and assistance with new product and process development is provided to the Irish timber industry.
Materials Programme
This programme provides a research and development support service to industry and the public sector covering a wide range of material-related research and development with a significant programme in industrial coatings and ceramics.
National Electrical Test Centre (NETC)
NETC is involved in a number of EU-funded international research projects in advanced
Dublin Institute for Advanced Studies
£'000 £'0001999 2000
R&D Budget 1,574 1,603
(€1,999) (€2,035)
The Institute, through the constituent schools, pursues fundamental research and trains advanced students in methods of original research.
The School of Theoretical Physics
The school pursues basic research in theoretical particle physics; classical statistical mechanics; quantum statistical mechanics and quantum electronics. The School pursues applied research in queuing theory for telecommunications which is closely related to the basic research carried out in classical statistical mechanics.
The School of Cosmic Physics
The school conducts theoretical and experimental work in astronomy, astrophysics, space physics and geophysics.
Marine Institute
£'000 £'0001999 2000
R&D Budget 1,407 1,395
(€1,787) (€1,771)
The Marine Institute operates from its Headquarters in Dublin and has three regional research laboratories at Abbotstown, Galway and Newport. The Institute also operates the National Marine Data Centre and the national research vessel Celtic Voyager.
Environmental Protection Agency
£'000 £'0001999 2000
R&D Budget 962 1,300
(€1,221) (€1,651)
The EPA’s research activities are outlined below.
Environmental Monitoring and Laboratory Services
This programme is concerned with the investigation of eutrophication tendencies in lakes, rivers and estuarine and coastal waters; the remote sensing of algal growth in lakes; and baseline studies of toxic and persistent substances in surface waters.
Licensing and Enforcement
5
International Comparisons on
Public Sector R&D
[image:26.595.89.518.334.575.2]It is useful to benchmark Ireland’s relative position in comparison to other countries in order to assess our performance to date. It must be mentioned that taking these indicators in isolation may give a false impression of the underlying research scene. Indicators only give a partial view of the reality. In addition, many indicators do not reflect the quality or efficiency of countries in particular areas. For example, a high R&D intensity does not necessarily imply that R&D inputs are efficiently used.
Table 5 shows both the performance of R&D in the public sector (excluding the higher education sector) and the funding of R&D by the Government (this would fund R&D performed not only in the public sector but also in the business sector and in the higher education sector).
Table 5: R&D Performance and Funding by the Government Sector for Selected Countries.
(1999 or nearest)
New Zealand 0.41 0.57
Finland 0.38 1.06
Netherlands 0.37 0.79
Denmark 0.32 0.72
Norway 0.28 0.72
Portugal 0.16 0.62
Sweden 0.14 0.79
Greece 0.13 0.28
Ireland (2000) 0.07 0.29
Source: OECD
There is a wide variation in approaches and results between the different countries. Most of the countries have a similar profile, performing a significant level of R&D in the public sector and funding still more in other sectors. Ireland has a tradition of having very little R&D performed in the public sector with the significant investment being carried out in the business and higher education sectors.
Public Sector R&D
Performance (% GDP)
Government Funding
[image:26.595.85.520.337.573.2]Reports Published by Forfás 2000 - 2001
The Dynamics of the Retail Sector in Ireland January 2000
Enterprise 2010 January 2000
Survey of Research & Development in the Business Sector 1997 February 2000
Benchmarking Science, Technology & Mathematics Education in Ireland Against International Good Practice
Irish Council for Science, Technology & Innovation (ICSTI) February 2000 Proposals on Transport Infrastructure, the Planning Process and Public Transport
National Competitiveness Council (NCC) March 2000 The Second Report of the Expert Group on Future Skills Needs
Responding to Ireland’s growing skill needs March 2000 Business Education & Training Partnership 2nd Forum, Dublin March 2000
Management Development in the Republic of Ireland: Patterns and Trends May 2000
Annual Competitiveness Report 2000 & The Competitiveness Challenge Report
National Competitiveness Council (NCC) May 2000
State Expenditure on Science & Technology, 1999 June 2000
Forfás Annual Report 1999 July 2000
Statement on Telecommunications, e-Business and the Information Society
National Competitiveness Council (NCC) July 2000 Statement on Regulatory Reform
National Competitiveness Council (NCC) July 2000
Annual Survey of Irish Economy Expenditures August 2000
Report on e-Business Skills Report on In company Training
Expert Group on Future Skills Needs August 2000 Survey of Research in the Higher Education Sector 1998 September 2000
Statement on Labour Supply and Skills
National Competitiveness Council (NCC) September 2000
Telecommunications for e-Business: A User’s Guide November 2000
Annual Employment Survey 1999 November 2000
International Trade and Investment Report, 2000 December 2000
The 4th Framework Programme in Ireland April 2001
Commercialisation of Publicly Funded Research
Irish Council for Science, Technology & Innovation (ICSTI) April 2001 The Third Report of the Expert Group on Future Skills Needs
Responding to Ireland’s growing skill needs July 2001
Forfás Annual Report 2000 August 2001
Annual Employment Survey 2000 September 2001
Forfás
Wilton Park House,