Reducing the False Alarm Rate of Chinese Character Error Detection
and Correction
Shih-Hung Wu, Yong-Zhi Chen Chaoyang University of
Technol-ogy, Taichung Country
Ping-che Yang, Tsun Ku
Institute for information industry, Taipei City
[email protected], [email protected]
Chao-Lin Liu National Chengchi
Universi-ty, Taipei City
Abstract
The main drawback of previous Chinese cha-racter error detection systems is the high false alarm rate. To solve this problem, we propose a system that combines a statistic method and template matching to detect Chinese character errors. Error types include pronunciation-related errors and form-pronunciation-related errors. Possible errors of a character can be collected to form a confusion set. Our system automatically gene-rates templates with the help of a dictionary and confusion sets. The templates can be used to detect and correct errors in essays. In this paper, we compare three methods proposed in previous works. The experiment results show that our system can reduce the false alarm sig-nificantly and give the best performance on f-score.
1
Introduction
Since many Chinese characters have similar forms and similar or identical pronunciation, improperly used characters in Chinese essays are hard to be de-tectted. Previous works collected these hard-to-distinguish characters and used them to form confu-sion sets. Confuconfu-sion sets are critical for detecting and correcting improperly used Chinese characters. A confusion set of a Chinese character consists of cha-racters with similar pronunciation, similar forms, and similar meaning. Most Chinese character detection systems were built based on confusion sets and a lan-guage model. Ren et.al proposed a rule-based method that was also integrated with a language model to detect character errors in Chinese (Ren, Shi, & Zhou, 1994). Chang used confusion sets to represent all possible errors to reduce the amount of computation. A language model was also used to make decisions. The confusion sets were edited manually. Zhang et al. proposed a way to automatically generate confusion sets based on the Wubi input method (Zhang, Zhou, Huang, & Sun, 2000). The basic assumption was that characters with similar input sequences must have similar forms. Therefore, by replacing one code in the input sequence of a certain character, the system
could generate characters with similar forms. In the following work, Zhang et al. designed a Chinese cha-racter detection system based on the confusion sets (Zhang, Zhou, Huang, & Lu, 2000). Another input method was also used to generate confusion sets. Lin et al. used the Cangjie input method to generate con-fusion sets (Lin, Huang, & Yu, 2002). The basic as-sumption was the same. By replacing one code in the input sequence of a certain character, the system could generate characters with similar forms. Since the two input methods have totally different represen-tations of the same character, the confusion set of any given character will be completely different.
In recent years, new systems have been incorporat-ing more NLP technology for Chinese character error detection. Huang et al. proposed that a word segmen-tation tool can be used to detect character error in Chinese (Huang, Wu, & Chang, 2007). They used a new word detection function in the CKIP word seg-mentation toolkit to detect error candidates (CKIP, 1999). With the help of a dictionary and confusion set, the system can decide whether a new word is a cha-racter error or not. Hung et al. proposed a system that can detect character errors in student essays and then suggest corrections (Hung & Wu, 2008). The system was based on common error templates which were manually edited. The precision of this system is the highest, but the recall remains average. The main drawback of this approach is the cost of editing com-mon error templates. Chen et al. proposed an automat-ic method for common error template generation (Chen, Wu, Lu, & Ku, 2009). The common errors were collected from a large corpus automatically. The template is a short phrase with one error in it. The assumption is the frequency of a correct phrase must be higher than the frequency of the corresponding template, with one error character. Therefore, a statis-tical test can be used to decide weather there is a common error or not.
The main drawback of previous systems is the high false alarm rate. The drawback is found by comparing the systems with sentences without errors. As we will show in our experiments, the systems in previous works tent to report more errors in an essay than the real ones, thus, cause false alarms.
and a simplified common error template generation method. The idea of error model is adopted from the noise channel model, which is used in many natural language processing applications, but never on Chi-nese character error detection. With the help of error model, we can treat the error detection problem as a kind of translation, where a sentence with errors can be translated into a sentence without errors. The sim-plified template generation is based on given confu-sion sets and a lexicon.
The paper is organized as follows. We introduce briefly the methods in previous works in section 2. Section 3 reports the necessary language resources used to build such systems. Our approach is described in section 4. In section 5, we report the experiment settings and results of our system, as well as give the comparison of our system to the three previous sys-tems. Finally, we give the conclusions in the final section.
2
Previous works
In this paper, we compare our method to previous works. Since they are all not open source systems, we will reconstruct the systems proposed by Chang (1995), Lin, Huang, & Yu (2002), and Huang, Wu, & Chang (2007). We cannot compare our system to the system proposed by Zhang, Zhou, Huang, & Sun (2000), since the rule-based system is not available. We describe the systems below.
Chang‘s system (1995) consists of five steps. First, the system segments the input article into sentences. Second, each character in the sentence is replaced by the characters in the corresponding confusion set. Third, the probability of a sentence is calculated ac-cording to a bi-gram language model. Fourth, the probability of the sentences before and after replace-ment is compared. If the replacereplace-ment causes a higher probability, then the replacement is treated as a cor-rection of a character error. Finally, the results are outputted. There are 2480 confusion sets used in this system. Each confusion set consists of one to eight characters with similar forms or similar pronunciation. The system uses OCR results to collect characters with similar forms. The average size of the confusion sets was less than two. The language model was built from a 4.7 million character news corpus.
The system proposed by Lin, Huang, & Yu (2002) has two limitations. First, there is only one spelling error in one sentence. Second, the error was caused by the Cangjie input method. The system also has five steps. First, sentences are inputted. Second, a search is made of the characters in a sentence that have similar input sequences. Third, a language model is used to determine whether the replacement improves the probability of the sentence or not. Fourth, the three steps for all input sentences are repeated. Finally, the results are outputted. The confusion sets of this sys-tem were constructed from the Cangjie input method. Similarity of characters in a confusion set is ranked according to the similarity of input sequences. The
language model was built from a 59 million byte news corpus.
The system by Huang, Wu, & Chang (2007) con-sists of six steps. First, the input sentences are mented into words according to the CKIP word seg-mentation toolkit. Second, each of the characters in the new words is replaced by the characters in the confusion sets. Third, a word after replacement checked in the dictionary. Fourth, a language model is used to assess the replacement. Fifth, the probability of the sentence before and after replacement is com-pared. Finally, the result with the highest probability is outputted. The confusion set in this system, which also consists of characters with similar forms or simi-lar pronunciation, was edited manually.
Since the test data in the papers were all different test sets, it is improper to compare their results direct-ly, therefore; there was no comparison available in the literature on this problem. To compare these systems with our method, we used a fixed dictionary, inde-pendently constructed confusion sets, and a fixed lan-guage model to reconstruct the systems. We per-formed tests on the same test set.
3
Data in Experiments
3.1 Confusion sets
Confusion sets are a collection of sets for each indi-vidual Chinese character. A confusion set of a certain character consists of phonologically or logographical-ly similar characters. For example, the confusion set of “辦” might consist of the following characters with the same pronunciation“半伴扮姅拌絆瓣" or with
similar forms“辨瓣辮辯避僻辣梓辭鋅辟滓辛宰癖
莘辜薜薛闢”. In this study, we use the confusion sets used by Liu, Tien, Lai, Chuang, & Wu (2009). The similar Cangjie (SC1 and SC2) sets of similar forms, and both the same-sound-same-tone (SSST) and same-sound-different-tone (SSDT) sets for similar pronunciation were used in the experiments. There were 5401 confusion sets for each of the 5401 high frequency characters. The size of each confusion set was one to twenty characters. The characters in each confusion set were ranked according to Google search results.
3.2 Language model
Since there is no large corpus of student essays, we used a news corpus to train the language model. The size of the news corpus is 1.5 GB, which consists of 1,278,787 news articles published between 1998 and 2001. The n-gram language model was adopted to calculate the probability of a sentence p(S). The gen-eral n-gram formula is:
) |
( )
( 1 1
− + −
= n
N n n w w p S
p (1)
adopted the interpolated Kneser-Ney smoothing me-thod as suggested by Chen & Goodman (1996). As following:
) ( ) 1 ( ) | (
) | (
1 1 int
w p w
w p
w w p
unigram i
bigram i erpolate
λ
λ + −
= −
−
(2)
To determine whether a replacement is good or not, our system use the modified perplexity:
N S p
Perplexity
=
2
−log( ( ))/(3)
Where N is the length of a sentence and p(S) is the bi-gram probability of a sentence after smoothing.
3.3 Dictionary and test set
We used a free online dictionary provided by Tai-wan’s Ministry of Education, MOE (2007). We fil-tered out one character words and used the remaining 139,976 words which were more than one character as our lexicon in the following experiments.
The corpus is 5,889 student essays collected from a primary high school. The students were 13 to 15 years old. The essays were checked by teachers manually, and all the errors were identified and corrected. Since our algorithm needed a training set, we divided the essays into two sets to test our method. The statistics is given in Table 1. There are less than two errors in an essay on average. We find that most (about 97%) of characters in the essays were among the 5,401 most common characters, and most errors were characters of similar forms or pronunciation. Therefore, the 5,401 confusion sets constructed according to form and pronunciation were suitable for error detection.
Table 2 shows the error types of errors in students’ essays. More than 70% errors are characters with similar pronunciation, 40% errors are characters with similar form, and there are 20% errors are characters with both similar pronunciation and similar form. Only 10% errors are in other types. Therefore, in this study, our system aimed to identify and correct the errors of the two common types.
Table 1. Training set and test set statistics
# of Essays
Average length of essay
Average # of errors
% of common characters Training
set 5085 403.18 1.76 96.69%
Test set 804 387.08 1.2 97.11%
Table 2. Error type analysis
Similar form Similar pronunciation Both Other
Training set 41.54% 72.60% 24.24% 10.10%
Test set 40.36% 76.98% 27.66% 10.30%
4
System Architecture
[image:3.595.341.486.243.439.2]4.1 System flowchart
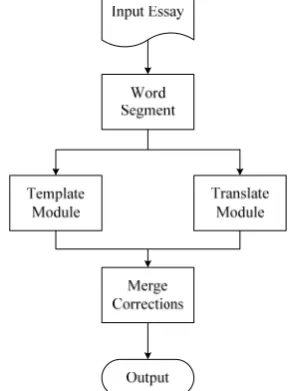
Figure 1 shows the flowchart of our system. First, the input essays are segmented into words. Second, the words are sent to two different error detection mod-ules. The first one is the template module, which can detect character errors based on the stored templates as in the system proposed by Chen, Wu, Lu, & Ku, (2009). The second module is the new language mod-el module, which treats error detection as a kind of translation. Third, the results of the two modules can be merged to get a better system result. The details will be described in the following subsections.
Figure 1. System flowchart
4.2 Word segmentation
The first step in our system uses word segmentation to find possible errors. In this study, we do not use the CKIP word segmentation tool (CKIP, 1999) as Huang, Wu, & Chang (2007) did, since it has a merge algorithm that might merge error charactersto form new words (Ma & Chen, 2003). We use a backward longest first approach to build our system. The lex-icon is taken from an online dictionary (MOE, 2007). We consider an input sentence with an error, “它總會 變 成 放 大 鏡 讓 我 關 看 世界”, as an example. The sentence will be segmented into “它|總會|變成|放 大鏡|讓|我|關|看|世界”. The sequence of single characters will be our focus. In this case, it is “讓我關 看”. These kinds of sequences will be the output of the first step and will be sent to the following two modules. The error character can be identified and corrected by a “關看”-“觀看” template.
4.3 Template Module
corpus. The simplified approach replaces one character of each word in a dictionary with one character in the corresponding confusion set. For example, a correct word “辦公” might be written with an error character “辨公” since “辨(bian4)” is in the confusion set of “辦(ban4)”’. This method generates all possible error words with the help of confusion sets. Once the error template “辨公” is matched in an essay, our system can conclude that the character is an error and make a suggestion on correction “辦公” based on the “辨公”-“辦公” template.
4.4 Translate module
To improve the n-gram language model method, we use a statistical machine translation formula (Brown, 1993) as a new way to detect character error. We treat the sentences with/without errors as a kind of transla-tion. Given a sentence S that might have character errors in the sentence in the source language, the out-put sentence C~ is the sentence in the target language with the highest probability of different replacements C. The replacement of each character is treated as a translation without alignment.
) | ( max arg ~ S C p C c
= (4)
From the Bayesian rule and when the fixed value of p(w) is ignored, this equation can be rewritten as (5):
) ( ) | ( max arg ) ( ) ( ) | ( max arg ~ C p C S p S p C p C S p C c c ≈ = (5)
The formula is known as noisy channel model. We call p(S|C) an “error model”, that is, the probability which a character can be incorrect. It can be defined as the product of the error probability of each charac-ter in the sentence.
∏
= = n i j i ij p s c
C W p 1 ) | ( ) |
( (6)
where n is the length of the sentence S, and siith
cha-racter of input sentence S. Cj is the jth replacement and cij.is the ith character at the jth replacement. The
error model was built from the training set of student essays. Where p(C) is the n-gram language model as was described in section 3.2. Note that the number of replacements is not fixed, since the number of re-placements depends on the size of all possible errors in the training set.
For example, consider a segmented sentence with an error: “就|像是|在|告|訢|我們”, we will use the error model to evaluate the replacement of each cha-racter in the subsequence: “在告訢”. Here p(再|在) and p(訴|訢) are 0.0456902 and 0.025729 respective-ly, which are estimated according to the training cor-pus. And in training corpus, no one write the character
告, therefore, there is no any replacement. Therefore, the probability of our error model and the n-gram lan-guage model can be shown in the following table. Our
system then multiplies the two probabilities and gets the perplexity of each replacement. The replacement “在告訴” gets the lowest perplexity, therefore, it is the output of our system and is both a correct error detection and correction.
Table 3. An example of calculating perplexity according the new error model
Error Model LM multiply Perplexity
在告訴 0.025728988 1.88E-05 4.83E-07 127.442812
再告訴 0.001175563 1.05E-04 1.24E-07 200.716961
在告訢 1 2.09E-09 2.09E-09 782.669809
再告訢 0.045690212 1.17E-08 5.34E-10 1232.6714
4.5 Merge corrections
Since the two modules detect errors using an inde-pendent information source, we can combine the deci-sions of the two modules to get a higher precision or a higher recall on the detection and correction of errors. We designed two working modes, the Precision Mode (PM) and the Detection Mode (DM). The output of PM is the intersection of the output of the template module and translation module, while the output of DM is the union of the two modules.
5
Experiment Settings and Results
Since there is no open source system in previous works and the data in use is not available, we repro-duced the systems with the same dictionary, the same confusion set, and the same language model. Then we performed a test on the same test set. Since the confu-sion sets are quite large, to reduce the number of combinations during the experiment, the size must be limited. Since Liu’s experiments show that it takes about 3 candidates to find the correct character, we use the top 1 to top 10 similar characters as the candi-dates only in our experiments. That is, we take 1 to 10 characters from each of the SC1, SC2, SSST, and SSDT sets. Thus, the size of each confusion set is limited to 4 for the top 1 mode and 40 for the top 10 mode.
The evaluation metrics is the same as Chang’s (1995). We also define the precision rate, detection rate, and correction rate as follows:
Precision = C / B * 100% (7)
Detection = C / A * 100% (8)
Correction = D / A * 100% (9)
im-portant in an error detection and correction system, we define the corresponding f-score as:
Correction Precision
Correction *
Precision *
2 score F
+ =
−
(10)
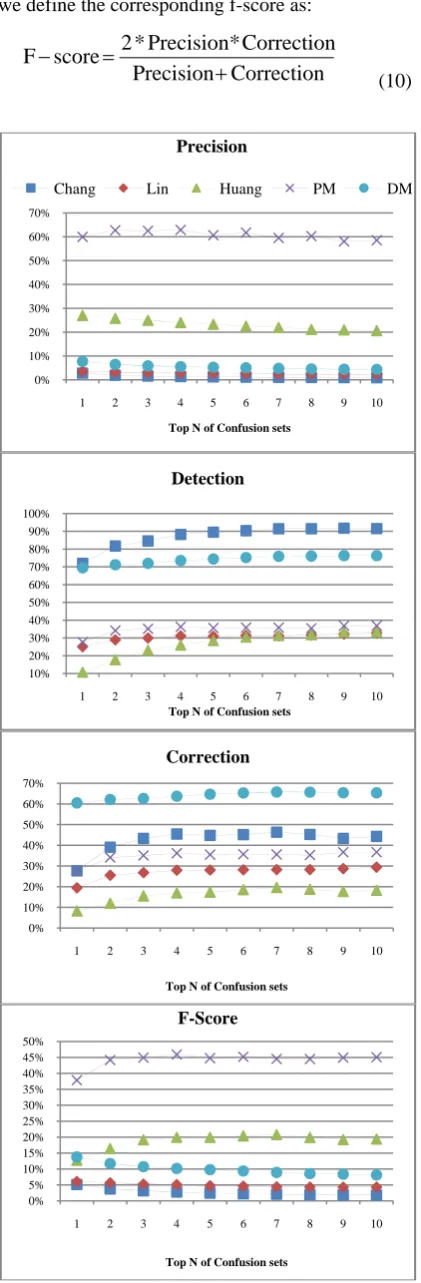
Figure 2. The comparison of different methods on full test set
[image:5.595.72.283.86.729.2]5.1 Results of our initial system
Table 4 shows the initial results of the template mod-ule (TM), the translation modmod-ule (LMM) and the combined results of the precision mode (PM) and detection mode (DM). We find that the precision mode gets the highest precision and f-score, while the detection mode gets the highest correction rate, as expected. The precision and detection rate improved dramatically. The precision improved from 14.28% to 61.68% for the best setting and to 58.82% for the best f-score setting. The detection rate improved from 58.06% to around 72%. The f-score improved from 22.28% to 43.80%. The result shows that combining two independent methods yield better performance than each single method does.
5.2 Results of our system when more know-ledge and enlarged training sets are added
The templates used in the initial system were the sim-plified automatic generated templates, as described in section 4.3. Since there were many manually edited templates in previous works, we added the 6,701 ma-nually edited templates and the automatically generat-ed templates into our system. The results are shown in Table 5. All the performance increased for both the template module and the translation module. The best f-score increased from 43.80% to 45.03%. We believe that more knowledge will increase the performance of our system.
5.3 Results of methods in previous works
We compared the performance of our method to the methods in previous works. The result is shown in Table 6. Chang’s method has the highest detection rate, at 91.79%. Note that the price of this high detec-tion rate is the high false alarm. The corresponding precision is only 0.94%. The precision mode in our method has the highest precision, correction, and f-score. The comparison is shown in Figure 2. The ho-rizontal axis is the size of confusion sets in our expe-riment. We can find that the performances converge. That is, the size of confusion sets is large enough to detect and correct errors in students’ essays.
5.4 Comparison to methods in previous works related to sentences with errors
The numbers in Table 6 are much lower than that in the original paper. The reason is the false alarms in sentences without any errors, since most previous works tested their systems on sentences with errors only. In addition, our test set was built on real essays, and there were only one or two errors in an essay. Most of the sentences contained no errors. The pre-vious methods tend to raise false alarms.
To clarify this point, we designed the last experiment to test the methods on sentences with at least one er-ror. We extracted 949 sentences from our test set. Among them, 883 sentences have one error, 61 sen-tences have two errors, 2 sensen-tences have three errors, 0%
10% 20% 30% 40% 50% 60% 70%
1 2 3 4 5 6 7 8 9 10
Top N of Confusion sets
Precision
Chang Lin Huang PM DM
10% 20% 30% 40% 50% 60% 70% 80% 90% 100%
1 2 3 4 5 6 7 8 9 10
Top N of Confusion sets
Detection
0% 10% 20% 30% 40% 50% 60% 70%
1 2 3 4 5 6 7 8 9 10
Top N of Confusion sets
Correction
0% 5% 10% 15% 20% 25% 30% 35% 40% 45% 50%
1 2 3 4 5 6 7 8 9 10
Top N of Confusion sets
and 3 sentences that have four errors. The result is shown in Table 7. All the methods have better per-formance. The precision of Chang’s method rose from 3% to 43%. The precision of Lin’s method rose from 3.5% to 61%. The precision of Huang’s method rose from 27% to 84%, while PM’s precision rose from 60% to 97% and DM’s precision rose from 7% to 62%. The detection mode of our system still has the highest f-score.
The differences of performances in Table 7 and Table 6 show that, systems in previous works tent to have false alarms in sentences without errors.
5.5 Processing time comparison
Processing complexity was not discussed in previous works. Since all the systems require different re-sources, it is hard to compare the time or space com-plexity. We list the average time it takes to process an essay for each method on our server as a reference. The processing time is less than 0.5 second for both our method and Huang’s method. Lin’s method re-quired 3.85 sec and Chang’s method rere-quired more than 237 seconds.
6
Conclusions
In this paper, we proposed a new Chinese character checker that combines two kinds of technology and compared it to three previous methods. Our system achieved the best F-score performance by reducing the false alarm significantly. An error model adopted from the noisy channel model was proposed to make use of the frequency of common errors that we col-lected from a training set. A simplified version of automatic template generation was also proposed to provide high precision character error detection. Fine tuning of the system can be done by adding more templates manually.
The experiment results show that the main draw-back of previous works is false alarms. Our systems have fewer false alarms. The combination of two in-dependent methods gives the best results on real world data. In the future, we will find a way to com-bine the independent methods with theoretical foun-dation.
Acknowledgement
This study is conducted under the “Intelligent Web - enabled Service Research and Development Project” of the Institute for Information Industry which is sub-sidized by the Ministry of Economy Affairs of the Republic of China.
References
Brown, Peter F., Stephen A. Della Pietra, Vincent J. Della Pietra, and Robert L. Mercer. (1993). The ma-thematics of statistical machine translation:
Parame-ter estimation. Computational Linguistics 19 (pp. 263-311).
Chang, C.-H. (1995). A New Approach for Automatic Chinese Spelling Correction. In Proceedings of Natural Language Processing Pacific Rim Sympo-sium, (pp. 278-283). Korea.
Chen, S. F., & Goodman, J. (1996). An Empirical Study of Smoothing Techniques for Language Modeling. Proc. of the 34th annual meeting on As-sociation for Computational Linguistics, (pp. 310-318). Santa Cruz, California.
Chen, Y.-Z., Wu, S.-H., Lu, C.-C., & Ku, T. (2009). Chinese Confusion Word Set for Automatic Gen-eration of Spelling Error Detecting Template. The 21th Conference on Computational Linguistics and Speech Processing (Rocling 2009), (pp. 359-372). Taichung.
CKIP. (1999). AutoTag. Academia Sinica.
Huang, C.-M., Wu, M.-C., & Chang, C.-C. (2007). Error Detection and Correction Based on Chinese Phonemic Alphabet in Chinese Text. Proceedings of the Fourth Conference on Modeling Decisions for Artificial Intelligence (MDAI IV), (pp. 463-476).
Hung, T.-H., & Wu, S.-H. (2008). Chinese Essay Er-ror Detection and Suggestion System. Taiwan E-Learning Forum.
Lin, Y.-J., Huang, F.-L., & Yu, M.-S. (2002). A CHINESE SPELLING ERROR CORRECTION SYSTEM. Proceedings of the Seventh Conference on Artificial Intelligence and Applications (TAAI).
Liu, C.-L., Tien, K.-W., Lai, M.-H., Chuang, Y.-H., & Wu, S.-H. (2009). Capturing errors in written Chi-nese words. Proceedings of the Forty Seventh An-nual Meeting of the Association for Computational Linguistics (ACL'09), (pp. 25-28). Singapore.
Liu, C.-L., Tien, K.-W., Lai, M.-H., Chuang, Y.-H., & Wu, S.-H. (2009). Phonological and logographic in-fluences on errors in written Chinese words. Pro-ceedings of the Seventh Workshop on Asian Lan-guage Resources (ALR7), the Forty Seventh An-nual Meeting of the Association for Computational Linguistics (ACL'09), (pp. 84-91). Singapore.
Ma, W.-Y., & Chen, K.-J. (2003). A Bottom-up Merging Algorithm for Chinese. Proceedings of ACL workshop on Chinese Language Processing, (pp. 31-38).
MOE. (2007). MOE Dictionary new edition. Taiwan: Ministry of Education.
Ren, F., Shi, H., & Zhou, Q. (1994). A hybrid ap-proach to automatic Chinese text checking and er-ror correction. In Proceedings of the ARPA Work shop on Human Language Technology, (pp. 76-81).
errors in Chinese text based on feature and learning. Proceedings of the 3rd world congress on Intelli-gent Control and Automation, (pp. 2744-2748). He-fei.
Zhang, L., Zhou, M., Huang, C., & Sun, M. (2000). Automatic Chinese Text Error Correction Approach Based-on Fast Approximate Chinese Word-Matching Algorithm. Proceedings of the 3rd world congress on Intelligent Control and Automation, (pp. 2739-2743). Hefei.
Table 4. Results of our initial system
Top 1 2 3 4 5 6 7 8 9 10
TM
P 5.74% 5.63% 5.21% 5.02% 4.90% 4.65% 4.36% 4.12% 4.06% 3.95%
D 29.23% 41.25% 45.36% 49.17% 52.00% 53.47% 54.94% 55.13% 56.79% 57.09%
C 26.00% 36.75% 40.08% 43.40% 45.65% 46.33% 46.92% 46.82% 48.00% 48.58%
F 9.40% 9.76% 9.23% 8.99% 8.85% 8.46% 7.99% 7.58% 7.49% 7.31%
LMM
P 14.28% D 58.06% C 50.63% F 22.28%
PM
P 55.52% 60.03% 60.60% 61.58% 60.65% 61.68% 60.51% 61.19% 58.82% 59.03%
D 21.60% 29.52% 31.28% 32.74% 34.21% 34.31% 34.31% 33.91% 35.19% 34.79%
C 21.60% 29.42% 31.18% 32.64% 34.01% 34.11% 34.01% 33.62% 34.89% 34.50%
F 31.10% 39.49% 41.17% 42.67% 43.58% 43.93% 43.55% 43.40% 43.80% 43.55%
DM
P 7.32% 6.15% 5.64% 5.33% 5.11% 4.87% 4.62% 4.42% 4.30% 4.19%
D 62.75% 65.59% 67.44% 69.40% 70.38% 71.06% 71.94% 72.23% 72.62% 72.72%
C 54.05% 56.69% 58.16% 59.62% 60.60% 60.99% 61.68% 61.77% 61.58% 61.68%
F 12.89% 11.10% 10.28% 9.79% 9.43% 9.02% 8.60% 8.25% 8.04% 7.85%
Table 5. Results of our system after adding more knowledge and enlarged the train set
Top 1 2 3 4 5 6 7 8 9 10
TM
P 7.31% 6.45% 5.73% 5.41% 5.12% 4.83% 4.51% 4.26% 4.20% 4.08%
D 37.93% 47.70% 50.15% 53.18% 54.45% 55.62% 56.89% 57.09% 58.75% 59.04%
C 34.70% 43.21% 44.87% 47.41% 47.70% 48.48% 48.88% 48.78% 49.95% 50.54%
F 12.08% 11.23% 10.17% 9.70% 9.25% 8.79% 8.26% 7.84% 7.74% 7.55%
LMM
P 14.03% D 63.14% C 55.52% F 22.40%
PM
P 59.95% 62.72% 62.50% 62.88% 60.66% 61.72% 59.51% 60.29% 58.08% 58.54%
D 27.66% 34.21% 35.19% 36.26% 35.58% 35.77% 35.77% 35.48% 36.85% 36.85%
C 27.66% 34.11% 35.09% 36.16% 35.48% 35.67% 35.58% 35.28% 36.65% 36.65%
F 37.85% 44.19% 44.95% 45.92% 44.77% 45.21% 44.53% 44.51% 44.94% 45.08%
DM
P 7.76% 6.46% 5.85% 5.51% 5.28% 5.04% 4.78% 4.57% 4.45% 4.33%
D 69.50% 71.26% 72.04% 73.50% 74.48% 75.26% 75.95% 76.05% 76.34% 76.34%
C 60.50% 62.17% 62.65% 63.73% 64.71% 65.29% 65.78% 65.68% 65.39% 65.39%
F 13.76% 11.70% 10.70% 10.14% 9.76% 9.36% 8.91% 8.55% 8.33% 8.12%
Table 6. Results of methods in previous works
Top 1 2 3 4 5 6 7 8 9 10
Chang
P 2.82% 1.95% 1.63% 1.43% 1.25% 1.13% 1.07% 0.98% 0.94% 0.91%
D 72.04% 81.72% 84.55% 88.27% 89.54% 90.32% 91.50% 91.50% 91.79% 91.59%
C 27.66% 39.10% 43.30% 45.45% 44.77% 45.16% 46.33% 45.26% 43.30% 44.28%
F 5.11% 3.71% 3.14% 2.77% 2.43% 2.21% 2.08% 1.92% 1.83% 1.77%
Lin
P 3.59% 3.19% 2.93% 2.82% 2.60% 2.51% 2.39% 2.35% 2.32% 2.31%
D 25.12% 28.93% 29.91% 31.18% 30.98% 31.37% 31.18% 31.57% 32.16% 32.74%
C 19.45% 25.51% 26.78% 27.95% 28.05% 28.15% 28.25% 28.25% 28.73% 29.42%
F 6.06% 5.67% 5.28% 5.12% 4.76% 4.61% 4.41% 4.34% 4.29% 4.28%
Huang
P 27.02% 25.81% 25.02% 24.05% 23.30% 22.54% 22.04% 21.16% 20.98% 20.62%
D 10.75% 17.79% 23.06% 26.00% 28.54% 30.49% 31.37% 31.86% 33.33% 33.43%
C 8.30% 12.02% 15.54% 17.00% 17.39% 18.57% 19.64% 18.76% 17.69% 18.27%
F 12.70% 16.40% 19.17% 19.92% 19.92% 20.36% 20.77% 19.89% 19.20% 19.37%
Table 7. Results of methods in previous works on sentences with errors
Top 1 2 3 4 5 6 7 8 9 10
Chang
P 42.94% 37.21% 33.30% 31.18% 29.31% 27.19% 25.98% 24.48% 23.61% 23.14%
D 72.33% 81.62% 84.55% 88.26% 89.63% 90.51% 91.78% 91.79% 92.08% 91.89%
C 27.95% 39.58% 43.98% 46.23% 45.65% 46.04% 47.31% 46.14% 44.28% 45.26%
F 33.86% 38.36% 37.90% 37.24% 35.70% 34.19% 33.54% 31.99% 30.80% 30.62%
Lin P 60.59% 59.33% 57.32% 57.19% 55.10% 55.35% 54.27% 53.88% 53.80% 53.97%
C 19.55% 25.80% 27.37% 28.64% 29.03% 29.52% 29.61% 29.52% 30.00% 30.69%
F 29.56% 35.96% 37.05% 38.17% 38.03% 38.50% 38.32% 38.14% 38.52% 39.13%
Huang
P 84.16% 76.99% 78.51% 76.11% 73.66% 74.07% 73.21% 70.19% 66.23% 66.66%
D 9.87% 16.03% 20.72% 23.36% 25.70% 27.37% 28.05% 28.54% 29.91% 29.91%
C 7.62% 10.85% 14.17% 15.64% 15.83% 16.71% 17.79% 17.20% 16.12% 16.61%
F 13.97% 19.02% 24.01% 25.95% 26.06% 27.27% 28.62% 27.63% 25.93% 26.59%
PM
P 96.72% 96.66% 96.76% 96.57% 96.51% 96.54% 96.54% 96.23% 96.11% 96.10%
D 25.90% 31.09% 32.16% 33.04% 32.45% 32.75% 32.75% 32.45% 33.82% 33.72%
C 25.90% 30.98% 32.06% 32.94% 32.36% 32.65% 32.55% 32.26% 33.63% 33.53%
F 40.86% 46.92% 48.16% 49.13% 48.46% 48.80% 48.69% 48.32% 49.82% 49.71%
DM
P 61.83% 58.45% 56.46% 54.75% 54.21% 53.48% 52.80% 51.53% 51.15% 50.45%
D 69.20% 70.97% 71.74% 73.22% 74.19% 74.98% 75.66% 75.76% 76.05% 76.05%
C 55.62% 57.28% 57.77% 58.84% 59.82% 60.41% 60.90% 60.80% 60.51% 60.51%