Simple setup for rapid testing of third-order nonlinear
optical materials
Paul Horan, Werner Blau, Hugh Byrne, and Per Berglund
A relatively inexpensive and versatile degenerate four-wave mixing setup is described utilizing a nitrogen laser pumped dye laser. Samples can be screened rapidly, which is demonstrated with the example of a semiconductor doped glass having a nonlinear susceptibility X(3) - 1011-10-10 esu.
1. Introduction
The field of nonlinear optics is concerned with the response of matter to high intensity light fields, such as are obtained with lasers. There is great interest in the
subject, from the point of view of basic physics, and of
possible applications. Nonlinear effects such as opti-cal bistability and phase conjugation offer the possibil-ity of all-optical signal processing, with the advantages of greater speed, integration with optical fiber technol-ogy, and the possibility of massively parallel comput-ing.' Currently available materials do not match de-vice requirements and so this field is dominated by the search for materials possessing a larger and/or faster nonlinear response.
To this end we have developed a simple measure-ment setup which allows routine testing of samples to be carried out rapidly (currently approximately one sample per day) and inexpensively. The method has been applied to molecular, polymeric, and colloidal materials as well as bulk and quantum-confined semi-conductors and is illustrated here with the particular example of semiconductor doped glasses.
11. Laser-Induced Grating Techniques
To study the nonlinear optical response of a particu-lar material some method of altering the optical prop-erties and investigating the changes is required. One such technique is a laser-induced grating (LIG).2 Es-sentially, the procedure is to have two coherent light
The authors are with Trinity College, Department of Pure & Applied Physics, Dublin 2, Ireland.
Received 14 December 1988. 0003-6935/90/010031-06$02.00/0. © 1990 Optical Society of America.
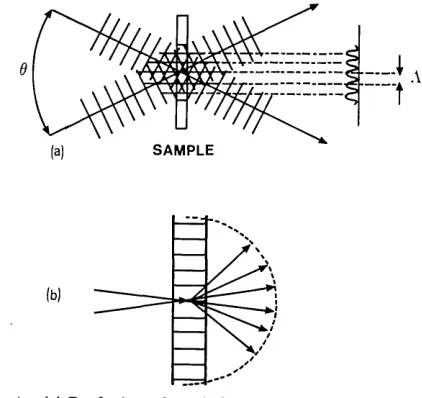
beams overlap and thus interfere. This will produce a spatially modulated energy density in the interference region, with a period A where
A = X/2 sin(0/2), (1)
where 0 is the angle between the writing beams and X is the wavelength. The sample to be studied is placed in this region and with sufficient intensity a modulation of the material absorption Aa and/or refractive index
Al will be produced [see Fig. 1(a)]. The spatial
modu-lation of the optical parameters corresponds to an optical diffraction grating. The grating may be inves-tigated by observing the diffraction of a probe beam, the diffraction efficiency depending on the degree of modulation induced. In absorbing samples an effec-tive optical thickness d,
d = (1 - T)Ia, (2)
can be defined where a is the absorption coefficient for a (physical) sample length 1 and T = exp(-al) the sample transmission. For small absorption (a - 0)
d = 1 holds. In considering diffraction the separate
regimes of thick and thin gratings must be identified. If the spacing of the created grating is the thickness as sample d, the Bragg condition must be satisfied, i.e., the angle of incidence must be equal to the angle of diffraction. In this thick regime essentially only one diffracted beam is observed. For a sufficiently thin sample the Bragg condition is relaxed. A grating is considered thin if the optical path difference of the diffracted beams is small compared to the wavelength. For near normal incidence this condition is satisfied if
d << 2A2/A. (3)
In this case, diffraction will occur for any incident wave
vector and a series of diffracted orders will be
ob-served, as shown in Fig. 1(b).
The problem of Bragg diffraction from a thick holo-graphic grating has been considered by Kogelnik.3
For the general case of a mixed grating due to changes of absorption Aa and of refractive index An, the
dif-fraction efficiency is given by
I1I O = exp(-2ad) sin2 r nd + sinh2 Aa) (4)
(a) SAMPLE
For a pure phase grating, i.e., Aa = 0, this simplifies4to
(5)
For a pure amplitude grating (ij = 0), Eq. (4) simpli-fies to
II
(ad/2)
2.
(6)These relationships hold for thin gratings also as the diffraction to higher orders is negligible when com-pared with the first order.
There are many possible geometries utilizing the LIG techique. The grating can be created by two beams and monitored with a third independent beam of the same or different wavelength. If the writing beams are pulsed, the decay of the grating can be studied by delaying the probe beam with respect to the creation of the grating or alternatively by using a cw probe. Very short (subpicosecond) time scale events
can be monitored by creating a moving grating, which can be done by interfering two beams of different frequency (for overview see Ref. 2).
For sufficiently small absorption and thin grating conditions the two beams writing the grating will si-multaneously self-diffract from the grating being cre-ated. In this case a series of diffraction orders will be observed to either side of the straight-through beams, spaced at approximately the angle between the writing beams. Although not as versatile as the three-beam techniques, the self-diffraction arrangement is much simpler to achieve experimentally. Also it is amenable to treatment using established degenerate four-wave
mixing theory (see below).
An obvious disadvantage of the two-beam self-dif-fraction arrangement is the apparent lack of temporal resolution. Consider if the first-order diffracted beam is monitored while one pump is delayed with respect to the other by a time t. The system would be expected to act as an autocorrelator, with a response time equal to that of the pulses. However, by using phase modu-lated picosecond pulses (frequency width Av), more information may be gained. Phase modulated pulses are such that the coherence time of the pulse r, where
T = /Av, is much less than the pulse duration T. Self-diffraction with such pulses has been considered by Vasileva et al.5and the behavior is shown to depend on the ratio between the coherence time Tc and the relax-ation time Tr of the excited state giving rise to the grating. For slow relaxation, i.e., r >> , the
diffract-ed energy should decay with a width T-r When the decay is fast, i.e., Tr <<
r,
a width equal to the pulse width Twill be observed. Thus the resolution may be improved to equal the coherence time. However in-termediate behavior is not resolved by this method.Fig. 1. (a) Producing a laser-induced grating and (b) diffraction from thin gratings.
111. Degenerate Four-Wave Mixing and Self-Diffraction at a LIG
One well-known geometry used to study third-order processes is the so-called degenerate four-wave mixing (DFWM).6 In this configuration, three different light fields E1, E2, and E3 of the same frequency (hence degenerate) are incident on a nonlinear medium. The three beams interact with the material to produce a fourth beamE4. GenerallyE1andE2are known as the
pump beams and are much stronger than the third beam known as the probe. DFWM can also be viewed as a LIG phenomenon. The grating is created by interference between E1 and E3, and E2 diffracts off this grating to give E4. Similarly the self-diffraction effect may be viewed as forward degenerate four-wave mixing. However, in this case the probe beam is equal to and collinear with one of the pump beams. For this geometry the magnitude of the third-order
susceptibil-ity can be calculated7 as
8c2n2e a./;j
X(3) 0 =
~~~~~~~~(7)
3w1
(l
-2*)
where c is the speed of light, n is the linear refractive index, a is the linear absorption, X is the frequency, I,
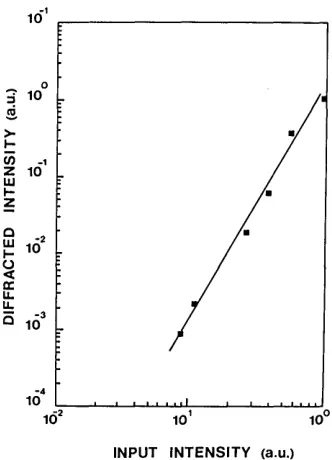
is the pump intensity, and T is the transmission at I. This allows the calculation of an effective third-order susceptibility from experimental measurements of the self-diffraction effect and knowledge of some physical parameters of the material. It should be noted that for constant X(3) the diffraction efficiency depends qua-dratically, and thus the diffracted signal cubically, on the incident intensity I,, as expected, for a third-order nonlinear process.
IV. Experimental Technique for Laser-Induced Grating Studies
To investigate the nonlinear response of materials, laser-induced grating (LIG) measurements are usually carried out near the principal absorption maximum of
A
II/Io _ (7rAnd/X)2.
I
I
[image:2.544.301.512.34.233.2]the material. This requires a tunable source of coher-ent light which was supplied by a nitrogen-pumped dye laser system (PRA LN1000 high pressure nitrogen laser and a PRA LN 107 high resolution dye laser8). Depending on the dye, the final output is a pulse of 40-100 ,MJ. The nitrogen pump pulse has a width of 800 ps, but due to thresholding effects in the dyes the LN107 has a rated output pulse length of 500 ps. Ob-servation of the output with a vacuum photodiode and a fast storage oscilloscope yielded a pulse width of 550
± 50 ps. However, examination with a streak camera revealed some substructure in the pulse, which varied somewhat depending on the dye and tuning, and places an error of +20% on the determination of laser intensity.
The experimental setup is illustrated in Fig. 2. The lasers and all-optical components are on a 4 X 8-ft sheet of steel. This allows the use of magnetic mounts which provide a firm, yet versatile, mounting scheme.
The output from the dye laser is collimated and brought around the table into a 50-50 beam splitter cube. To achieve temporal overlap of the pulses, a delay line is introduced on one arm; this is especially necessary because of the very short coherence length (-4 mm) of the pulses. The extra dispersion intro-duced by the prisms in the delay line is balanced by using two prisms to turn the second beam. The two collinear beams are brought to a focus and overlap by a
30- or 50-cm focal length lens. The beam waist is
calculated using a series of calibrated pinholes and assuming a Gaussian beam profile, which is verified by an optical multichannel analyzer. To ensure that the beams overlap exactly in the sample, the turning prisms may be steered with micrometer positioning screws and adjusted to maximize the diffracted beam. When a material with a suitable nonlinear response is introduced into the overlap region, self-diffraction will occur. This may be observed by monitoring the beams on the opposite side of the sample. Two bright spots will be seen, corresponding to the straight-through
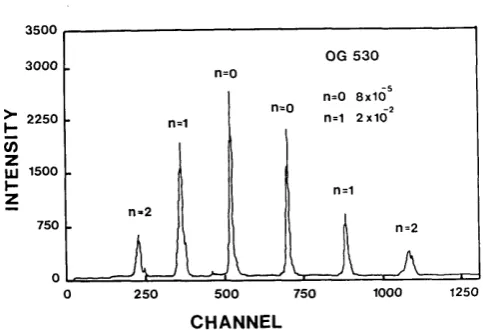
beams. To either side, fainter spots at about the spac-ing between the pump beams appear correspondspac-ing to the diffracted beams. For highly nonlinear materials several orders may be observed. To illustrate this, the beams were imaged onto the linear CCD array of an optical multichannel analyzer system from B & M Spektronix. A typical image using a Schott
semicon-ductor doped glass OG 530 is shown in Fig. 3, where the
beams have been attenuated as indicated to lie within the dynamic range of the camera. The slight asymme-try results from the beams not being exactly equal in intensity.
To check that what is observed is truly due to dif-fraction rather than to some scattered light, the signal should disappear if either of the pump beams is blocked, i.e., the system should act as an optical AND
gate. In practice, when measuring the magnitude of the diffracted beam the signal obtained with the nearer pump beams blocked was also measured and subtracted from the diffracted signal. This removes the component due to background scatter and it also
BS
PD
Fig. 2. Experimental arrangement for observing self-diffraction from a laser-induced grating.
3500
3000
i_ 2250 In W 1500
z
750
0
0 250 500 750 1000 1250
CHANNEL
Fig. 3. CCD camera/OMA image of the diffracted orders. The zeroth and first orders are attenuated as noted.
ensures that only a transient grating is measured. Permanent gratings can be written by physical damage to a material or by other photochemical effects such as the darkening phenomenon. This precaution greatly improves result reliability.
For normal operation the first diffracted order was aligned through a narrow pinhole to reduce scattered light and then incident on a large area silicon photodi-ode. Suitable neutral density filters were used to avoid saturating the photodiode response. The out-put voltage pulse is proportional to the inout-put energy and is calibrated using a Gentec ED-1OA fast-re-sponse pyroelectric detector. The voltage was mea-sured using a Vuko VKS 220-16 digital storage oscillo-scope. For ease of operation the scope had been interfaced with a BBC microcomputer. This allowed a specified number of pulses to be measured and aver-aged, the results then being displayed or stored on disk. The system can handle two channels allowing the simultaneous monitoring of the input and
diffract-ed energies.
[image:3.538.264.497.36.175.2] [image:3.538.263.505.234.399.2]V. Experimental Results from LIG Measurements
The above apparatus was used to study self-diffrac-tion in Schott CdSxSelx doped glasses. An earlier LIG study of these glasses by Eichler et al.9had report-ed saturable absorption. On monitoring the diffract-ed intensity with increasing input intensity at a fixdiffract-ed (ruby) wavelength, they observed the expected cubic behavior at low intensities, with a less than cubic de-pendence at higher intensities, indicative of absorp-tion saturaabsorp-tion. Similar measurements were carried out, but showed only the cubic behavior predicted by Eq. (7), i.e., the intensities available were insufficient to achieve appreciable saturation. Typical results are
shown in Fig. 4.
In an effort to understand the nonlinear mechanism operating wavelength-resolved measurements were carried out across the bandgap. On measuring the diffraction efficiency, a maximum is usually observed for a sample transmission of 20-30%. This behavior may be explained qualitatively as a trade-off between increasing coupling of the pump beams vs increasing absorption of the signal, giving some maximum. Re-sults are shown in Fig. 5. Subtraction of the signal obtained with one pump beam blocked, as described in the previous section, ensures that only the transient grating is measured, removing any contribution from any permanent grating which may be created by the darkening effect observed in those glasses due to long-lived carrier trapping effects.'0
Having measured the diffraction efficiency, Eq. (7) was used to calculate an effective third-order suscepti-bility. The results of these calculations, together with the absorption spectrum for the OG 530 glass, are illustrated in Fig. 6. The third-order susceptibility is of the order observed by other workers.9-'2 The major point to note is the linear relation between absorption and X(3) Similar dependence on absorption has also been observed by Roussignol et al.10 The actual mea-sured susceptibilities of 10-1o-10-11 esu are not very large for semiconductor materials. It must be noted however that the glass is only doped at a volume factor of 10-3-10-4, so the effective susceptibility per active volume is appreciable.
The initial report on DFWM in glasses by Jain and Lind" suggested that the nonlinearity was due to plas-ma generation. They achieved reasonable numerical agreement for X(3) at a fixed wavelength (532 nm), but the plasma model predicts a strong resonance at the bandgap which is not observed. The simple two-level
saturation model, see, e.g., Caro and Gower,7 is also
excluded, as it predicts X(3) - (aX)2. Band filling is a
likely effect and has been suggested by Roussignol et
al.'0 and Olbright et al.12 Band filling arises from relaxation of free carriers to the band extrema before recombination and thus blocking these transitions. That the carriers relax and fill all the lowest lying states up to some level is a result of applying
Fermi-10
0
10
10101
S
z~~~~~~~~~~~~~
Lu-2
1
Z10
I
-4U
0U
16 0 0
INPUT INTENSITY (a.u.)
Fig. 4. Typical logarithmic plot of diffracted intensity vs incident intensity. The fit is to a slope of 3; sample OG 530; wavelength 21
nm.
"I
n
'a-II
8
6
4
2
o L 598
15
E 10
5
.J 0 630
WAVELENGTH (nm)
Fig. 5. Measured diffraction efficiency for Schott glass RG 610.
12 D
,0 -x
.X
RG 610 (Cd Se4 5)
10
8
6
4
2
0 590 600 60 0I 6
590 600 610 620 630
20
15
10 E
5 t
0
WAVELENGTH (nm)
Fig. 6. Calculated third-order nonlinear susceptibility (solid cir-cles) and linear absorption coefficients (curves) for Schott glass RG
[image:4.544.330.496.30.260.2] [image:4.544.313.516.317.493.2] [image:4.544.293.528.538.675.2]Dirac statistics. An analysis of this effect13 predicts
that
X(3 a(W)/(Wg - W). (8)
This is not in agreement with results. Operating close to the band edge, as has been done, means that the detuning factor in Eq. (8) should be significant, but this is not observed.
Band filling has also been considered with nonde-generate Boltzmann statistics.14 In this case X(3) is
essentially dependent on absorption only. This model has been discussed by Roussignol et al.,10 and it can also account for their saturation observations. They argue that Boltzmann statistics are applicable in this case, working at room temperature and in the absorp-tion tail. In agreement with the data presented here, this model does provide a reasonable explanation for the primary nonlinear mechanism in these glasses, where essentially bulk behavior is to be expected.
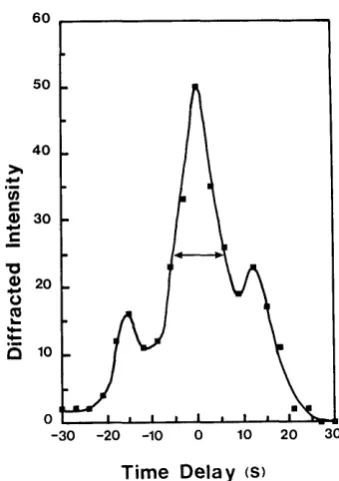
Delaying one pulse with respect to the other does yield some information for phase modulated pulses, as outlined in Sec. II. Phase modulated means that the coherence time of the pulse r, is much shorter than the pulse length T. The LN1000/LN107 combination produces pulses of 500 ps, but the narrow spectral bandwidth of <0.5 A corresponds to a coherence time <17 ps at 500-nm wavelength, so these pulses well satisfy the definition of being phase modulated in the
visible region. Results for the glass RG 610 are shown
in Fig. 7. The FWHM corresponds to 12ps, which can be taken to be the coherence time. This indicates that the relaxation time of the principal mechanism giving rise to the grating is long compared with 12 ps. The sidelobes observed are due to a small secondary pulse along with the main one, as also suggested by streak camera readings. The lower limit of 12 ps is reason-able at these intensities. In fact, the wide discrepancy in reported relaxation times, from 10 ps (Ref. 15) to 72 AS,16indicates the problems that exist with these mate-rials. Recombination of an excited population of car-riers can be expected to be some combination of direct recombination, surface recombination, followed by de-cay of trapped carriers. Measured recombination times have been observed by several groups to be strongly intensity dependent. As an example, in the glass RG 610 the measured grating decay constant went from '10 to 2 ps for intensities of 1 and 5 GW/ cm2, using 0.5-ps pulses. The mechanism of this in-tensity dependence is unclear, although Auger recom-bination has been suggested.17 The situation is fur-ther complicated by the knowledge that the time scale is altered by the photochemical darkening effect.10 For fresh, undarkened samples, a slow decay of a grat-ing is observed on the scale of tens of nanoseconds. However, working with a darkened area of the same
glasses, a fast component of 50-100 ps is reported. A
similar variation is seen in the temporal decay of pho-toluminescence from fresh and darkened samples. A full explanation of the temporal evolution of an excited state population must still be found.
60
50
40
._
C
0
I..
46-In 30
20
10
0 I 1 . I I I * I . I w
[image:5.538.292.462.28.269.2]-30 -20 -10 0 10 20 30
Fig. 7.
Time Delay (s)
Diffracted intensity vs delay for Schott glass RG 610; wave-length 600 nm.
VI. Conclusions
These results demonstrate the versatility and use-fulness of the experimental setup described. Further-more, they elucidate some properties of the semicon-ductor doped glass: The first point that should be made is that the commercially available semiconduc-tor doped glasses are not quantum confined systems. The observed behavior can be explained in terms of bulk semiconductor properties, albeit modified by the large surface-to-volume ratio of such small particles. They possess a large nonlinear optical response when the small volume ratio is considered, operating on a picosecond scale if suitably treated. The principal nonlinear mechanism appears to be band filling but greatly modified by the secondary darkening effect and the large surface area available. The detailed understanding of the recombination process is not yet
clear.
As inexpensive and readily available nonlinear opti-cal materials semiconductor doped glasses will contin-ue to be of interest. The wide operating spectrum makes them very versatile. They are excellent for aligning a nonlinear optical experiment. Applications such as the fabrication of waveguides are well ad-vanced18and will ensure continued study of these most interesting materials for some time to come.
Part of this work was supported by the Commission of the European Communities under the RACE pro-gram and also by EOLAS, the Irish Science &
Technol-ogy Agency.
P. Berglund is a visiting student from Lund Univer-sity, Sweden.
References
1. C. Flytzanis and J. L. Oudar, Eds., Nonlinear Optics: Materi-als and Devices (Springer-Verlag, Berlin, 1985).
2. H. J. Eichler, P. Gunter, and D. W. Pohl, LaserInducedDynam-ic Gratings (Springer-Verlag, Berlin, 1986).
3. H. Kogelnik, "Coupled Wave Theory for Thick Hologram Gra-tings," Bell Syst. Tech. J. 48, 2909-2947 (1969).
4. H. J. Eichler, "Laser-Induced Grating Phenomena," Opt. Acta 24, 631-642 (1977).
5. M. A. Vasileva, J. Vishakas, V. Kalbelka, and A. V. Masalov, "Measurement of Relaxation Times by Phase Modulated Ultra-short Light Pulses," Opt. Commun. 53, 412-416 (1985). 6. R. A. Fisher, Ed., Optical Phase Conjugation (Academic,
Orlan-do, 1984).
7. R. C. Caro and M. C. Gower, "Phase Conjugation by Degenerate Four-Wave Mixing in Absorbing Media," IEEE J. Quantum Electron. QE-18, 1375-1380 (1982).
8. PRA International, 45 Meg Drive, London, Ontario, Canada. 9. H. J. Eichler, G. Enterlein, P. Glozbach, J. Munschau, and H.
Stahl, "Power Requirements and Resolution of Real-Time Ho-lograms in Saturable Absorbers and Absorbing Liquids," Appl. Opt. 11, 372-375 (1972).
10. P. Roussignol, D. Ricard, J. Lukasik, and C. Flytzanis, "New Results on Optical Phase Conjugation in Semiconductor-Doped Glasses," J. Opt. Soc. Am. B 4, 5-13 (1987).
11. R. K. Jain and R. C. Lind, "Degenerate Four-Wave Mixing in Semiconductor-Doped Glasses," J. Opt. Soc. Am. 73, 647-653 (1983).
12. G. R. Olbright, N. Peyghambarian, S. W. Koch, and L. Banyai, "Optical Nonlinearities of Glasses Doped with Semiconductor Microcrystallites," Opt. Lett. 12,413-415 (1987).
13. B. S. Wherrett and N. A. Higgins, "Theory of Nonlinear Refrac-tion Near the Band Edge of a Semiconductor," Proc. R. Soc. London Ser. A 379, 67-90 (1982).
14. D. A. B. Miller, C. T. Seaton, M. E. Prise, and S. D. Smith, "Band-Gap-Resonant Nonlinear Refraction in III-V Semicon-ductors," Phys. Rev. Lett. 47, 197-200 (1981).
15. D. Cotter, "Time-Resolved Picosecond Optical Nonlinearity in Semiconductor-Doped Glasses," Electron. Lett. 22, 693-694 (1986).
16. J. T. Remillard and D. G. Steel, "Narrow Nonlinear-Optical Resonances in CdSSe-Doped Glass," Opt. Lett. 13, 30-32
(1988).
17. F. de Rougement, R. Frey, P. Roussignol, D. Ricard, and C. Flytzanis, "Evidence of Strong Auger Recombination in Semi-conductor-Doped Glasses" Appl. Phys. Lett. 50, 1619-1621 (1987).