Munich Personal RePEc Archive
Workers’ health and social relations in
Italy
Fiorillo, Damiano
Università di Napoli Parthenope
September 2014
Online at
https://mpra.ub.uni-muenchen.de/58784/
Workers' health and social relations in Italy
Damiano Fiorillo1*
Abstract
The paper investigates whether social relations are associated with the health of workers after controlling for demographic and worker characteristics, housing features, neighbourhood quality, size of municipality and regional dummies. We consider two level of social relationships: i) individual social relations that we proxy by the frequency of meetings with
friends, and; ii) contextual social relations, the average frequency with which people meet friends at the community level. A Heckman selection model is estimated from the worker sample, employing both self-reported and objective health measures using new data from an income and living conditions survey carried out in 2006 by the Italian Statistics Office (IT-SILC). Results show that social relations at the individual level are positively correlated with self-perceived health, negatively associated with chronic condition but not related to limitations in daily activities. Contextual social relations are negatively linked with chronic condition and limitations in daily activities but not correlated with self-perceived health.
JEL Codes: C35; I12; I18; Z1
Keywords: self-perceived health, chronic condition, limitations in daily activities, social relations, income, work conditions, Italy.
1
1. Introduction
The positive association between health and social factors, such as social trust, social relations and membership in various kinds of associations, is one of the most robust findings in the health economics literature (Petrou and Kupek 2008; D’Hombres et al. 2010). Indeed, the association between social factors and health of populations has been examined at the individual level (Carlson 1998; Lindstrom et al. 2004), the aggregate level (Kawachi et al. 1997, 1999), and at both (Poortinga et al. 2006a,b). Finally, the evidence also suggests that health outcomes are correlated with working life, including adverse working conditions (Fletcher et al. 2011; Robone et al. 2011). However, few papers have empirically investigated the extent to which social factors at the individual and collective level are associated to the condition of the labour market and in turn to health status (Yamamura 2011). The current paper links the above research strands by analysing whether social relations at the individual and collective level are correlated to the health of workers. In so doing, the paper is the first to relate individual and contextual social relations simultaneously to workers’ health.
We analyse new data from an income and living conditions survey carried out in 2006 by the Italian Statistics Office (IT-SILC) to consider two aspects of social relationships: i)
individual social relations that we proxy by the frequency of meetings with friends and ii)
contextual social relations that we measure by the average frequency with which people meet friends at the community level. We employ two types of health status measures: self-reported and objective health. The former is measured through self-perceived health (SPH), the latter from chronic conditions (CC) and limitations in activities of daily living (ADLs). We use probit and ordered probit models after accounting for the possibility of selecting individuals in the labour market by a Heckman selection model.
Basing our hypotheses on research in social epidemiology and health economics, we argue that individual and contextual social relations can influence health of workers in a number of ways. More intense individual social relationships may facilitate individuals’ access to social support and health care, and may also promote more rapid dissemination of health information. Moreover, they may exert the so-called “buffering effect”, balancing the adverse consequences of stress and anxiety through the provision of affective support and by acting as a source of self-esteem. Finally, contextual social relations may serve as a “public good” with positive spillover effects onto the health of the broader community.
a determinant of job satisfaction, increasing self-perceived health not only directly, but also indirectly. Hence, ceteris paribus, it is reasonable to think that intense social relations (individual and contextual) lead to better health, thereby affecting worker productivity and, ultimately, a society’s economic prosperity. As a result, knowing whether social relations influence workers’ health can provide useful information on key policy issues.
We find that social relations are correlated with health status of workers with differences among health outcomes. For SPH status, in line with previous studies for the whole population (Bolin et al. 2003; Hyyppä and Mäki 2003; Poortinga 2006a,b), we find the individual social relations variable positively associated with the probability of declaring good self-perceived health while the contextual social relations variable is not found statistically significant. Novel results regard chronic conditions and limitations in daily activities status. As regard CC, we find both individual and contextual social relations variables negatively linked to the likelihood of suffering from chronic conditions. For limitations in ADLs, we find contextual social relations variable negatively linked with the probability of being limited in activities of daily living while individual social relation variable is not found statistically significant.
We carry out robustness checks to deal with possible problems when interpreting our results. We address variables that simultaneously influence health status and social relations by adding several control variables concerning demographic and worker characteristics, housing features, neighbourhood quality, municipality size and regional dummies. Moreover, we add variables to capture both other social relational aspects of individual behaviour, such as membership of various kinds of associations, and other factors that might be harmful for health, such as an unmet need for medical examination and treatment. Finally, as social relations might have different effects for workers with different type of jobs, we perform a further robustness analysis, stratifying our sample according to three categories of employment types: professional, skilled and unskilled.
individual and contextual effect of social relations on individual health status of workers. In so doing, we fill a gap in the literature on social capital and public health (see Poortinga 2006a,b) which does not consider the frequency of meetings with friends as a measure of contextual social capital in health outcomes.
The remainder of the paper is structured as follows. The next section reviews the related literature and presents our hypotheses. We then describe data and methodology (Sections 3 and 4). Section 5 describes and discusses empirical results. With our concluding remarks we summarise the main issues covered and suggest avenues for future research.
2.Related literature and hypotheses
2.1 Social capital
In recent years, the literature has extensively analysed the impact of social relations on individual health. Various aspects of the relational sphere of individual lives have been addressed, from relationships with family and friends to membership of various kinds of associations, often grouped together under the common label of social capital (Fiorillo and Sabatini 2011b). The concept of social capital was brought to the attention of social science disciplines by Coleman (1988, 1990) and Putnam (1993).
According to Coleman, while the concept of "social" refers to relations among people the conception of "capital" implies that relationships are economic resources (Coleman 1988, S98; 2000, 302 and 305)2. Coleman points out that the term social capital as "resources for individuals" was introduced by the economist Loury (1977) to denote the set of resources, rooted in the family and in the community, relevant to the accumulation of human capital of children and young people. A concept used in a similar way was found, according to Coleman, in Bourdieu (1980) (Coleman 1990, 300)3. Thus, Coleman - as well Loury and Bourdieu – uses the concept in functional terms, focusing on the benefits that individuals derive from participation in a social group.
Putnam regards social capital as "features of social organisation such as trust, norms and networks that can improve the efficiency of society by facilitating coordinated actions" (1993, 167). With Putnam the concept leaves the characteristic of individual resource to become a
2
Social capital is defined by its function. It is not a single entity but a variety of different entities with two elements in common: they all consist of some aspects of social structure, and facilitate certain actions of agents – both people and firms - within the structure (Coleman 1988, S98; 1990, 302).
3
resource capable of solving problems of collective action (Portes 1998, 181). Following Putnam (1993), other studies emphasise the social dimension of collective action of social capital as "norms and social relationships that allow people to act collectively" (Woolcock 1998, 155; Narayan 1999, 6; Woolcock and Narayan 2000, 226).
However, it is widely argued that social capital can be both an individual and collective attribute (Kawachi 2006; Portinga 2006a,b; Islam et al. 2008). While community social capital informs about the aggregate level of interactions and networks in the community, individual social capital indicates the social capital of this particular person (Iversen 2008).
In the literature, some authors divide social capital into cognitive and structural components as well into formal and informal forms (Uphoff 1999; Lochner et al. 2003; Ferlander and Mäkinen 2009). On the one hand, cognitive social capital derives from individuals’ perceptions resulting in norms, values and beliefs, while structural social capital concerns individuals’ behaviours and mainly takes the form of formal and informal networks, which can be observed and measured through surveys. On the other, informal social capital entails contacts with family and friends, whereas formal social capital comprises rule-bound networks, such as voluntary associations.
In this study, we focus on structural social capital, perceived as an individual and collective resource, that is accessed via informal social relations.
2.2 Structural social capital and health
health works only at the individual level. In other words, the initial association between collective structural social capital and self-rated health disappears after controlling for individual socio-demographics variables and individual levels of structural social capital.
The aim of the present paper is to investigate the association between individual and contextual social relations (as an indicator of structural social capital) and the health of workers. In particular, we are keen to ascertain whether, with regard to this type of social capital, its health benefits for workers are simultaneously individual and collective. In so doing, the paper is the first to relate social relations to workers’ health.
In the literature on social capital and health outcomes, the only previous empirical study which explores the relation between (individual) structural social capital and health of workers is that of Yamamura (2011). Using Japanese data he finds that (individual) social capital does not influence the self-rated health status of people with a job. Some prior works, in investigating the relationship between structural social capital and health outcomes, include employment status as an independent variable (Carlson 1998; Hyyppä and Mäki 2003; Petrou and Kupek 2008; D’Hombres et al. 2010; Giordano and Lindstrom 2010; Fiorillo and Sabatini 2011b).
2.3 social relations and workers' health: suggestions
In this paper, we adopt a multilevel approach and consider two measures of social relations (as indicator of structural social capital): i) the frequency of meetings with friends, as recently studied elsewhere (Giordano and Lindstrom, 2010; Ronconi et al. 2012), that we label individual social relations and; ii) the average frequency with which people meet friends at the community level, as recently adopted by Fiorillo and Sabatini (2014), that we label contextual social relations.
Social relations may improve workers' health through the following channels:
1) Transmission of health information. Networks of relationships are a place to share past experiences on diseases, doctors, health facilities and therapies. This channel of information fosters matching procedures (in the sense that patients spend less time finding the appropriate doctor), lowers the cost of health information, speeds up the diffusion of knowledge of health innovation and eliminates mistaken perceptions on the role of healthcare, discouraging individuals from undertaking inappropriate treatments.
may foster individual access to services even when public protection schemes are designed to provide universal coverage (van Doorslaer et al. 2004). For example, empirical evidence on the Italian National Health System (NHS) – which theoretically covers all citizens on equal terms – suggests that the wealthy are more likely to be admitted to hospital than the poor (Masseria and Giannoni 2010). With reference to Italy, Atella et al. (2004) find that individuals who might be considered vulnerable from a societal perspective – i.e. the sick, women and those with low incomes – are less likely to seek care from specialists and more likely to seek care from general practitioners. Since, in the Italian NHS, services are accessible by all citizens on a universal basis, health inequalities may also be related to people’s ability to acquire suitable information and to find the right contacts in the right places, which in turn is influenced by the extension of one’s social network.
3) “Buffering effect”. Meetings with friends provide moral and affective support which mitigates the psychological distress related to sickness. This “buffering effect” may play a role in improving patients’ ability to recover, thereby improving the health status of sick people. Moreover, the “buffering effect” may play a key role in reducing occupational stress as well as modifying perceptions of work-associated distress (Cummings 1990; Lu 1999). Workers who feel supported by others may feel less stressed. If you know that your friends will support you and there is someone with whom you can talk things through, stressful working situations may be more tolerable. The “buffering effect” of a cohesive network or community also works for healthy people by preventing depression and mental disorders often related to social isolation and acting as a source of self-esteem and mutual respect (Kawachi et al. 1999).
4) Public good. At the contextual level, social relations may serve as a “public good”, with positive spillover effects onto the health of broader society (Putnam 2000). For example, strong community ties may lead to greater community mobilizations and enact local health policies with potential benefits to all citizens (Kim et al. 2011). Furthermore, strong community ties are more successful at bonding together to fight potential budget cuts of local services, and as a result have better access to local services and amenities (Kawachi et al. 1999).
Theoretical background
) , , , ,
(C SR SR X e
h H
−
= (1)
where H is a measure of individual health, C is the set of consumption, SR represents
individual social relations,
−
SR are contextual social relations, and X and e are the set of
observable and unobservable personal characteristics, respectively.
In light of the arguments outlined above, we expect to find a significant and positive
relationship between self-perceived health and social relations
) , , , ,
(C SR SR X e
f SPH
−
+ +
= (1.1)
while a significant and negative relationship, respectively, between chronic conditions,
limitations in activities of daily living and social relations
) , , , ,
(C SR SR X e
g CC
−
− −
= (1.2)
Limitations in ADLs i(C,SR,SR,X,e)
−
− −
= (1.3)
3. Data
We use data from the income and living conditions survey carried out by the Italian
Statistics Office (IT-SILC) in 2006. The original sample contained 46522 observations
providing information on the following types of living conditions: income, education, health,
work conditions, social exclusion, housing and social participation. This last information is an
appealing feature of the dataset but is not provided in other waves of the survey. Hence no
panel dimension is available for our study. After excluding individuals who were not
employees, we were left with a subsample of 15169 employees aged between 16 and 64 in
2006. All the variables used in our empirical analysis are described in detail in Table 1 in
Appendix A.
Health measures
We use three different variables to measure health status. The first is self-perceived health
(SPH) which is measured by the five conventional levels: “very poor”, “poor”, “fair”, “good”
and “very good”. SPH is widely used in the literature as a convenient aggregate of all aspects
of health (Bilger and Carrieri 2012) and previous studies have shown SPH to be correlated
with objective health measures such as mortality (Idler and Benyamini 1997). It is, by its very
nature, subjective. For this reason, we use other health variables with a greater level of
admits two values “yes” or “no”4, and the presence of limitations in activities of daily living (LADLs) with three possible responses: “not limited”, “limited”, and “strongly limited”. CC and LADLs measures, although self-reported, are based on the incidence of specific health conditions and limitations, which individuals are more likely to recall and report truthfully.
Social relations
The information on social participation is self-assessed by individuals who are asked to report i) frequency of getting/being in contact with friends and relatives; ii) participation in informal and formal voluntary activities; iii) participation in cultural events.
We measure social relations at the individual level through the frequency with which respondents usually meet up with friends (those who do not live in the same household as the respondent should be considered) in their spare time during a usual year. Six responses are considered: “daily”, “every week”, “several times a month”, “once a month”, “at least once a year” and “never”. Individual social relations is a dummy variable equal to 1 if the respondent gets together with friends every day during a usual year.
We measure social relations at a contextual level by the average frequency with which people meet friends at the community level. The reference group of individuals is the group of people at the municipality level in the same age group and at the same education level. We consider three categories of municipality size (thinly, intermediate and densely inhabited), three age groups (16-30, 31-50 and 51-64) and three education levels (primary, secondary and tertiary). Thus we have 27 reference groups in each of the 20 Italian regions. Contextual social relations is calculated as the mean value of the daily frequency of meetings with friends for each of the 27 reference groups in each of the 20 Italian regions. We obtain 540 combinations across which 15169 observations of the sample are distributed.
Other covariates
In order to account for other factors which might influence health status and social relations, we include in the analysis a set of control variables: demographic and worker characteristics as well as housing features, neighbourhood quality and size of municipality.
At the individual level, we account for age, gender (male) with female as the reference category, for marital status, by including categories for married, separated, divorced and
widowed against a base category of being single. We consider the respondent's country of birth (European Union, other), the number of individuals living in the household (household
4
size), and number of children in the household by age (age 0-2, age 3-5, age 6-15, age 16-24). Three indicators were constructed to represent the level of education attained based on the International Standard Classification of Education (ISCED): pre-primary, primary and
secondary, with tertiary being the reference category. We further control for the natural logarithm of annual net labour income (labour income) and tenure status (homeownership).
As worker characteristics we include in the analysis the numbers of hours usually worked per week in the main job (weekly hours), the numbers of years, since starting the first regular job, that the respondent has spent at work (experience), and a work contract of unlimited duration (permanent job). Moreover, two categories control for type of occupation: employed in professional and/or in managerial occupations (job-professionals) and employed in skilled occupations (job-skilled) with job-non skilled as reference category. We also control for membership of different business sectors, as defined by the Statistical Classification of Economic Activities (NACE). We include categories for working in agriculture, construction,
wholesale, hotels, transport, finance, real estate, education, public administration, health and social work, and other sectors against a base category of working in manufacturing.
Housing features concern the number of rooms available to the household (number of rooms) and three categories of housing problems (humidity, warmth and dark). We measure the quality of the surrounding environment through three indicators of subjective perception (noise, pollution and crime) and we also control for two categories of the size of municipality (densely populated area and intermediate area) with thinly populated area as reference category. Regional fixed effects are also included to account for the high regional heterogeneity in health status existing in Italy.
Descriptive analysis
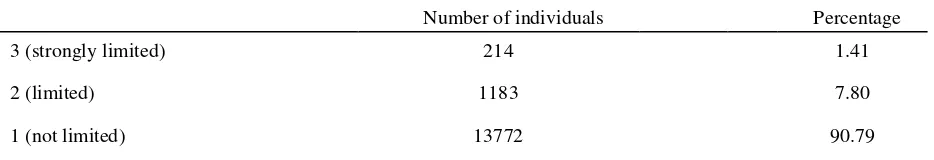
Tables 1-3 present the sample distribution of the dependent variables. On average, about 74 percent of employees report good and very good health, while 12 percent present chronic conditions and 9 percent limitations in ADLs.
Summary weighted statistics are reported in Table 4 for the whole sample, as well as for the poor and good health subsample5. On average, 20 percent of respondents meet friends every day. The average frequency with which people meet friends at the community level is 22 percent. Over half of the respondents are male and married, and are educated up to secondary level. The average age is 40 years. Moreover, 40 percent of respondents have
5
Table 1. Self-perceived health
Table 2. Chronic condition
Table 3. Limitations in ADLs
children aged between 16 and 24 while 71 percent of respondents are homeowners. Finally, on average, respondents work 37 hours per week and have 16 years' work experience.
Respondents who declare poor health for all health measures, on average meet friends less frequently, are older, employed less in professional and skilled occupations and work fewer hours per week but have more work experience. In addition, respondents are employed more in public administration and report several housing and neighbourhood problems.
Number of individuals Percentage
5 (very good) 2611 17.21
4 (good) 8635 56.93
3 (fair) 3564 23.50
2 (poor) 318 2.10
1 (very poor) 41 0.27
Number of individuals Percentage
1 (yes) 1770 11.67
2 (no) 13399 88.33
Number of individuals Percentage
3 (strongly limited) 214 1.41
2 (limited) 1183 7.80
[image:12.595.66.533.392.472.2]Table 4. Descriptive statistics (mean)
Variable All Poor Health Good Health
SPH CC LADLs SPH CC LADLs Individual social relations 0.20 0.21 0.15 0.16 0.22 0.20 0.20 Contextual social relations 0.22 0.19 0.18 0.19 0.24 0.23 0.23 Male 0.57 0.48 0.52 0.52 0.58 0.58 0.58 Married 0.59 0.62 0.63 0.67 0.57 0.59 0.59 Separated 0.02 0.05 0.04 0.03 0.02 0.02 0.02 Divorced 0.03 0.07 0.05 0.05 0.02 0.02 0.02 Widowed 0.01 0.04 0.02 0.02 0.01 0.01 0.01 Age 39.99 46.11 43.71 44.51 38.28 39.52 39.56 Pre primary edu 0.00 0.01 0.00 0.01 0.00 0.00 0.00 Primary edu 0.06 0.15 0.07 0.11 0.05 0.06 0.06 Secondary edu 0.77 0.76 0.77 0.77 0.77 0.77 0.77 Household size 3.14 2.93 3.01 3.08 3.17 3.16 3.15 Children 0-2 0.09 0.03 0.08 0.04 0.11 0.10 0.10 Children 3-5 0.10 0.03 0.07 0.07 0.10 0.10 0.10 Children 6-15 0.35 0.31 0.36 0.39 0.35 0.35 0.34 Children 16-24 0.40 0.51 0.40 0.43 0.39 0.40 0.40 EU birth 0.01 0.01 0.01 0.01 0.01 0.01 0.01 OTH birth 0.08 0.08 0.05 0.05 0.09 0.09 0.09 Labour income 9.61 9.45 9.64 9.60 9.61 9.61 9.61 Homeowner 0.71 0.66 0.72 0.70 0.70 0.70 0.71 Weekly hours 37.77 36.10 37.25 37.01 38.01 37.83 37.84 Experience 16.08 21.12 19.23 19.91 14.59 15.68 15.70 Permanent job 0.84 0.85 0.87 0.85 0.84 0.84 0.84 Job professional 0.33 0.26 0.33 0.28 0.35 0.33 0.34 Job skilled 0.30 0.27 0.30 0.30 0.30 0.30 0.29 Agriculture 0.03 0.04 0.02 0.04 0.03 0.04 0.03 Construction 0.07 0.08 0.05 0.06 0.07 0.07 0.07 Wholesale 0.10 0.08 0.09 0.08 0.11 0.10 0.11 Hotels 0.03 0.02 0.03 0.03 0.03 0.03 0.03 Transport 0.05 0.04 0.05 0.06 0.05 0.05 0.05 Finance 0.03 0.00 0.04 0.02 0.03 0.03 0.03 Real estate 0.06 0.03 0.04 0.04 0.06 0.06 0.06 Education 0.09 0.10 0.12 0.11 0.08 0.09 0.09 Public administration 0.10 0.10 0.11 0.11 0.09 0.10 0.10 Health and social work 0.08 0.12 0.10 0.09 0.08 0.08 0.08 Other sectors 0.08 0.13 0.07 0.09 0.08 0.08 0.08 Number of rooms 3.47 3.27 3.42 3.42 3.48 3.48 3.48 Humidity problem 0.21 0.35 0.28 0.33 0.19 0.20 0.20 Warmth problem 0.08 0.16 0.10 0.13 0.07 0.07 0.07 Dark problem 0.07 0.11 0.09 0.12 0.07 0.07 0.07 Noise 0.25 0.37 0.31 0.34 0.23 0.24 0.24 Pollution 0.22 0.30 0.29 0.29 0.21 0.21 0.21 Crime 0.15 0.27 0.20 0.21 0.14 0.14 0.14 Densely populated area 0.44 0.49 0.47 0.44 0.44 0.43 0.44 Intermediate area 0.39 0.36 0.36 0.37 0.39 0.39 0.39
4. Methodology
To study the association between social relations and workers' health we need to
reflect on the self-selection of individuals in the labour market. Individuals may choose
to stay out of the labour market because they get unemployment benefits as well as
disability benefits. This is possible for the respondents who state they suffer from chronic (long-standing) illness or condition and limitations in activities of daily living. Hence we use the Heckman selection model in our empirical analysis, a method which helps assess the impact of social relations, after accounting for the possibility of selection of individuals into the labour market. The model consists of two equations: a labour force participation equation and a health equation.
Suppose that ∗ is the continuous latent variable associated with the decision to work. This can be expressed as
∗ = Z1iβ1 +ε1i (2)
where Z1i is a vector containing individual characteristics that influence the decision to enter the labour market, β1 is a vector of parameters to be estimated and ε1iis a random error
term. If ∗
> 0, the wage market exceeds the reservation wage, the individual chooses to work.
If ∗
≤ 0, the individual chooses not to work. ∗
is unobservable but relates to the observable
binary variable , that takes the value of 1 if the individual works and 0 if the individual does
not work.
Allowing for the potential bias related to the individual decisions to participate in the labour force, the health equation can be written as
Hi Z2i 2 SRi SRi Yi i 2i
* = β +α +θ − +χ +ϕλ +ε
(3)
where Hi*is a latent health for individual i;SRi is the individual social relations variable;
−
i
SR is the contextual social relations variable; Yi is the individual income; Z2i is a matrix of
control variables; λi = ϕ(Z1iβ1))/ Ф(Z1iβ1)) is the inverse Mills ratio for labour force
participation equation where ϕ(.) is the normal probability distribution and Ф(.) is the normal
cumulative distribution. β2, α , θ ,χ, ϕ are parameters to be estimated and ε is a
Following Durlauf (2002), when social relations act as a contextual effect, one can test the presence of contextual social relations by testing whether θ is zero in (3).
Health equation (3) is a latent variable model, as our measures of health are all qualitative, whether binary or ordinal. SPH is measured by five conventional responses: vey bad, bad, fair, good, very good. Thus, the structure of Equation (3) makes it suitable for estimation as an ordered probit model. Instead, CC is a measured by a dummy variable (yes or no). Hence, Equation (3) makes it appropriate for estimation as an standard probit model. Finally, limitations in ADLs present three possible responses: not limited, limited and strongly limited. Therefore, we use once again an ordered probit model to estimate Equation (3).
5. Results
In this section, we present estimations of the empirical models described in Section 3. We start by estimating the labour force participation equation (2) and we compute the inverse Mills ratio. Results are shown in Appendix B, Table 2. Then we estimate the
health equation (3) and use an ordered probit model for SPH and LADLs and a probit model for CC. For all estimates, we compute the robust standard errors.
5.1. Self-perceived health
Table 6 reports the results for the SPH equation. For reasons of clarity, we display findings in Panels A, B and C. The results in Panel A for the employees sample show that the individual social relations variable is positively associated with the degree of self-perceived health state (significant at 1 %). The marginal effects suggest that the health benefits of individual social relations are slightly increasing. Meeting friends every day decreases the probability of reporting poor health by 0.5 percent (moving from a very bad perceived state) and increases the probability of declaring good health by 1 percent (moving from a fair perceived state). This result is in line with Fiorillo and Sabatini (2011b) who found for the Italian whole population that meetings with friends daily is associated with a 1.8 higher probability of reporting self-perceived good health. This finding is also in line with Bolin et al. (2003) and Hyyppä and Mäki (2003) who found for Swedish and Finnish population that friendship network is positively associated with self-assessed health.
Table 6. Panel A. Effects of social relations and individual characteristics on SPH
Note: The dependent variable Self-perceived health is an ordinal variable (1 = very poor, 2 = poor , 3= fair, 4= good, 5 = very good). See Appendix A Table 1 for a detailed description of regressors. Regional dummies are omitted for reasons of space. The estimated cut-points are not reported. Standard errors are corrected for heteroskedasticity. The symbols ***, **, * denote that the coefficient is statistically different from zero at 1, 5 and 10 percent.
Table 6. Panel B. Effects of worker characteristics on SPH
All Poor Good
coeff. Std. err dy/dx std. err. dy/dx Std. err Individual social relations 0.182*** 0.025 -0.005 0.001 0.010 0..001 Contextual social relations 0.095 0.102 -0.003 0.003 0.007 0.008 Male 0.041 0.028 -0.001 0.001 0.003 0.002 Married - 0.074*** 0.028 0.002 0.001 -0.005 0.002 Separated -0.147** 0.065 0.005 0.003 -0.016 0.009 Divorced -0.257*** 0.068 0.010 0.003 -0.034 0.012 Widowed -0.202** 0.088 0.008 0.004 -0.025 0.014 Age -0.031*** 0.002 0.001 0.000 -0.002 0.000 Pre primary edu 0.140 0.168 -0.004 0.004 0.006 0.003 Primary edu - 0.127** 0.055 0.004 0.002 -0.013 0.007 Secondary edu -0.093*** 0.031 0.003 0.001 -0.006 0.002 Household size 0.028*** 0.011 -0.001 0.000 0.002 0.001 Children 0-2 0.091*** 0.033 -0.003 0.001 0.007 0.003 Children 3-5 - 0.005 0.032 0.000 0.001 -0.000 0.002 Children 6-15 -0.028* 0.017 0.001 0.000 -0.002 0.001 Children 16-24 -0.025 0.016 0.001 0.000 -0.002 0.001 EU birth 0.222*** 0.080 -0.006 0.002 0.006 0.002 OTH birth 0.175*** 0.042 -0.006 0.002 0.007 0.001 Labour income (ln) 0.047** 0.021 -0.001 0.001 0.004 0.002 Homeowner - 0.022 0.023 0.001 0.001 -0.002 0.002 Mills ratio -0.221*** 0.050 0.006 0.001 -0.017 0.004
Observations 14484 R-squared 0.072 Log Likelihood -14221.02
All Poor Good
Table 6. Panel C. Effects of housing features, neighbourhood quality and size of municipality on SPH
higher probability of reporting self-perceived good health. This evidence is also in line with Portinga (2006a,b) who using respectively European Social Survey and UK data did not find a statistically significant correlation between collective structural social capital (proxied by social participation) and self-rated good health for the whole population.
The individual characteristics are important predictors of self-perceived health of employees. The degree of self-perceived health is found to decrease with age and marital status. In particular, being separated and/or divorced is negatively associated, respectively, with a 1.6 and 3.4 percent higher probability of declaring good perceived health (moving from fair perceived state). Previous empirical studies on whole population found similar evidence (Bolin et al. 2003; Hyyppä and Mäki 2003; Iversen 2008). Moreover, having children aged 6-15 is negatively statistically correlated (at 10%) with SPH, too. On the other hand, the degree of self-perceived health increases with the following characteristics: male, education, labour income, household size, having young children (aged 0-2) and whether the respondent was born in the European Union or other countries. These last three variables are associated respectively with 0.7, 0.6 and 0.7 percent higher probability of reporting good perceived health. The association between employees with children aged between 0 and 2 and self-perceived good health seems to support the hypotheses on the “relational” incentives towards healthy behaviour: as noted by Folland, “responsibility to others requires at a minimum that one stay alive and healthy” (2007, 2345). Results on male, education and income are in line with the findings of Datta Gupta and Kristensen (2008) on self-assessed workers’ health and with the evidence of Portinga et al (2006a,b), D’Hombres et al. (2010), Giordano and Lindstrom (2010) and Ronconi et al. (2012) on self-rated health of whole population. Finally, the inverse Mills ratio coefficient is negative and significant at 1 percent. This means that
All Poor Good
coeff. Std. err dy/dx std. err. dy/dx Std. err Number of rooms 0.027*** 0.009 -0.001 0.000 0.002 0.001 Humidity problem - 0.248*** 0.024 0.009 0.001 -0.027 0.004 Warmth problem -0.193*** 0.041 0.007 0.002 -0.022 0.006 Dark problem -0.092** 0.039 0.003 0.001 -0.009 0.004 Noise -0.062** 0.026 0.002 0.001 -0.005 0.002 Pollution -0.088*** 0.029 0.003 0.001 -0.008 0.003 Crime -0.056* 0.033 0.002 0.001 -0.005 0.003 Densely populated area 0.150*** 0.031 -0.004 0.001 0.010 0.002 Intermediate area 0.090*** 0.026 -0.003 0.001 0.007 0.002
there is an overestimation of the degree of self-perceived health, if we do not consider the selectivity problem of individuals in the labour market.
Regarding worker characteristics, we find that the only important predictor is occupation. Employees who are employed in professional and skilled occupations report a higher perceived health state than workers engaged in no-skilled occupation. The association is statistically significant at 1 percent. The result on professional occupations is in line with the findings of Datta Gupta and Kristensen (2008).
Table 7. Panel A. Effects of social relations and individual characteristics on CC
Note: The dependent variable Chronic conditions is a binary variable (1 = yes, 0 = no). See Appendix A Table 1 for a detailed description of regressors. Regional dummies are omitted for reasons of space. Standard errors are corrected for heteroskedasticity. The symbols ***, **, * denote that the coefficient is statistically different from zero at 1, 5 and 10 percent.
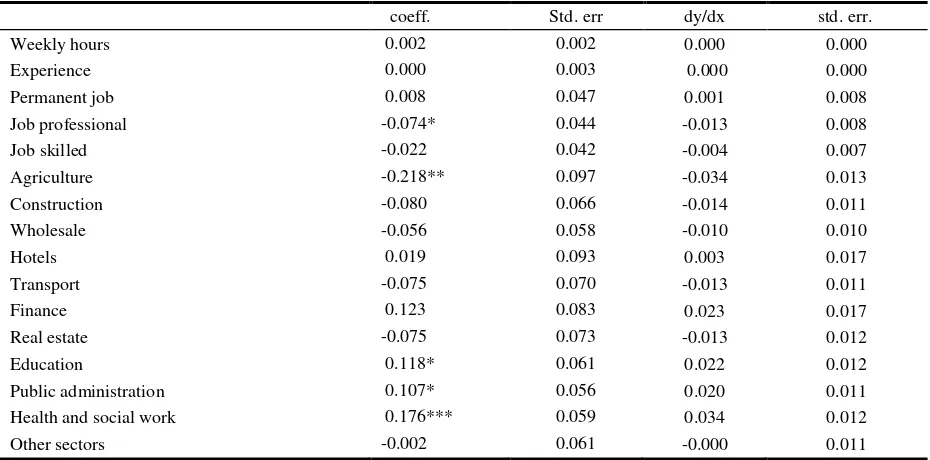
Table 7. Panel B. Effects of worker characteristics on CC
coeff. Std. err dy/dx std. err. Individual social relations -0.129*** 0.040 -0.022 0.006 Contextual social relations -0.331** 0.164 -0.059 0.029
Male 0.032 0.043 0.006 0.007
Married 0.045 0.043 0.008 0.007
Separated 0.110 0.088 0.021 0.018 Divorced 0.333*** 0.084 0.071 0.021
Widowed 0.077 0.112 0.014 0.022
Age 0.018*** 0.003 0.003 0.000
Pre primary edu -0.082 0.244 -0.014 0.039 Primary edu -0.128 0.084 -0.021 0.013 Secondary edu 0.005 0.047 0.001 0.008 Household size -0.049*** 0.017 -0.009 0.003 Children 0-2 0.023 0.054 0.004 0.010 Children 3-5 -0.030 0.053 -0.005 0.009 Children 6-15 0.080*** 0.026 0.014 0.005 Children 16-24 0.023 0.025 0.004 0.004 EU birth 0.015 0.116 0.003 0.021 OTH birth -0.365*** 0.075 -0.052 0.008 Labour income (ln) -0.106*** 0.031 -0.019 0.005 Homeowner 0.040 0.035 0.007 0.006 Mills ratio 0.194*** 0.072 0.034 0.013
Observations 14484 R-squared 0.057 Log Likelihood -4869.74
coeff. Std. err dy/dx std. err. Weekly hours 0.002 0.002 0.000 0.000 Experience 0.000 0.003 0.000 0.000 Permanent job 0.008 0.047 0.001 0.008 Job professional -0.074* 0.044 -0.013 0.008 Job skilled -0.022 0.042 -0.004 0.007 Agriculture -0.218** 0.097 -0.034 0.013 Construction -0.080 0.066 -0.014 0.011 Wholesale -0.056 0.058 -0.010 0.010
Hotels 0.019 0.093 0.003 0.017
Transport -0.075 0.070 -0.013 0.011
Finance 0.123 0.083 0.023 0.017
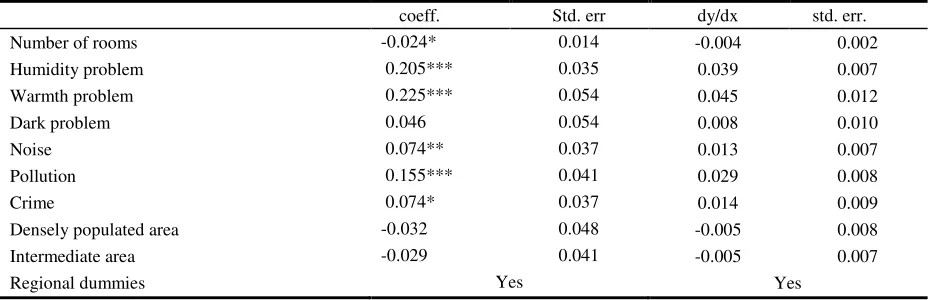
Table 7. Panel C. Effects of housing features, neighbourhood quality and size of municipality on CC
5.2. Chronic conditions
Table 7 reports the results for CC equation. For reasons of clarity, we also display findings in Panels A, B and C. In Panel A, we observe a negative relationship between individual social relations and chronic conditions, statistically significant at 1 percent. Meeting friends every day reduces the probability of suffering from chronic conditions by around 2 percent. Moreover, there also emerges a negative association between contextual social relations and chronic conditions, statistically significant at 5 percent. The average frequency with which people meet friends at the community level reduces the probability of suffering from chronic conditions by around 6 percent.
These findings show that over and above the individual effect of social relations, social relations contributes to reduces the probability of suffering from chronic conditions at the collective level, too.
The results for the individual control variables indicate that gender and education are not significant predictors of chronic conditions. Instead, being divorced and having children aged 6-15 increase the likelihood of reporting chronic conditions, respectively, by 7 and 1.4 percent. Age also presents a positive and statistically significant (at 1 %) correlation with CC. On the other hand, household size, being born outside the EU and labour income decrease the probability of suffering from chronic conditions. In particular, being born outside the EU is associated with 5.2 percent lower probability of reporting chronic conditions. The evidence on age and household size are in line with the results of Su et al. (2006). The inverse Mills ratio coefficient is positive and significant at 1 percent. This means that there is an underestimation of suffering from chronic conditions if we do not consider the selectivity problem of individuals in the labour market.
coeff. Std. err dy/dx std. err. Number of rooms -0.024* 0.014 -0.004 0.002 Humidity problem 0.205*** 0.035 0.039 0.007 Warmth problem 0.225*** 0.054 0.045 0.012 Dark problem 0.046 0.054 0.008 0.010
Noise 0.074** 0.037 0.013 0.007
Pollution 0.155*** 0.041 0.029 0.008
Crime 0.074* 0.037 0.014 0.009
Densely populated area -0.032 0.048 -0.005 0.008 Intermediate area -0.029 0.041 -0.005 0.007
Among worker characteristics, a significant (at 10%) negative correlation exists between managerial positions and chronic conditions. Industry also seems important. Working in the education sector, public administration and doing social work is found to worsen chronic conditions. Working in agriculture, on the other hand, is associated with an decrease in the probability of suffering from chronic conditions.
Housing problems and low neighbourhood quality also seem to be important explanatory variables in this sample. Employees who state that their accommodation is damp and cold exhibit, respectively, a 3.9 and 4.5 percent higher probability of suffering from chronic conditions. Moreover, employees who perceive noise, pollution and crime problems in their area of residence also have a higher probability of suffering from chronic conditions. The size of municipality in which the employees are resident is not statistically significant. Finally, evidence on regional dummies (not reported) points out some geographical differences: Southern regions (Campania, Puglia and Sicily) present a negative and highly significant association with chronic conditions.
5.3. Limitations in activities of daily living
Table 8. Panel A. Effects of social relations and individual characteristics on limitations in ADLs
Note: The dependent variable limitations in activities of daily living is an ordinal variable (1 = no, 2 = limited , 3= severely limited). See Appendix A Table 1 for a detailed description of regressors. Regional dummies are omitted for reasons of space. The estimated cut-points are not reported. Standard errors are corrected for heteroskedasticity. The symbols ***, **, * denote that the coefficient is statistically different from zero at 1, 5 and 10 percent.
Table 8. Panel B. Effects of worker characteristics on limitations in ADLs
All Limited Severely limited coeff. Std. err dy/dx std. err. dy/dx Std. err Individual social relations -0.022 0.042 -0.003 0.005 -0.000 0.001 Contextual social relations -0.602*** 0.180 -0.072 0.021 -0.015 0.005 Male 0.117*** 0.045 0.014 0.005 0.003 0.001 Married 0.148*** 0.048 0.017 0.005 0.003 0.001 Separated 0.169* 0.099 0.022 0.014 0.005 0.004 Divorced 0.450*** 0.088 0.067 0.016 0.018 0.005 Widowed 0.258** 0.110 0.035 0.017 0.008 0.005 Age 0.016*** 0.003 0.001 0.000 0.000 0.000 Pre primary edu 0.063 0.256 0.008 0.033 0.002 0.007 Primary edu -0.006 0.085 -0.001 0.010 -0.000 0.002 Secondary edu 0.040 0.055 0.004 0.006 0.001 0.001 Household size -0.025 0.018 -0.003 0.002 -0.001 0.000 Children 0-2 -0.192*** 0.063 -0.023 0.007 -0.005 0.002 Children 3-5 0.010 0.054 0.001 0.006 0.000 0.001 Children 6-15 0.058** 0.027 0.007 0.003 0.001 0.001 Children 16-24 -0.020 0.026 -0.002 0.003 -0.000 0.001 EU birth -0.177 0.136 -0.019 0.013 -0.003 0.002 OTH birth -0.302*** 0.080 -0.030 0.006 -0.005 0.001 Labour income (ln) -0.143*** 0.033 -0.017 0.004 -0.003 0.001 Homeowner 0.015 0.036 0.002 0.004 0.000 0.001
λ 0.453*** 0.072 0.054 0.009 0.011 0.002
Observations 14484 R-squared 0.069 Log Likelihood -4640.77
Table 8. Panel C. Effects of housing features, neighbourhood quality and size of municipality on limitations in ADLs
As in chronic conditions findings, education is not a significant predictor of LADLs while marital status and age have a positive and statistically significant effect on limitations in daily activities. In particular, being divorced and widowed increase the probability of being hampered in daily activities by, respectively, 6.7 and 3.5 percent (Column 2). Furthermore, being male and having children aged 6-15 is also associated with a higher likelihood of limitations in ADLs.
Other significant (at 1%) individual characteristics are having young children (aged 0-5), being born in a country outside the European Union and labour income. The negative signs of the coefficients of these variables suggest that they reduce the probability of health limitations in daily activities. Finally, the inverse Mills ratio coefficient is positive and significant at 1 percent. This means that there is an underestimation of limitations in ADLs if we do not consider the selectivity problem of individuals in the labour market.
Among worker characteristics, first, a significant negative correlation is present with the professional job variable. High managerial positions are associated with a higher probability of reducing health limitations in daily activities. Second, a positive association exists with the sectors education and social work . An increase in these variables is related with 1.1 and 2.6 percent higher probabilities, respectively, of declaring limitations in ADLs.
As in previous findings, the presence of housing problems and low neighbourhood quality seem to be significant explanatory variables as well for limitations in ADLs. Employees who state that their accommodation is damp, cold and dark have, respectively, a 3.1, 3.7 and 1.7 percent higher probability of reporting health limitations in daily activities (Column 2). Moreover, our estimates also show a positive association, significant at 1 percent, between the perception of pollution and crime in the area of residence and limitations in ADLs. In addition, the size of municipality in which the employees live is negatively and statistically
All Limited Severely limited coeff. Std. err dy/dx std. err. dy/dx Std. err Number of rooms -0.022 0.015 -0.003 0.002 -0.000 0.000 Humidity problem 0.241*** 0.036 0.031 0.005 0.007 0.001 Warmth problem 0.272*** 0.052 0.037 0.008 0.009 0.002 Dark problem 0.131** 0.054 0.017 0.007 0.004 0.002 Noise 0.066* 0.039 0.008 0.005 0.002 0.001 Pollution 0.148*** 0.043 0.019 0.006 0.004 0.001 Crime 0.155*** 0.046 0.020 0.006 0.004 0.001 Densely populated area -0.194** 0.051 -0.022 0.006 -0.004 0.001 Intermediate area -0.122** 0.077 -0.014 0.005 -0.003 0.001
correlated, at a conventional level, with limitations in activities of daily living. Employees who are resident in densely and intermediate populated areas have a 2.2 and 1.4 percent lower probability of declaring health limitations, respectively. This is probably because employees with limitations live in such areas due to their better accessibility. Finally, results on regional dummies (not reported) do not illustrate statistically significant geographical differences.
5.4. Robustness check
Although we allow for many control variables which might influence health status and social relations, the observed association between social relations and health measures could hide the effect of other factors which cause both a high propensity to meet friends and to feel well. Thus a potential problem with the interpretation of results is omitted variable bias. We address this problem by adding further control variables. First of all, we consider variables aimed at capturing additional social relational aspects of individual behaviour such as membership of various kinds of associations. In previous studies, membership of organisations has been found to be correlated with health in some studies (Poortinga 2006a,b; Petrou and Kupek 2008; Giordano and Lindstrom 2010; Fiorillo and Sabatini 2011b) and insignificant in others (D’Hombres et al. 2010). Membership of organisations is a dummy variable equal to 1 if the respondent, during the last twelve months, participated in activities of organisations. The organisations we accounted for are political parties or trade unions, professional, religious, recreational, voluntary and others. Secondly, we consider unmet need for medical examination and treatment. The aim of including this variable is to capture the person’s own assessment of whether he or she needed to consult a medical specialist, but was not able to do so. Even if in the Italian National Health System services may be accessed by all residents on a universal basis, access to health care may still be limited by the existence of waiting lists and other forms of rationing. Such variables are described in detail in Table 1 in Appendix A.
Table 9. Social relations, membership, unmet need for medical examination and other controls on SPH
Note: The symbols ***, * denote that the coefficient is statistically different from zero at 1, and 10 percent.
Table 10. Social relations, membership, unmet need for medical examination and other controls on CC
Note: The symbols ***, ** denote that the coefficient is statistically different from zero at 1, and 5 percent.
All Poor Good
coeff. Std. err dy/dx std. err. dy/dx Std. err Individual social relations 0.176*** 0.026 -0.005 0.001 0.010 0..001 Contextual social relations 0.095 0.102 -0.003 0.003 0.008 0.008
Unmet need for medical examination -0.523*** 0.041 0.026 0.003 -0.092 0.011
Membership of organisations
Political parties or trade unions - 0.064 0.039 0.002 0.001 -0.006 0.004 Professional 0.135*** 0.041 -0.004 0.001 0.007 0.001 Religious -0.003 0.027 0.000 0.001 -0.000 0.002 Recreational 0.014 0.032 -0.000 0.001 0.001 0.002 Voluntary -0.048 0.038 0.001 0.001 -0.004 0.004 Other organisations 0.082** 0.041 -0.002 0.001 0.005 0.002
Control variables Yes Yes Yes
Mills ratio -0.229*** 0.050 0.007 0.002 -0.018 0.004
Observations 14484 R-squared 0.078 Log Likelihood -14128.36
coeff. Std. err dy/dx std. err. Individual social relations -0.131*** 0.040 -0.022 0.006 Contextual social relations -0.343** 0.166 -0.060 0.029
Unmet need for medical examination 0.522 0.051 0.120 0.014
Membership of organisations
Political parties or trade unions 0.078 0.057 0.014 0.011 Professional -0.148** 0.063 -0.024 0.009 Religious 0.031 0.040 0.005 0.007 Recreational 0.033 0.047 0.006 0.008 Voluntary 0.051 0.053 0.009 0.010 Other organisations 0.110* 0.057 0.020 0.011
Control variables Yes Yes
Mills ratio 0.208*** 0.072 0.036 0.013
[image:25.595.64.532.451.733.2]Table 11. Social relations, membership, unmet need for medical examination and other controls on limitations in ADLs
Note: The symbols *** denote that the coefficient is statistically different from zero at 1 percent.
On the other hand, participation in activities of environmental organizations, civil rights groups, neighbourhood associations, peace groups etc… raises the probability of declaring chronic conditions by 2 percent. Moreover, unmet need for medical examination is a highly significant predictor of health status. If the workers really needed examination or treatment but he/she did not reduce the probability of declaring good SPH by 9.2 percent, the probability of declaring a chronic condition rises by 12 percent and increases the likelihood of reporting limitations in daily activities by 10 percent.
Social relations might have different effects for workers with different type of jobs. For this reason we perform a second robustness analysis, stratifying our sample according to three categories of job types: professional, skilled and unskilled. We analyse the effects of social relations on health status for professional, skilled and unskilled employees separately. Tables 12 – 14 present the results, respectively, for self-perceived health, chronic conditions and presence of limitations in activities of daily living
All Limited Strongly limited coeff. Std. err dy/dx std. err. dy/dx Std. err Individual social relations - 0.020 0.042 -0.002 0.005 -0.014 0.004 Contextual social relations -0.627*** 0.181 -0.073 0.021 -0.000 0.001
Unmet need for medical examination 0.642*** 0.047 0.102 0.010 0.029 0.004
Membership of organisations
Political parties or trade unions 0.056 0.061 0.007 0.008 0.001 0.002 Professional - 0.191*** 0.070 -0.020 0.007 -0.004 0.001 Religious 0.055 0.042 0.007 0.005 0.001 0.001 Recreational 0.042 0.051 0.005 0.006 0.001 0.001 Voluntary 0.056 0.058 0.007 0.007 0.001 0.001 Other organisations 0.016 0.063 0.002 0.007 0.000 0.001
Control variables Yes Yes Yes
Mills ratio 0.478*** 0.073 0.056 0.009 0.011 0.002
Table 12. Social relations and other control variables on SPH by type of job
[image:27.595.64.537.299.452.2]Note: The symbols *** denote that the coefficient is statistically different from zero at 1 percent.
Table 13. Social relations and other control variables on CC by type of job
Note: The symbols *** denote that the coefficient is statistically different from zero at 1 percent.
Table 14. Social relations and other control variables on limitations in ADLs by type of job
Note: The symbols *** denote that the coefficient is statistically different from zero at 1 percent.
Job Professional Job Skilled Job Unskilled coeff. Std. err coeff. std. err. coeff. Std. err Individual social relations 0.250*** 0.048 0.137*** 0.047 0.156*** 0.040 Contextual social relations 0.078 0.179 0.087 0.189 0.057 0.169
Control variables Yes Yes Yes
Mills ratio -0.350*** 0.094 -0.196 ** 0.087 -0.223*** 0.085
Observations 4957 4333 5197
R-squared 0.078 0.083 0.090 Log Likelihood -4711.29 -4243.03 -5062.48
Job Professional Job Skilled Job Unskilled coeff. Std. err coeff. std. err. coeff. Std. err Individual social relations - 0.206 *** 0.078 -0.029 0.072 -0.142** 0.064 Contextual social relations -0.345 0.287 -0.154 0.307 -0.421 0.277
Control variables Yes Yes Yes
Mills ratio 0.159 0.136 0.197 0.127 0.251** 0.120
Observations 4957 4333 5194
R-squared 0.078 0.084 0.089 Log Likelihood -1649.02 -1416.83 -1668.86
Job Professional Job Skilled Job Unskilled coeff. Std. err coeff. std. err. coeff. Std. err Individual social relations - 0.039 0.085 0.011 0.075 -0.025 0.065 Contextual social relations -0.153 0.329 -1.116*** 0.331 -0.690** 0.290
Control variables Yes Yes Yes
Mills ratio 0.340** 0.145 0.686*** 0.125 0.503*** 0.118
Observations 4957 4333 5194
[image:27.595.65.535.507.661.2]When we compare the coefficients estimated for the overall sample (Tables 6-8, Panel A) with those estimated for the employees with professional, skilled and unskilled jobs, the coefficients on social relations appear to be quite robust. The coefficients appear to be particularly robust for all types of jobs in self-perceived health status. For the other health status some coefficients lose statistical significance, but this is not an unexpected result given that the sub-samples are smaller than the overall sample.
5.5.Discussion
The present paper studies the association between social relations and workers’ health using 2006 IT-SILC. It specifically aimed to investigate whether the workers’ health benefits of social relations (as an indicator of structural social capital) are simultaneously individual and collective. In the literature, the association between structural social capital and health of populations is examined at either the individual level (D’Hombres et al. 2010; Ronconi et al. 2012), the aggregate level (Kawachi et al. 1997, 1999) or both (Poortinga et al. 2006a,b). This paper is an empirical contribution to the debate whether the health benefits of social capital are simultaneously individual and collective. In so doing, the study is the first to relate individual and contextual social relations (as an indicator of structural social capital) to workers’ health.
The paper found various significant relationships at the individual level. Even if services in the Italian National Health System may be accessed by all residents on a universal basis, the separated/divorced, older, poorer, and unskilled employees are exposed to a higher probability of reporting poor self-perceived health and a higher probability of suffering from chronic conditions and presence of limitations in activities of daily living. On the one hand, the overall results for employees strengthen the claims concerning the existence of health disparities in Italy based on socio-economic status (Fiorillo and Sabatini 2011b). On the other, the results on workers’ self-perceived health are consistent with previous research on the whole population (Hyyppä and Mäki 2003; Portinga et al 2006a,b; D’Hombres et al. 2010; Giordano and Lindstrom 2010; Ronconi et al. 2012) and workers’ population (Datta Gupta and Kristensen 2008; Yamamura 2011).
also found regarding the relationship between housing conditions and health status. These findings show that living in a house which is damp, cold and poorly-lit is a significant negative predictor of various health outcomes of workers, thereby confirming previous research (Dunn 2000; Macyntre et al. 2000). A novel result is the significant and negative association between the unmet need for medical examination or treatment and health outcomes. Because in the dataset we have information on the reasons for unmet examination when we control for the answer “too expensive” we found similar estimates to those reported in tables 9 – 11. This evidence further reinforces the claims about the existence of workers’ health disparities based on socio-economic conditions.
With regard to the main aim of this paper, social relations measured by meetings with friends are considered as an indicator of structural social capital at both the individual and contextual level at the same time. The study suggests that individual and contextual social relations are a key predictor of the health status of workers. However, differences among health status exist with regard to these effects.
In line with the previous findings for the whole population (Bolin et al. 2003; Hyyppä and Mäki 2003; Poortinga 2006a,b), the study shows that the individual social relations variable, measured by meetings with friends, is found positively associated with the probability of declaring good self-perceived health. Thus workers with higher levels of social relations are more likely to report self-rated good health than workers with lower levels of social relations. The contextual social relations variable, measured by the average frequency with which people meet friends at the community level, is not found linked to the probability of asserting good self-perceived health. These results confirm previous investigations on the whole population affirming that in the case of workers’ good self-perceived health the health benefits, such as health information, mutual assistance and buffering effect, come from the intensity of ties with friends.
public goods, come from both intensity of ties with friends and the average intensity of ties at the community level.
Finally, when the presence of limitations in activities of daily living is used as a dependent variable, the contextual social relations variable, measured by the average frequency with which people meet friends at the community level, is found negatively linked with the probability of being limited in activities of daily living. Thus, workers with higher levels of collective social relations are less likely to be limited in ADLs than workers with lower levels of social relations at the collective level. Instead, the individual social relations variable is not found statistically significant. Thus, for limitations in daily activities status, health benefits for employees, such as public goods, come from the average intensity of ties at the community level.
The overall findings of a significant association between the two measures of social interactions and health status in Italy for employees strengthen the claims on the beneficial rule of social relations present in literature .
in social relations, which in turn limits the bias that might affect estimates of the social relations effects.
6. Conclusions
In this paper, we analysed the relationship between two measures of social relations: frequency of meetings with friends and the average frequency with which people meet friends at the community level, and three measures of workers' health ' - self-perceived health, chronic conditions and limitations in activities of daily living - using data from income and living conditions survey carried out in 2006 by the Italian Statistical Office (IT-SILC).
We find that social relations have a positive influence on health outcomes of workers in Italy and that differences among health status exist with regard to these effects. Improving the health of workers could reduce health inequalities and could increase work performance. The implication at a macro-economic level of an improvement in the health conditions of workers is relevant in Italy, where the level of labour productivity is low compared to the other developed countries (OECD 2013). Policy makers should consider the benefits, both at social and economic level, of public policies designed to improve the social and physical infrastructure of social relations.
Bibliography
Atella V., Brindisi F., Deb, P. and Rosati F. C., (2004). Determinants of access to physician services in Italy: a latent class seemingly unrelated probit approach. Health Economics, 13, 657–668.
Bilger M., Carrieri V., (2012), Health in the cities: when the neighbourhood matters more than income, Journal of Health Economics, in press.
Bolin K., Lindgren B, Lindström M., Nystedt P., (2003), Investments in social capital – implications of social interactions for the production of health, Social Science and Medicine, 56, 2379-2390.
Bourdieu P., (1980), Le capital social, Actes de la Recherche en Sciences Sociales, 31, 2-3.
Bourdieu, P., Wacquant, L. (1996). An Invitation to reflexive sociology. Cambridge: Polity.
Carlson P., (1998), Self-perceived health in east and west Europe: another European health divide, Social Science & Medicine, 46, 1355-1366.
Coleman J., (1990), Foundations of Social Theory, Cambridge: Harvard University Press.
Coleman J., (1988), Social Capital in the Creation of Human Capital, The American Journal of Sociology, 94, S95-S120
Contoyannis P., Jones A. M., (2004), Socio-economic status, health and lifestyle, Journal of Health Economics, 23, 965-995.
Cummings R. C., (1990). Job stress and the buffering effect of supervisory support, Group and Organization Studies, 8, 92-104.
Datta Gupta N., Kristensen N., (2008). Work environment satisfaction and employee health: panel evidence from Denmark, France and Spain, 1994-2001, European Journal of Health Economics, 9, 54-61.
D’Hombres R., Rocco L., Shurcke M., Mckee M., (2010). Does social capital determine health? Evidence from eight transition countries. Health Economics, 19, 56-74.
Dunn J. R., (2000), Housing and health inequalities: review and prospects for research,
Housing Studies, 15, 341-366.
Ferlander S., Mäkinen I. H., (2009), Social capital, gender and self-rated-health. Evidence from the Moscow Health Survey 2004, Social Science & Medicine, 69, 1323-1332.
Fiorillo D., (2008), Le determinanti del capitale sociale in Italia, Rivista Italiana degli Economisti, 13, 81-135.
Fiorillo D., Nappo N., (2014), Job satisfaction in Italy: individual characteristics and social relations, International Journal of Social Economics, 41, 683-704.
Fiorillo D., Sabatini S. (2011c), Structural social capital and health in Italy, Health, Econometrics and Data Group Working Paper, 11/23.
Fiorillo D., Sabatini S. (2011b). Quality and quantity: the role of social interactions in self-reported individual health, Social Science & Medicine, 73, 1644-1652.
Fiorillo D. and Sabatini S. (2011a). An exploratory analysis of the relationship between social interactions, income and health in Italy, Economics Bulletin, 31, 1336-1352.
Fischer J.A.V., Sousa-Poza A. (2009), Does job satisfaction improve the health of workers? New evidence using panel data and objective measures of health, Health Economics, 18, 71-89.
Fletcher J. M., Sindelar J. L., Yamaguchi S., (2011). Cumulative effects of job characteristics on health, Health Economics, 20, 553-570.
Folland S., (2007). Does ‘Community Social Capital’ contribute to population health?, Social Science and Medicine, 64, 2342–2354.
Giordano G. N., Lindstrom M., (2010). The impact of changes in different aspects of social capital and material conditions on self-rated health over time: a longitudinal cohort studies.
Social Science & Medicine, 70, 700-710.
Hernandez-Quevedo C., Jones A. M., Rice N., (2008). Persistence in health limitations: a European comparative analysis, Journal of Health Economics, 27, 1472-1488.
Hyyppä M. T., Mäki J., (2003), Social participation and health in a community rich in stock of social capital, Health Education Research, 18, 770-779.
Idler E. L., Benyamini Y., (1997), Self related health and mortality: a review of 27 community studies, Journal of Health and Social Behaviour, 38, 21-37.