NaDiR: Naive Distributional Response Generation
Institut f¨ur
Maschinelle Sprachverarbeitung Universit¨at Stuttgart
Gabriella Lapesa
Institut f¨ur Kognitionswissenschaft
Universit¨at Osnabr¨uck
glapesa@uos.de
Stefan Evert Professur f¨ur Korpuslinguistik FAU Erlangen-N¨urnberg
stefan.evert@fau.de
Abstract
This paper describesNaDiR(Naive DIstributional Response generation), a corpus-based system that, from a set of word stimuli as an input, generates a response word relying on association strength and distributional similarity. NaDiR participated in the CogALex 2014 shared task on multiword associations (restricted systems track), operationalizing the task as a ranking problem: candidate words from a large vocabulary are ranked by their average association or similarity to a given set of stimuli. We also report on a number of experiments conducted on the shared task data, comparing first-order models (based on co-occurrence and statistical association) to second-order models (based on distributional similarity).
1 Introduction
This paper describesNaDiR, a corpus-based system designed for thereverse association task. NaDiR is an acronym for Naive Distributional Response generation. NaDiR is naive because it is based on a very simple algorithm that operationalizes the multiword association task as a ranking problem: candi-date words from a large vocabulary are ranked by their average statistical association or distributional similarity to a given set of stimuli, then the highest-ranked candidate is selected as NaDiR’s response.
We compare models based on collocations (first-order models, see Evert (2008) for an overview) to models based on distributional similarity (second-order models; see Sahlgren (2006), Turney and Pan-tel (2010), and reference therein for a review). Previous work on this task showed that co-occurrence models outperform distributional semantic models (henceforth, DSMs), and that using rank measures improves performance because it accounts for directionality of the association/similarity (e.g., the asso-ciation from stimulus to response may be larger than the assoasso-ciation from response to stimulus). Our results corroborate both claims.
The paper is structured as follows: section 2 provides an overview of the task and of the problems we encountered in its implementation; section 3 summarizes related work; section 4 describes NaDiR in detail; section 5 reports the results of our experiments on the shared task training and test data; section 6 describes ongoing and future work on NaDiR.
2 The Task and its Problems
The shared task datasets are derived from the Edinburgh Associative Thesaurus (Kiss et al., 1973)1. The Edinburgh Associative Thesaurus (henceforth, EAT) contains free associations to approximately 8000 English cue words. For each cue (e.g.,visual) EAT lists all associations collected in the survey (e.g.,aid, eyes,aids,see,eye,seen,sight, etc.) sorted according to the number of subjects who responded with the respective word. The CogALex shared task on multiword association is based on the EAT dataset, and is in fact areverse association task(Rapp, 2014). The top five responses for a target word are provided as stimuli (e.g., aid, eyes, aids, see, eye), and the participating systems are required to generate the original cue as a response (e.g.,visual). The training and the test sets are random extracts of 2000 EAT This work is licenced under a Creative Commons Attribution 4.0 International License. Page numbers and proceedings footer are added by the organizers. License details:http://creativecommons.org/licenses/by/4.0/
1http://www.eat.rl.ac.uk/
items each, with minimal pre-processing (only items containing multiword units and non-alphabetical characters were discarded).
A key problem we had to tackle while developing our system was the unrestricted set of possible re-sponses in combination with a discrete association task, which requires the algorithm to pick exactly the right answer out of tens of thousands of possible responses. This feature makes this task much more dif-ficult than the multiple-choice tasks often used to evaluate distributional semantic models. The problem is further complicated by the fact that the response may be an inflected form and only a prediction of the exact form was accepted as a correct answer. The need for a solution to these issues motivates various aspects of the NaDiR algorithm, described in section 4.
3 Related Work
Previous studies based on free association norms differ considerably in terms of the type of task (regular free association task – one stimulus, one response vs. multiword association task – many stimuli, one response), gold standards, and key features of the evaluated models (e.g., source corpora used and choice of a candidate vocabulary from which responses are selected).
In regular free association tasks (one stimulus, one response), responses are known to contain both paradigmatically and syntagmatically related words. Rapp (2002) proposes to integrate first-order (co-occurrence lists) and second-order (bag-of-words DSMs) information to distinguish syntagmatic from paradigmatic relations by exploiting the comparison of most salient collocates and nearest neighbors.
A task derived from the EAT norms was used in the ESSLLI 2008 shared task2. Results from first-order co-occurrence data turned out to be much better than those from second-first-order DSMs, in line with the findings made by Rapp (2002) and Wettler et al. (2005).
A similar picture emerges from studies on the multiword association task. Models based on first-order co-occurrence (collocations) outperform models based on vector similarity. This superiority, however, is not validated via a direct comparison: results were obtained by studies with different features and goals (see Rapp (2014) for a review; see Griffiths et al. (2007) and Smith et al. (2013) for evaluations of models based on Latent Semantic Analysis). A specific feature of successful studies on the multiword association task is that they introduce an element of directionality (Rapp, 2013; Rapp, 2014), which allows a correct implementation of the directionality of the modeled effects (from stimulus to response). Our survey of related studies motivated the choice to base NaDiR on first-order or second-order co-occurrence statistics, and to use collocate or neighbor rank to account for directionality. Our main contri-bution to research on the reverse association task is a systematic experimental comparison of first-order and second-order models (using the same gold standard, same source corpus, and same candidate vocab-ulary), which enables us to give a sound answer to the question whether first-order models are indeed superior for multiword association tasks.
4 NaDiR
NaDiR operationalizes the multiword association task as a ranking problem. For each set of stimuli, the possible response words (“candidates”) are ranked according to their average association strength or distributional similarity to the stimulus words. The top-ranked candidate is selected as NaDiR’s response. One advantage of the ranking approach is that it provides additional insights into the experimental results: if the model prediction is not correct, the rank of the correct answer can be used as a measure how “close” the model came to the human associations.
Since neither a fixed set of response candidates nor an indication of the source of the training and test data were available (and we did not google for the training sets), we compiled a large vocabulary of possible responses. We believe that restricting the vocabulary to the 8,033 cue words in the EAT would have improved our results considerably. More details concerning the choice of the candidate vocabulary are reported in section 4.1.
NaDiR uses either first-order or second-order co-occurrence statistics to predict the association strength between stimuli and responses. In the first case (“collocations”), we apply one of several stan-dard statistical association measures to co-occurrence counts obtained from a large corpus. In the second case, association is quantified by cosine similarity in a distributional semantic model built from the same corpus. Both first-order and second-order statistics were collected from UKWaC in order to compete in the constrained track of the shared task.
Recent experiments (Hare et al., 2009; Lapesa and Evert, 2013; Lapesa et al., to appear) suggest that semantic relations are often better captured by neighbour ranks rather than direct use of statistical association measures or cosine similarity values. Therefore, NaDiR can alternatively quantify association strength by collocate rank and similarity by neighbour rank. In our experiments (section 5), we compare the different approaches.
NaDiR is designed for the multiword association task, and it contains additional features related to the particular design of the CogALex shared task:
• We reduce the number of candidates by selecting the most likely response POS with a machine-learning algorithm (section 4.1);
• NaDiR operates on lemmatized data in order to reduce sparseness. We lemmatize stimuli using a heuristic method (section 4.1), predict a response lemma, and then use machine-learning techniques to generate a plausible word form (section 4.3).
4.1 Pre-processing and Vocabulary
Our experiments were conducted on the UKWaC3 corpus. UKWaC contains 2 billion words, web-crawled from the.ukdomain between 2005 and 2007. The release of UKWaC also contains linguistic annotation (pos-tagging and lemmatization) performed with Tree Tagger4.
To assign a part-of-speech tag and a lemma to every word in the dataset without relying on external tools, we adopted the following mapping strategy based on the linguistic annotation already available in UKWaC:
1. We extracted all attested wordform/part of speech/lemma combinations from UKWaC, together with their frequency;
2. Every word form in the training set was assigned to the most frequent part of speech/lemma combi-nation attested in UKWaC.
We believe that the advantages of constructing distributional models based on lemmatized words over-come the drawbacks of this type of out-of-context lemmatization and part-of-speech assignment.
The part-of-speech information added to every word in the dataset by the mapping procedure was used to train a classifier that, given the parts of speech of the stimuli, predicts the part of speech of the response. We trained a support-vector machine, using the svmfunction from the R packagee10715, with standard settings.
The part-of-speech classifier is based on a coarse part-of-speech tagset with only five tags: N(noun), J(adjective),V(verb),R(adverb),other(closed-class words). We considered each row of the dataset as an observation, with the part of speech of the response as predicted value, and the part of speech of the stimulus words as predictors. Every observation is represented as a bag of tags, i.e., a vector listing for each of the five tags how often it occurs among the stimuli. For example, if a set of stimuli contains 3 nouns, one verb and one adjective, the corresponding bag-of-tags vector looks as follows:{N= 3;V= 1;J= 1;R= 0;other= 0}. On the training set, the part-of-speech classifier achieves an accuracy of 72%.
The vocabulary of our models only contains lemmatized open-class words (this information is avail-able in the annotation of the corpus). By inspecting the frequencies of stimuli and response words in the training dataset, we established a reasonable minimum frequency threshold for candidate words of 100 occurrences in UKWaC. With this threshold, only 10 response words and 16 stimulus words from the
3wacky.sslmit.unibo.it/doku.php?id=corpora
training dataset are excluded from the vocabulary. Given the large size of the dataset, we decided that a minimal loss in coverage would be justified by the reduced computational complexity. The resulting candidate vocabulary contains 155,811 words.
4.2 First- and Second-order Statistics
The aim of this section is to describe the parameters involved in the collection of first-order and second-order statistics from UKWaC. All models have been built and evaluated using the UCS toolkit6and the wordspacepackage for R (Evert, to appear)7.
First-order Models
Collocation data are compiled from UKWaC based on the vocabulary described in section 4.1. Both nodes (rows of the co-occurrence matrix) and collocates (columns of the co-occurrence matrix) are cho-sen from this vocabulary. Collection of first-order models involved the manipulation of a number of parameters, briefly summarized below.
We adopted three differentwindow sizes:
• symmetric window, 2 words to the left and to the right of the node; • asymmetric window, 3 words to the left of the node;
• asymmetric window, 3 words to the right of the node. We tested the followingassociation scores(Evert, 2008):
• co-occurrence frequency;
• simple log-likelihood (similar to local MI used by Baroni and Lenci (2010)); • conditional probability.
Our experiments involved a third parameter, theindex of association strength, which determines al-ternative ways of quantifying the degree of association between targets and contexts in the first-order model. Given two wordsaandbrepresented in a first-order model, we propose two alternative ways of quantifying the degree of association between aandb. The first option (and standard in corpus-based modeling) is to compute theassociation scorebetweenaandb. The alternative choice is based onrank among collocates. Given two wordsaandb, in our taskstimulusandpotential response, we consider:
• forward rank: the rank of the potential response among the collocates of the stimulus; • backward rank: the rank of the stimulus among the collocates of the potential response; • average rank: the average of forward and backward rank.
Second-order Models
Based on the results of a large-scale evaluation of DSM parameters (Lapesa and Evert, under review) and the modeling of semantic priming effects (Lapesa and Evert, 2013; Lapesa et al., to appear), we identified a robust configuration of parameters for second-order models that we decided to adopt in this study. Second-order models involved in our experiments share the following parameter settings:
• The target words (rows) are defined by the vocabulary described in section 4.1.
• The context words (columns) are the 50,000 most frequent context words in the respective co-occurrence matrices. The 50 most frequent words in UKWaC are discarded.
• Co-occurrence vectors are scored with a sparse version of simple-log likelihood, in which negative values clamped to zero in order to preserve the sparseness of the co-occurrence matrix. Scored vectors are rescaled by applying a logarithmic transformation.
• We reduce the scored co-occurrence matrix to 1000 latent dimensions using randomized SVD (Halko et al., 2009).
• We adoptcosine distance(i.e. the angle between vectors) as a distance metric for the computation of vector similarity.
6http://www.collocations.de/software.html
Our experiments on second-order models involved the manipulation of two parameters: window size
andindex of association strength.
The size of the context window quantifies the amount of shared context involved in the computation of similarity. We expect the manipulation of window size to be crucial in determining model performance, as different context windows will enable the model to capture different types of relations between re-sponse and stimulus words (Sahlgren, 2006; Lapesa et al., to appear). In our experiments with NaDiR, we adopted three differentwindow sizes:
• symmetric window, 2 words to the left and to the right of the target; • symmetric window, 4 words to the left and to the right of the target; • symmetric window, 16 words to the left and to the right of the target.
The values forindex of association strengthare the same as for the first-order models, computing ranks among the nearest neighbors of the stimulus or response word. The use of rank-based measures is of particular interest, because: (i) it allows us to model directionality (while, for example, cosine distance is symmetric); (ii) it already proved successful in modeling behavioral data (Hare et al., 2009; Lapesa and Evert, 2013); (iii) since the vocabulary of first-order and second-order models are identical, rank-based measures allow a direct comparison between the two classes of models, as well as experiments based on their combination.
4.3 Response Generation
To generate a response for a set of stimuli in the training/test dataset, we apply the following procedure:
1. For each set of stimuli, we compute association strengths or similarities between each stimulus and each response candidate, adopting one of the measures described in section 4.2.
2. From the set of potential responses, we select the words whose POS agrees with the predictions of the classifier described in section 4.1. Stimulus words are discarded from the potential answers. 3. We compute the average association strength or similarity across all five stimuli; if a stimulus does
not appear in the model, it is simply omitted from the average.
4. The top-ranked candidate is the POS-disambiguated lemma suggested as a response by NaDiR. 5. We generate a suitable word form by inverting the heuristic lemmatization; if the full Penn tag (e.g.,
NNS: noun, common, plural;NN: noun, common, singular or mass, etc.) of the response is known, this step can be implemented as a deterministic lookup (since a word form is usually determined uniquely by lemma and Penn tag). We therefore trained a second SVM classifier that predicts the full Penn tag of the response based on the full tags of the stimuli. On the training set, this part-of-speech classifier reaches an accuracy of 68%.
5 Experiments
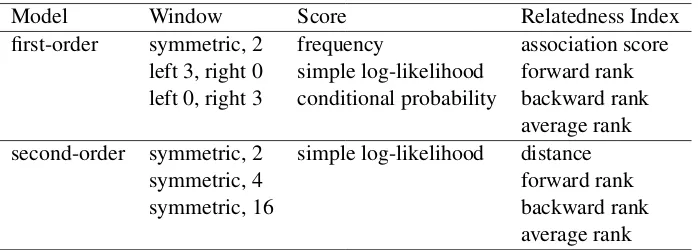
In our experiments, we compared first-order (collocations) and second-order (DSM) models; for each class of models, we evaluated the different parameter values described in section 4.2. Table 1 summarizes the evaluated parameters for first-order and second-order models.
Model Window Score Relatedness Index
first-order symmetric, 2 frequency association score left 3, right 0 simple log-likelihood forward rank left 0, right 3 conditional probability backward rank
average rank second-order symmetric, 2 simple log-likelihood distance
symmetric, 4 forward rank
symmetric, 16 backward rank
[image:5.595.126.475.619.744.2]average rank
Tables 2 to 5 display the results of our experiments on the training data, separately for first-order (tables 2-4) and second-order models (table 5). Parameter configurations are reported in theParametercolumn8. The number of correct responses in the lemmatized version is reported in the columnLemma(showing how often our system predicted the correct lemma). The columnWordformreports the number of correct responses for which, before inverting the lemmatization, the inflected form was already identical to the lemma. As the task of predicting exactly one word is particularly difficult, we further characterize the performance of our evaluated models by reporting the number of cases in which the correct answer from the training set was among the first 10 (<10), 50 (<50), or 100 (<100) ranked candidates. In the last column, we report the average rank of the correct responses (Avg correct).
The results reported in tables 2 to 5 allowed us to identify best parameter configurations for the first-order (symmetric 2 words window, frequency, backward rank) and second-first-order models (2 words win-dow, distance). We evaluated these configurations on the test data (table 6). Table 7 compares the performance of the best first-order and the best second-order model on the training and test datasets, both for lemmatized response (Training-Lemma,Test-Lemma) and generation of the correct word form (Training-Inflected,Test-Inflected).
A considerable portion of the experiments reported in this paper were conducted after the submission deadline of the CogALex shared task. As a consequence, our submitted results do not correspond to the best overall configuration found in the evaluation study. The submission was based on a second order model, a 4-word window, and cosine distance as index of distributional similarity. In this configuration, NaDiR generated 262 correct responses, corresponding to an accuracy of 13%.
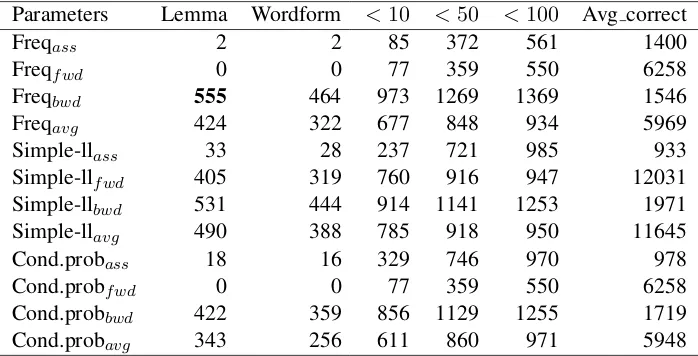
Parameters Lemma Wordform <10 <50 <100 Avg correct
Freqass 2 2 85 372 561 1400
Freqfwd 0 0 77 359 550 6258
Freqbwd 555 464 973 1269 1369 1546
Freqavg 424 322 677 848 934 5969
Simple-llass 33 28 237 721 985 933
Simple-llfwd 405 319 760 916 947 12031
Simple-llbwd 531 444 914 1141 1253 1971
Simple-llavg 490 388 785 918 950 11645
Cond.probass 18 16 329 746 970 978
Cond.probfwd 0 0 77 359 550 6258
Cond.probbwd 422 359 856 1129 1255 1719
[image:6.595.124.473.346.524.2]Cond.probavg 343 256 611 860 971 5948
Table 2: First Order Models - Symmetric Window: 2 words to the left/right of the node - Training Data
5.1 Discussion
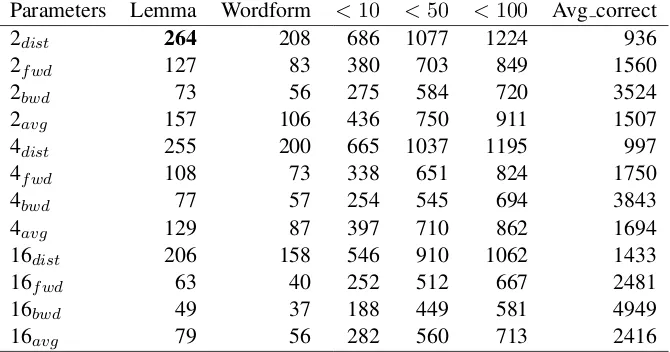
The results of our experiments are in line with the tendencies identified in the literature (see section 3). First-order models based on direct co-occurrence (high scores are assigned to words that co-occur), outperform second-order models based on distributional similarity (smaller distances between words that occur in similar contexts).
For the first-order models, the best index of association strength is backward rank (the rank of the stimulus among the collocates of the potential response), fully congruent with the experimental setting (in the EAT norm, subjects produced the stimuli as free associations of the expected response). Surpris-ingly, frequency outperforms simple-log likelihood (which is usually considered to be among the best association measures for the identification of collocations). In line with the results achieved by Rapp (2014), a symmetric window of 2 words to the left and to the right of the target achieves best results.
For the second-order models, the smallest context window (2 words) achieves the best performance.
Parameters Lemma Wordform <10 <50 <100 Avg correct
Freqass 1 1 63 279 450 1733
Freqfwd 0 0 32 219 395 7575
Freqbwd 358 292 789 1124 1247 1974
Freqavg 277 191 515 690 793 7251
Simple-llass 23 18 196 618 878 1259
Simple-llfwd 271 196 605 789 842 14177
Simple-llbwd 369 296 737 1002 1135 2848
Simple-llavg 346 251 636 798 845 13760
Cond.probass 7 6 209 588 806 1234
Cond.probfwd 0 0 32 219 395 7575
Cond.probbwd 284 230 659 974 1109 2318
[image:7.595.124.474.276.454.2]Cond.probavg 201 137 462 711 851 7230
Table 3: First Order Models – Asymmetric Window: 3 words to the left of the node – Training Data
Parameters Lemma Wordform <10 <50 <100 Avg correct
Freqass 1 1 63 279 450 1733
Freqfwd 0 0 32 219 395 7575
Freqbwd 358 292 789 1124 1247 1974
Freqavg 277 191 515 690 793 7251
Simple-llass 25 22 220 643 891 1168
Simple-llfwd 321 250 708 895 936 12244
Simple-llbwd 507 424 884 1142 1246 2223
Simple-llavg 402 314 740 901 939 11868
Cond.probass 26 20 279 665 864 1282
Cond.probfwd 0 0 59 298 498 7543
Cond.probbwd 381 319 791 1094 1201 1981
Cond.probavg 278 209 535 800 922 7214
Table 4: First Order Models – Asymmetric Window: 3 words to the right of the node – Training Data
Parameters Lemma Wordform <10 <50 <100 Avg correct
2dist 264 208 686 1077 1224 936
2fwd 127 83 380 703 849 1560
2bwd 73 56 275 584 720 3524
2avg 157 106 436 750 911 1507
4dist 255 200 665 1037 1195 997
4fwd 108 73 338 651 824 1750
4bwd 77 57 254 545 694 3843
4avg 129 87 397 710 862 1694
16dist 206 158 546 910 1062 1433
16fwd 63 40 252 512 667 2481
16bwd 49 37 188 449 581 4949
16avg 79 56 282 560 713 2416
Table 5: Second order models – Training data
[image:7.595.132.467.491.667.2]Model Lemma Wordform <10 <50 <100 Avg correct
first-order 572 490 1010 1303 1408 1366
second-order 304 246 734 1119 1256 569
Table 6: Best models (first order and second order) – Performance on test data
Model Training-Lemma Training-Inflected Test-Lemma Test-Inflected first-order 27.7% (555) 26.9% (538) 28.6% (572) 27.7% (554) second-order 13.2% (264) 12.0% (241) 15.0% (304) 14.0% (279)
Table 7: Performance (% accuracy and number of correct responses) of the best first-order and second-order model on training vs. test dataset (lemmatized response vs. response with restored inflection)
The observation for second-order models contrasts with previous work showing that rank consistently outperforms distance in modeling priming effects (Lapesa and Evert, 2013; Lapesa et al., to appear) and also in standard tasks such as prediction of similarity ratings and noun clustering (Lapesa and Evert, un-der review). Among the standard tasks, the only case in which the use of neighbor rank did not produce significant improvements with respect to vector distance was the TOEFL multiple-choice synonymy task. Despite clear differences, the TOEFL task and the reverse association task share the property that they involve multiple stimuli. The results presented in this paper, together with those achieved on the TOEFL task, seem to suggest that a better strategy for the use of neighbor rank needs to be developed when multiple stimuli are involved.
6 Conclusions and Future Work
The results of the evaluation reported in this paper confirmed the tendencies identified in previous studies: first-order models, based on direct co-occurrence, outperform second-order models, based on distribu-tional similarity. We consider the experimental results described in this paper as a first exploration into the dynamics of the reverse association task, and we believe that our systematic evaluation of first- and second-order models represents a good starting point for future work, which targets improvements of NaDiR at many levels.
The first point of improvement concerns the size of the vocabulary. We aim at finding a more op-timal cutoff on the training data, for example by implementing a frequency bias similar to Wettler et al. (2005). We are confident that NaDiR will significantly benefit from a smaller range of potential responses (compared to the 155,811 lemmatized candidate words in the current version).
We are also conducting experiments using log ranks instead of plain ranks: since we compute an arith-metic mean of the rank values, a single very high rank (from a poorly matched stimulus) will dominate the average. We therefore assume that log ranks will improve results and make NaDiR’s responses more robust.
An interesting research direction targets the integration of first- and second-order statistics in the pro-cess of response generation. The evaluation results reported in this paper revealed that a very small context window achieves the best performance for second-order models: as widely acknowledged in the literature (Sahlgren, 2006; Lapesa et al., to appear), smaller context windows highlight paradigmatic relations. First-order models, on the other hand, highlight syntagmatic relations (Rapp, 2002). The best second-order and first-order models from the evaluation reported in this paper are likely to focus on dif-ferent types of relations between response and stimulus words: this leads us to believe that an integration of the two sources may produce improvements in NaDiR’s performance.
At a general level, we plan to make more elaborate use of the training data. In the experiments presented in this paper, training data were used to set a frequency threshold for potential responses, train the part-of-speech classifiers, and find the best configuration for first- and second-order models.
association task, with the additional advantage that the relations between concepts and properties in those datasets are labelled with property types for the McRae norms (e.g., encyclopedic, taxonomic, situated) or semantic relations (e.g., hypernymy, meronymy, event-related) for BLESS. This allows a specific evaluation for each property type or semantic relation, which will in turn give new insights into the semantic knowledge encoded in the different corpus-based representations (first order vs. second order vs. hybrid) and how model parameters affect these representations (e.g., window size in the comparison of syntagmatic vs. paradigmatic relations).
Acknowledgments
Gabriella Lapesa’s research is funded by the DFG Collaborative Research Centre SFB 732 (University of Stuttgart).
References
Marco Baroni and Alessandro Lenci. 2010. Distributional memory: A general framework for corpus-based semantics.Computational Linguistics, 36(4):1–49.
Marco Baroni and Alessandro Lenci. 2011. How we BLESSed distributional semantic evaluation. InProceedings
of the GEMS 2011 Workshop on GEometrical Models of Natural Language Semantics, GEMS ’11, pages 1–10.
Association for Computational Linguistics.
Stefan Evert. 2008. Corpora and collocations. In Anke L¨udeling and Merja Kyt¨o, editors,Corpus Linguistics. An
International Handbook, chapter 58. Mouton de Gruyter, Berlin, New York.
Stefan Evert. to appear. Distributional semantics in R with the wordspace package. InProceedings of COLING
2014: System Demonstrations.
Thomas L. Griffiths, Mark Steyvers, and Joshua B. Tenenbaum. 2007. Topics in semantic representation. Psycho-logical Review, 114:211–244.
Nathan Halko, Per-Gunnar Martinsson, and Joel A. Tropp. 2009. Finding structure with randomness: Stochastic algorithms for constructing approximate matrix decompositions. Technical Report 2009-05, ACM, California Institute of Technology.
Mary Hare, Michael Jones, Caroline Thomson, Sarah Kelly, and Ken McRae. 2009. Activating event knowledge.
Cognition, 111(2):151–167.
G. R. Kiss, C. Armstrong, R. Milroy, and J. Piper. 1973. An associative thesaurus of English and its computer analysis. InThe Computer and Literary Studies. Edinburgh University Press.
Gabriella Lapesa and Stefan Evert. 2013. Evaluating neighbor rank and distance measures as predictors of se-mantic priming. InProceedings of the ACL Workshop on Cognitive Modeling and Computational Linguistics
(CMCL 2013), pages 66–74.
Gabriella Lapesa, Stefan Evert, and Sabine Schulte im Walde. to appear. Contrasting syntagmatic and paradig-matic relations: Insights from distributional semantic models. InProceedings of the 3rd Joint Conference on
Lexical and Computational Semantics (*SEM). Dublin, Ireland, August 2014.
Ken McRae, George Cree, Mark Seidenberg, and Chris McNorgan. 2005. Semantic feature production norms for a large set of living and nonliving things.Behavior Research Methods, 4(37):547—559.
Reinhard Rapp. 2002. The computation of word associations: Comparing syntagmatic and paradigmatic ap-proaches. InProceedings of the 19th International Conference on Computational Linguistics - Volume 1, pages 1–7.
Reinhard Rapp. 2013. From stimulus to associations and back. InProceedings of the 10th Workshop on Natural
Language Processing and Cognitive Science.
Reinhard Rapp. 2014. Corpus-based computation of reverse associations. InProceedings of the Ninth
Interna-tional Conference on Language Resources and Evaluation (LREC’14).
Kevin A. Smith, David E. Huber, and Edward Vul. 2013. Multiply-constrained semantic search in the remote associates test. Cognition, 128(1):64–75.
Peter D. Turney and Patrick Pantel. 2010. From frequency to meaning: Vector space models of semantics.Journal of Artificial Intelligence Research, 37:141–188.