Predicting MOOC Dropout over Weeks Using Machine Learning Methods
Marius Kloft, Felix Stiehler, Zhilin Zheng, Niels Pinkwart
Department of Computer Science Humboldt University of Berlin
Berlin, Germany
{kloft, felix.stiehler, zhilin.zheng, pinkwart}@hu-berlin.de
Abstract
With high dropout rates as observed in many current larger-scale online courses, mechanisms that are able to predict stu-dent dropout become increasingly impor-tant. While this problem is partially solved for students that are active in online fo-rums, this is not yet the case for the more general student population. In this pa-per, we present an approach that works on click-stream data. Among other features, the machine learning algorithm takes the weekly history of student data into ac-count and thus is able to notice changes in student behavior over time. In the later phases of a course (i.e., once such his-tory data is available), this approach is able to predict dropout significantly better than baseline methods.
1 Introduction
In the past few years, with their dramatically in-creasing popularity, Massive Open Online Courses (MOOCs) have become a way of online learning used across the world by millions of people. As a result of efforts conducted (sometimes jointly) by academia and industry, many MOOC providers (such as Coursera, Udacity, Edx, or iversity) have emerged, which are able to deliver well-designed online courses to learners. In typical MOOC plat-forms, learners can not only access lecture videos, assignments and examinations, but can also use collaborative learning features such as online dis-cussion forums. Despite all the MOOC features and benefits, however, one of the critical issues re-lated to MOOCs is their high dropout rate, which puts the efficacy of the learning technology into question. According to the online data provided by Jordan (2014), most MOOCs have comple-tion rates of less than 13%. While discussions
are still ongoing as to whether these numbers are actually a problem indicating partial MOOC fail-ures or whether they merely indicate that the com-munity of MOOC learners is diverse and by far not every participant intends to complete a course, researchers and MOOC providers are certainly interested in methods for increasing completion rates. The analysis of MOOC data can be of help here. For instance, a linguistic analysis of the MOOC forum data can discover valuable indica-tors for predicting dropout of students (Wen et al., 2014). However, only few MOOC students (roughly 5-10%) use the discussion forums (Rose and Siemens, 2014), so that dropout predictors for the remaining 90% would be desirable. In order to get insights into the learning behaviors of this majority of participants, the clickstream data of the MOOC platform usage is the primary source for analysis in addition to the forum data. That is also the motivation of the shared task proposed by the MOOC workshop at the Conference on Em-pirical Methods in Natural Language Processing (EMNLP 2014) (Rose and Siemens, 2014). Ad-dressing this task, we propose a machine learning method based on support vector machines for pre-dicting dropout between MOOC course weeks in this paper.
The rest of this paper is organized as follows. We begin with the description of the data set and features extracted from the data set. We then de-scribe our prediction model. Next, the prediction results and some experimental findings are pre-sented. Finally, we conclude our work in this pa-per.
2 Dataset
The dataset we used in this paper was prepared for the shared task launched by the Modeling Large Scale Social Interaction in Massively Open On-line Courses Workshop at the Conference on Em-pirical Methods in Natural Language Processing
(EMNLP 2014) (Rose and Siemens, 2014). The data was collected from a psychology MOOC course which was launched in March 2013. The whole course lasted for 12 weeks with 11,607 par-ticipants in the beginning week and 3,861 partici-pants staying until the last course week. Overall, 20,828 students participated, with approximately 81.4% lost at last. Note that the data cover the whole life cycle of this online course up to 19 weeks. The original dataset for this task had two types of data: clickstream data and forum data. In this paper, we only make use of clickstream data to train our prediction model and we do not further consider forum data. Obviously, this will lower the prediction quality for the 5% of students that use the forum, but it will hopefully shed light on the utility of the clickstream data for the larger set of all participants. The clickstream data includes 3,475,485 web log records which can be gener-ally classified into two types: the page view log and the lecture video log. In the following sec-tion, we will describe attributes extracted from the raw clickstream data which (we believed) could be correlated to drop-out over the 12 course weeks. 2.1 Attributes description
Our model is an attempt to predict the participants’ drop-out during the next week (defined as no ac-tivity in that week and in any future week) using the data of the current and past weeks. Conse-quently, all attributes are computed for each par-ticipant and for each week. Note that this results in having more data for later course weeks, since the approach allows for comparing a student’s cur-rent activity with the activity of that student in the past weeks. The complete attributes list is shown in Table 1.
2.2 Attribute Generation
The attributes required for the predictions are ex-tracted by parsing the clickstream file where each line represents a web request. For each line the corresponding Coursera ID is taken from the database containing the forum data and the course week is calculated from the timestamp relative to the start date of the course. Then the request is analysed regarding its type and every present at-tribute is saved.
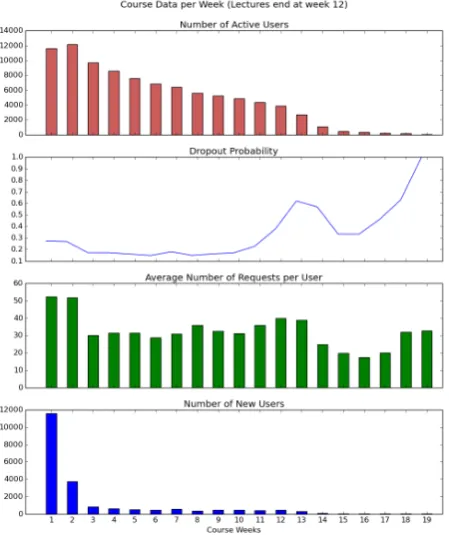
[image:2.595.310.535.65.333.2]After collecting the raw attributes, the data needs to be post-processed. There are 3 kinds of attributes: attributes that need to be summed up, attributes that need to be averaged and attributes
Figure 1: Several basic properties of the analyzed data set.
that need to be decided by majority vote. After the post-processing the data consists of lists of at-tributes each correlated to a unique tuple consist-ing of the Coursera ID and the course week num-ber. Invalid attributes are getting replaced with the median of that week. Note that every missing week is getting replaced by the median of the at-tributes of active users in that week that were also active in the original week.
2.3 A First Glance on the Data Set
We have visualized several basic properties of the data in Figure 1. We observe that the number of active user quickly decreases over time. Further-more the dropout probability is especially high in the first two weeks, and then of course at the end of the course starting around week 11 and 12.
3 Methodology & Results
In this section we concisely describe the employed feature extraction and selection pipeline, as well as the employed machine learning algorithms. For each week of the course (i = 1, . . . ,19) we com-puted the dropout label of each of the ni
ID Attributes
1 Number of requests: total number of requests including page views and video click actions 2 Number of sessions:number of sessions is supposed to be a reflection of high engagement,
because more sessions indicate more often logging into the learning platform
3 Number of active days: we define a day as an active day if the student had at least one session on that day
4 Number of page views:the page views include lecture pages, wiki pages, homework pages and forum pages
5 Number of page views per session: the average number of pages viewed by each partici-pant per session
6 Number of video views:total number of video click actions
7 Number of video views per session:average number of video click actions per session 8 Number of forum views:number of course discussion forum views
9 Number of wiki views:number of course wiki page views 10 Number of homework page views
11 Number of straight-through video plays:this is a video action attribute. Straight-trough playing video means that the participates played video without any jump (e.g. pause, re-sume, jump backward and jump forward). Since the lecture videos are the most important learning resource for the learning participants, the video playing should be investigated as other researchers did (Brotherton and Abowd, 2004). In this paper, five video behaviors are taken into account including the number of full plays as well as four others: start-stop during video plays, skip-ahead during video plays, relisten during video plays and the use of low play rate
12 Number of start-stop during video plays:start-stop during video plays stands for a lecture video being paused and resumed
13 Number of skip-ahead during video plays:skip-ahead means that the participant played a video with a forward jump
14 Number of relisten during video plays: relisten means that a backward jump was made as the participant was playing a video
15 Number of slow play rate use: this attribute is considered as an indicator of weak under-standing of the lecturer’s lecture presentation, possibly because of language difficulties or a lack of relevant background knowledge
16 Most common request time:our attempt with this attribute is to separate day time learning from night time learning. We define night time from 19:00 to 6:59 in the morning and the other half day as day time
17 Number of requests from outside of Coursera: this is to discover how many requests from third-party tools (such as e-mail clients and social networks) to the course were made, which could be an indicator of the participant’s social behavior
18 Number of screen pixels: the screen pixels is an indicator of the device that the student used. Typically, mobile devices come with fewer pixels
19 Most active day: through this attribute, we can investigate if starting late or early could have an impact on dropout
20 Country: this information could reflect geographical differences in learning across the world
21 Operating System 22 Browser
Table 1: Attributes list.
This resulted in label vectorsyi ∈ {−1,1}ni for
vious section. The features with ids 1–19 could be represented a single real number, while all other features had to be embedded into a multidimen-sional space. For simplicity we thus first focused on features 1–19. For each weekiof the course, this results in a matrix Xipreliminary ∈ R19×ni,
the rows and columns of which correspond to the features and user ids, respectively. We then en-riched the matrices by considering also the “his-tory” of the features, that is, for the data of week
i, all the features of the previous weeks were ap-pended (as additional rows) to the actual data ma-trix, resulting in Xi ∈ R19i×ni. We can write
this asXi = (x1, . . . , xni), wherexj is the
fea-ture vector of thejth user. Box plots of these fea-tures showed that the distribution is highly skewed and non-normal, and furthermore all features are non-negative. We thus tried two standard features transformations: 1. logarithmic transformation 2. box-cox transformation. Subsequent box plots in-dicated that both lead to fairly non-skewed distri-butions. The logarithmic transformation is how-ever much faster and lead to better results in later pipeline steps, which is why it was taken for the remaining experiments.
Subsequently, all features were centered and normalized to unit standard deviation. We then performed simple t-tests for each feature and com-puted also the Fisher scorefj =
qµ +−µ−
σ2
++σ2−, where
µ±andσ±2 are the mean and variance of the
pos-itive (dropout) and negative class, respectively. Both t-tests and Fisher scores lead to comparable results; however, we have made superior experi-ences with the Fisher score, which is why we focus on this approach in the following methodology. We found that the video features (id 11–15), the most common request time (id 17), and the most active day feature (id 19) consistently achieved scores very close to zero, which is why they were discarded. The remaining features are shown in Figure 2 (a similar plot was generated using t-tests and found to be consistent with the Fisher scores, but is omitted due to space constraints). The re-sults indicate that features related to a more bal-anced behaviour pattern over the course of a week (especially the number of sessions and number of active days) were (weakly) predictive of dropout in the beginning of the course. From week 6 to 12 we could also measure a rising importance of the number of wiki page views (id 9) and home-work submission page views (id 10). Past week 12
features related to activity in a more general way like the number of requests (id 1) or the number of page views (id 4) became the most predicative.
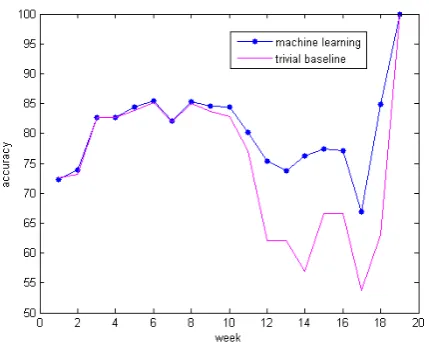
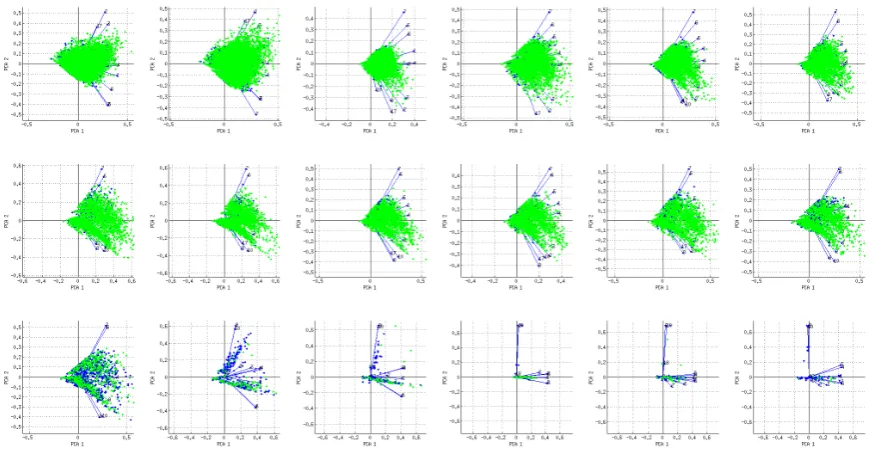
We proceeded with an exploratory analysis, where we performed a principal component anal-ysis (PCA) for each week, the result is shown in Figure 3. The plot indicates that the users that have dropped out can be better separated from the users that did not drop out when the week id increases. To follow up on this we trained, for each week, a linear support vector machine (SVM) (Cortes and Vapnik, 1995) using the -s 2 option in LI-BLINEAR (Fan et al., 2008), which is one of the fastest solvers to train linear SVMs (Fan et al., 2008). The SVM computes an affine-linear pre-diction functionf(x) :=hw, xi+b, based on max-imizing the (soft) margin between positive and negative examples:(w, b) :=argminw,b 1
2||w||2+
CPni=1max(0,1−yi(hw, xii+b). Note that this
is very similar to regularized logistic regression, which uses the term1/(1+exp(−yi(hw, xii+b)))
instead ofmax(0,1−yi(hw, xii+b), but with
ad-ditional sparsity properties (only a subset of data points are active in the final solution) that make it more robust to outliers. The prediction accuracy was estimated via 5-fold cross validation. The reg-ularization parameter was found to have little in-fluence on the prediction accuracy, which is why it was set to the default valueC = 1. We compared our SVM to the trivial baseline of a classifier that constantly predicts either -1 or 1; if the dropout probability in week i is denoted by pi, then the
classification accuracy of such a classifier is given by acctrivial := max(pi,1−pi). The result of this
experiment is shown in Figure 4. Note that we found it beneficial to use the “history” features, that is the information about the previous weeks only within the weeks 1–12. For the weeks 13–19 we switched the history features off (also the PCA above is computed without the history features). We observe from the figure that for weeks 1–8 we can not predict the dropout well, while then the prediction accuracy steadily increases. Our hy-pothesis here is that this could result from the more and more history features being available for the later weeks.
4 Conclusion
Figure 4: SVM classification accuracies per week. The baseline accuracy is computed asmax(pi,1−
pi), wherepi denotes the weekwise dropout
prob-ability.
heart of our approach lies the extraction of numer-ical features capturing the activity level of users (e.g., number of requests) as well technical fea-tures (e.g., number of screen pixels in the em-ployed device/computer). We detected significant signals in the data and achieved an increase in pre-diction accuracy up to 15% for some weeks of the course. We found the prediction is better at the end of the course, while at the beginning we still detect rather weak signals. While this paper focuses on clickstream data, the approach could in principle also combined with forum data (e.g., using mul-tiple kernel learning (Kloft et al., 2011)), which we would like to tackle in future work. Further-more, another interesting direction is to explore non-scalar features (e.g., country, OS, browser, etc.) and non-linear support vector machines.
References
Katy Jordan. MOOC Completion Rates: The Data. Availabe at:
http://www.katyjordan.com/MOOCproject.html. [Accessed: 27/08/2014].
Miaomiao Wen, Diyi Yang and Carolyn P. Rose. Lin-guistic Reflections of Student Engagement in Mas-sive Open Online Courses. ICWSM’14, 2014. Carolyn Rose and George Siemens. Shared Task on
Prediction of Dropout Over Time in Massively Open Online Courses. Proceedings of the 2014 Empirical Methods in Natural Language Processing Workshop on Modeling Large Scale Social Interaction in Mas-sively Open Online Courses, Qatar, October 2014.
Jason A. Brotherton and Gregory D. Abowd. Lessons learned from eClass: Assessing automated capture and access in the classroom. ACM Transactions on Computer-Human Interaction, Vol. 11, No. 2, pp. 121–155, June 2004.
C. Cortes and V. Vapnik. Support-vector networks.
Machine learning, 20(3):273–297, 1995.
R.-E. Fan, K.-W. Chang, C.-J. Hsieh, X.-R. Wang, and C.-J. Lin. LIBLINEAR: A library for large linear classification. Journal of Machine Learning Re-search (JMLR), 9:1871–1874, 2008.
M. Kloft, U. Brefeld, S. Sonnenburg, and A. Zien. `p
Figure 2: Fisher scores indicate which features are predictive of the dropout. Features are ordered from left to right with increasing ids; i.e., pink indicates the number of requests (feature id 1), cyan the number of sessions (feature id 2), etc. In particular, we observe that features related to a more balanced behaviour pattern such as the number of active days (feature id 3) are the most important ones in the first couple of weeks while more general features like the number of requests rise in importance past week 12.
[image:6.595.75.514.471.697.2]