%
Small Medium Large
(10-49) (50-249) (250+)
Industry 51.4 67.3 84.2 56.7
Services 38.1 57.5 63.1 41.3
Total industry and services 42.7 62.5 74.9 47.2
Innovation rates by sector and size of enterprise, 2004 - 2006
Source: CSO/Forfás - Community Innovation Survey 2004 - 2006
All enterprises
statistical
release
27 June 2008Community Innovation Survey
2004-2006 – First Findings
47% of enterprises engaged in innovation activities
In the period 2004 to 2006 inclusive, over 47% of enterprises with ten or more persons engaged in Ireland indicated that they were active innovators. Almost 57% of industrial enterprises were classed as innovation active while 41% of service enterprises were innovation active.
Large industrial enterprises had innovation rates of 84% compared to 63% of similarly sized service enterprises. In excess of 67% of medium sized industrial enterprises engaged in innovation activity in the period while 58% of service enterprises were innovation active. Small industrial enterprises (ten to forty-nine persons engaged) had an innovation activity rate of 51% compared to 38% of small service sector enterprises.
The figures in this release also show that:
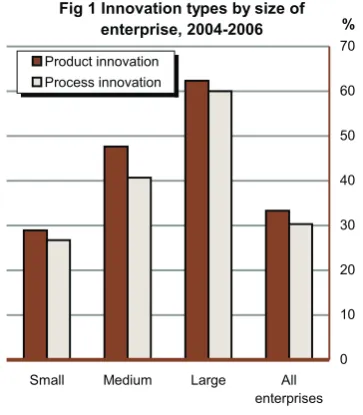
¨ In excess of 33% of enterprises were engaged in product innovation while 30% were engaged in process innovation.
¨ Almost 13% of turnover in the industrial and services sectors in 2006 was estimated to be the result of product innovations between 2004 and 2006.
¨ Total spending on innovation-related activities was almost €4.6bn in 2006.
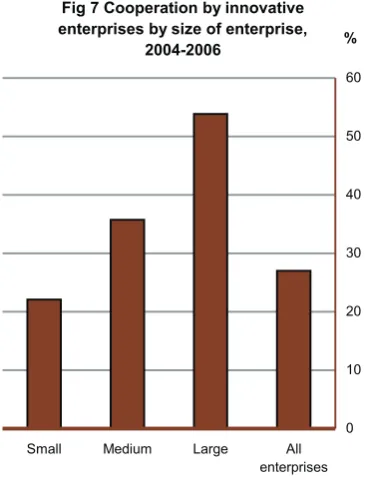
¨ Of those enterprises who were innovation active, 27% engaged in innovation collaboration.
¨ The principle barriers to innovation for those firms who did not engage in any innovation activities in the period were a lack of funds and high innovation costs.
¨ Just under 42% of enterprises with ten or more persons engaged introduced an organisational innovation in the three years 2004 to 2006.
Methodological changes have been introduced in the CIS 2004-2006. As a consequence ofthis, no conclusions should be drawn regarding the direction or scale of any real changes between CIS 2002-2004 (CIS4) and CIS 2004-2006.
For further information contact Brian Ring (CSO) 021 453 5747 or Andrew Stockman (Forfás) 01 607 3224.
This release presents first results from the Community Innovation Survey (CIS) of enterprises in Ireland and it is expected that a more detailed report will be published in the coming months. The survey collected information about product and process innovations along with other key variables for the three year period 2004 to 2006 inclusive.
The CIS was previously conducted by Forfás but is now jointly conducted by the CSO and Forfás to increase efficiency in the collection of statistical data and to reduce the burden on the participating enterprises. Data were collected in accordance with Section 33 of the Statistics Act, 1993 and with EU law and the survey was carried out under the agreed set of international rules as laid out in the OECD Oslo manual. Data are strictly confidential and will be used only for statistical purposes. See Background Notes on page 8 for further information.
Enquiries to:
Central Statistics Office
Business Statistics Integration Section
LoCall: 1890 313 414 (ROI) 0870 876 0256 (UK/NI)
Tel: +353 21 453 5000 Ext. 5350 Fax: +353 21 453 5553 e-mail: [email protected] Web: www.cso.ie
Director General: Gerard O'Hanlon
or
Forfás:
Science & Technology Indicators Unit
Tel: 01 607 3224 Fax: 01 607 3030
email: [email protected] Web: www.forfas.ie
ãCentral Statistics Office
The contents of this release may be quoted provided the source is given clearly and accurately. Reproduction for own or internal use is permitted.
Innovation rates by size of enterprise, 2004 - 2006
0 10 20 30 40 50 60 70 80
Small Medium Large All
enterprises
Innovation Types
Enterprises who are innovation active engage in product innovation, process innovation or both product and process innovation. In addition, some enterprises have ongoing or abandoned innovation activities.
In the period 2004 to 2006, just over 33% of all enterprises were engaged in product innovations, 30% of enterprises were engaged in process innovations and 2% of enterprises had ongoing or abandoned innovation activities.
Product and process innovation rates tended to be higher as the size of the enterprise increased with large enterprises more than twice as likely to have these types of innovation activities compared with small enterprises. While 29% of small enterprises were product innovators, 48% of medium enterprises were active in product innovation and over 62% of large enterprises were engaged in product innovations. Similarly, 27% of small enterprises engaged in process innovations compared to 41% of medium enterprises and 60% of large enterprises.See Table 1 and Figure 1.
Innovation rates for all types of innovation were higher in the industrial sector when compared to the services sector. Almost 57% of all industrial enterprises engaged in some type of innovation activity over the period compared to 41% of all service enterprises. In excess of 40% of industrial companies were engaged in product innovations while 29% of service enterprises were engaged in product innovations. Just under 38% of enterprises in the industrial sector were process innovators compared to 26% of service enterprises.
Large industrial enterprises were both the most active product innovators (68%) and process innovators (71%). Just over 56% of large service sector enterprises engaged in product innovations while 46% engaged in process innovations.See Table 2 and Figure 2.
Fig 2 Innovation types by sector, 2004-2006
0 5 10 15 20 25 30 35 40 45
Product innovation Process innovation
%
Industry Services
% Product
innovation
Process innovation
Ongoing/ abandoned innovation
Any innovation Industry
Small 34.7 33.5 2.8 51.4
Medium 52.1 44.0 4.5 67.3
Large 67.9 70.9 0.0 84.2
Total Industry 40.4 37.8 3.0 56.7
Services
Small 25.8 23.1 2.0 38.1
Medium 43.0 37.2 1.1 57.5
Large 56.2 46.2 0.0 63.1
Total Services 28.9 25.6 1.8 41.3
Table 2 Innovation types by sector and size, 2004 - 2006
% Small Medium Large
(10-49) (50-249) (250+)
Product innovation 29.0 47.7 62.4 33.3
Process innovation 26.7 40.7 60.0 30.3
Ongoing/Abandoned innovation 2.3 2.8 0.0 2.3
Any innovation 42.7 62.5 74.9 47.2
Table 1 Innovation types by size of enterprise, 2004 - 2006
All enterprises
[image:2.595.45.227.90.298.2]Source: CSO/Forfás - Community Innovation Survey 2004 - 2006 Fig 1 Innovation types by size of
enterprise, 2004-2006
0 10 20 30 40 50 60 70
Small Medium Large All enterprises
%
[image:2.595.240.556.297.382.2] [image:2.595.241.559.577.757.2]% Turnover:
New to firm
Turnover: New to market
Turnover:
Unchanged Total Industry
Small 2.2 2.1 95.7 100.0
Medium 4.8 10.2 85.0 100.0
Large 6.0 11.2 82.9 100.0
Total Industry 5.4 10.1 84.5 100.0
Services
Small 3.2 3.0 93.8 100.0
Medium 5.7 3.6 90.8 100.0
Large 7.4 6.2 86.4 100.0
Total Services 5.5 4.3 90.2 100.0
All enterprises 5.4 7.2 87.4 100.0
Table 4 Percentage of total turnover attributed to product innovation activities1by sector and size, 2006
Source: CSO/Forfás - Community Innovation Survey 2004 - 2006
Note:1Product innovation activities during the period 2004-2006
% Small Medium Large
(10-49) (50-249) (250+)
Turnover: New to firm 3.0 5.3 6.5 5.4
Turnover: New to market 2.8 6.1 9.5 7.2
Turnover: Unchanged 94.2 88.5 84.0 87.4
Total 100.0 100.0 100.0 100.0
Table 3 Percentage of total turnover attributed to product innovation activities1by size of enterprise, 2006
Note:1Product innovation activities during the period 2004-2006
All enterprises
Source: CSO/Forfás - Community Innovation Survey 2004 - 2006
Innovation Turnover
The survey measured how much of total turnover was attributed to product innovations, separated into new to market innovations (a measure of novelty and creativity) and new to the firm innovations (those which were adopted by the firm but invented and created elsewhere).
Almost 13% of turnover of all active and non-active innovators in 2006 in the industrial and service sectors was as a result of product innovations in the 2004 to 2006 period. Over 5% of this turnover was from new to firm products and over 7% was from new to market products. Large enterprises attributed 16% of their turnover to product innovations with almost 10% being from new to market products. Medium sized enterprises attributed 6% of their total turnover to new to market products compared to 5% for new to firm products.See Table 3 and Figure 3.
[image:3.595.46.210.74.284.2]The percentage of turnover generated by new to the firm product innovations was 5% for both the industrial and services sectors. Enterprises in industry however, generated more than twice as much of their turnover from new to market product innovations when compared to enterprises in the services sector. New to market product innovations contributed over 10% of the turnover in industry while new to market product innovations contributed in excess of 4% of turnover in services.See Table 4 and Figure 4.
Fig 3 Percentage of total turnover attributed to product innovation
activities1, 2006
5.4 7.2
87.4
New to firm New to market Unchanged
Note:1Product innovation activities during the period 2004-2006
Fig 4 Percentage of total turnover attributed to product innovation
activities1by sector, 2006
0 2 4 6 8 10 12
Turnover: New to firm Turnover: New to market
Note:1Product innovation activities during the period 2004-2006
%
[image:3.595.242.558.274.360.2] [image:3.595.239.558.530.701.2]Innovation Expenditure
Enterprises were asked if they were active in any of the following categories and to estimate innovation spending on each of those categories in 2006: in-house R&D (intramural R&D); acquisition of R&D (extramural R&D); acquisition of machinery, equipment and software; acquisition of other external knowledge. More detailed information regarding expenditure by enterprises on R&D activities is available from the Business Expenditure on Research and Development (BERD) survey1.
Total spending on innovation activities across the Irish economy is estimated to have been €4.6bn in 2006. Just under 41% of all expenditure was for acquisition of machinery, equipment and software, which totalled €1.9bn in 2006. Almost 38% of expenditure or €1.7bn was spent on intramural R&D. Acquisition of external knowledge accounted for 15% of expenditure and extramural R&D accounted for 6%. See Table 5 and Figure 5.
The total spend by industrial enterprises on innovation activities was almost €2.7bn in 2006 while the total spend in the services sector was €1.9bn. Industrial enterprises spent €1bn on machinery and equipment, €920m on intramural R&D, €550m on acquisition of external knowledge and €195m on extramural R&D. The services sector spent €860m on machinery and equipment, €805m on intramural R&D, €150m on acquisition of external knowledge and €85m on extramural R&D.See Table 6 and Figure 6.
€m
Industry Services All
enterprises
Intramural R&D 917.7 804.7 1,722.5
Extramural R&D 194.6 85.2 279.8
Machinery and equipment 999.4 857.3 1,856.7
External knowledge 549.0 150.3 699.3
Total expenditure 2,660.7 1,897.5 4,558.2
Source: CSO/Forfás - Community Innovation Survey 2004 - 2006 Table 6 Innovation expenditure by sector, 2006
€m Small Medium Large
(10-49) (50-249) (250+)
Intramural R&D 266.2 434.5 1,021.7 1,722.5
Extramural R&D 18.9 98.9 162.0 279.8
Machinery and equipment 197.4 532.5 1,126.7 1,856.7
External knowledge 22.1 264.9 412.3 699.3
Total expenditure 504.7 1,330.8 2,722.7 4,558.2
Table 5 Innovation expenditure by size of enterprise, 2006
All enterprises
Source: CSO/Forfás - Community Innovation Survey 2004 - 2006 Fig 6 Innovation expenditure by
sector, 2006
0 200 400 600 800 1,000
Intramural R&D
Extramural R&D
Machinery and equipment
External knowledge
€m
[image:4.595.43.225.67.636.2]Industry Services
Fig 5 Percentage share of innovation expenditure by type of expenditure,
2006
37.8
6.1 40.7
15.3
[image:4.595.241.558.280.375.2] [image:4.595.243.558.526.622.2]%
Industry Services All
enterprises
Within own group 13.9 13.9 13.9
Suppliers of equipment 17.8 16.6 17.2
Clients/customers 14.9 12.8 13.7
Competitors 4.2 4.6 4.4
Consultants/labs 10.9 5.7 8.1
Universities/third level 8.9 5.1 6.8
Government 7.3 2.1 4.5
Any cooperation 28.3 25.9 27.0
Table 8 Cooperation by innovative enterprises by type of cooperation partner and sector, 2004 - 2006
Source: CSO/Forfás - Community Innovation Survey 2004 - 2006
% Small Medium Large
(10-49) (50-249) (250+)
Within own group 10.0 19.7 38.9 13.9
Suppliers of equipment 13.7 24.4 32.1 17.2
Clients/customers 11.6 19.3 19.5 13.7
Competitors 4.1 5.6 4.5 4.4
Consultants/labs 5.9 13.2 16.7 8.1
Universities/third level 4.3 9.7 26.7 6.8
Government 3.0 7.5 11.8 4.5
Any cooperation 22.1 35.7 53.8 27.0
Table 7 Cooperation by innovative enterprises by type of cooperation partner and size of enterprise, 2004 - 2006
All enterprises
Source: CSO/Forfás - Community Innovation Survey 2004 - 2006
Innovation Cooperation
Enterprises were asked if they cooperated on any of their innovation activities with other enterprises or institutions. In total, 27% of all innovative enterprises indicated that they engaged in some cooperation activity when developing their innovations. More than half (54%) of all large innovation active enterprises were involved in innovation partnerships compared to 22% of small enterprises. Suppliers of equipment, materials, components or software were the most commonly cited innovation partners with over 17% of enterprises having innovation cooperation with these suppliers. Almost 14% of enterprises indicated that they cooperated with other enterprises within their own enterprise group.See Table 7 and Figure 7.
Just over 28% of innovation active industrial enterprises indicated that they were engaged in innovation cooperation compared to 26% of service sector enterprises. Cooperation partnerships with suppliers of equipment, materials, components or software were the most likely innovation partnerships in both industry (18%) and services (17%). See Table 8 and Figure 8.
Fig 8 Cooperation by innovative enterprises by type of cooperation
partner and sector, 2004-2006
0 5 10 15 20
Own group Suppliers of equipment Clients/customers
Competitors
Consultants/Labs Universities/Third
level Government
%
[image:5.595.45.228.74.323.2]Industry Services Fig 7 Cooperation by innovative enterprises by size of enterprise,
2004-2006
0 10 20 30 40 50 60
Small Medium Large All
enterprises
[image:5.595.240.558.239.371.2] [image:5.595.244.557.518.649.2]% Industry Services
Lack of funds 19.3 17.9
Lack of external finance 11.9 12.4
Innovation costs too high 17.1 15.6
Lack of qualified personnel 11.2 9.2
Lack of information on technology 3.7 3.1
Lack of information on markets 6.4 5.9
Difficulty in finding cooperation partners 5.6 6.6
Market dominated by established enterprises 16.4 13.6
Uncertain demand 13.7 14.5
Table 10 Highly important hampering factors to innovation activities for innovative enterprises by sector, 2004 - 2006
Source: CSO/Forfás - Community Innovation Survey 2004 - 2006
Barriers to Innovation
A number of factors which might have curtailed innovation activities were listed in the survey and enterprises were asked to rank each of the factors as being of high, medium, low or no importance. Results are shown for hampering factors that enterprises indicated as being of high importance.
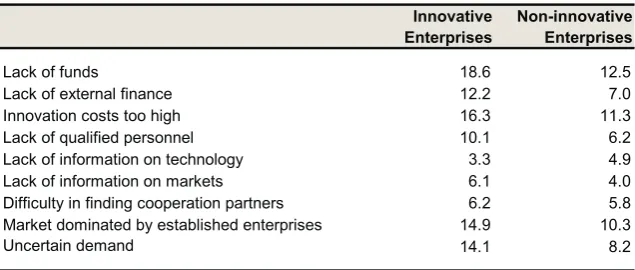
Those enterprises that were both innovative and non-innovative indicated that the three largest hampering factors were lack of funds, high costs and markets dominated by established enterprises. Almost 19% of innovative enterprises indicated that lack of funds was a highly important factor hampering innovation compared to 13% of non-innovative enterprises. In excess of 16% of innovation active firms cited high costs as a high hampering factor while 11% of non-innovative enterprises indicated that high costs were a hampering factor.
See Table 9 and Figure 9.
The largest hampering factor for innovative enterprises in industry was a lack of funds with almost a fifth of industrial enterprises citing this as a high hampering factor. Service enterprises also cited lack of funds as their largest hampering factor with just under 18% of service enterprises being hampered by this factor.
See Table 10 and Figure 10.
Fig 10 Highly important hampering factors of innovative enterprises by
sector, 2004-2006
0 5 10 15 20
Lack of funds Lack of external finance Innovation costs too high Lack of qualified personnel Lack of information on
technology Lack of information on
markets Difficulty in finding cooperation partners Market dominated by established enterprises Uncertain demand
%
[image:6.595.42.221.87.325.2]Industry Services Fig 9 Highly important hampering
factors of innovative and non-innovative enterprises, 2004-2006
0 5 10 15 20
Lack of funds Lack of external finance Innovation costs too high Lack of qualified personnel Lack of information on
technology Lack of information on
markets Difficulty in finding cooperation partners Market dominated by established enterprises Uncertain demand
%
Innovative Non-innovative
% Innovative
Enterprises
Non-innovative Enterprises
Lack of funds 18.6 12.5
Lack of external finance 12.2 7.0
Innovation costs too high 16.3 11.3
Lack of qualified personnel 10.1 6.2
Lack of information on technology 3.3 4.9
Lack of information on markets 6.1 4.0
Difficulty in finding cooperation partners 6.2 5.8
Market dominated by established enterprises 14.9 10.3
Uncertain demand 14.1 8.2
Table 9 Highly important hampering factors to innovative activities, 2004 - 2006
[image:6.595.240.558.276.411.2] [image:6.595.229.557.562.688.2]% Industry Services All enterprises
New business practices 39.3 37.5 38.2
New knowledge management systems 25.6 27.1 26.5
New methods of workplace organisation 31.1 31.4 31.3
New methods of organising external relations 16.1 16.7 16.5
Any organisational innovation 42.7 41.0 41.6
Table 12 Organisational innovation by type of innovation and sector, 2004 - 2006
Source: CSO/Forfás - Community Innovation Survey 2004 - 2006
% Small Medium Large
(10-49) (50-249) (250+)
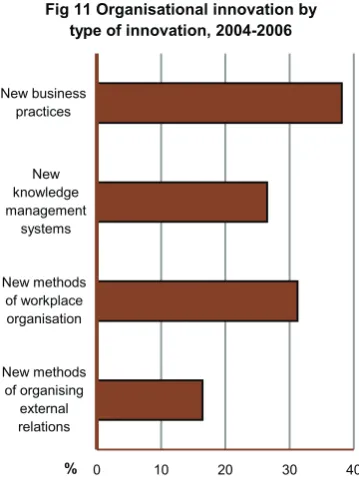
New business practices 35.8 44.8 58.0 38.2
New knowledge management
systems 24.3 33.0 44.7 26.5
New methods of workplace
organisation 29.3 36.1 51.5 31.3
New methods of organising external
relations 15.4 17.9 32.5 16.5
Any organisational innovation 38.9 50.0 61.0 41.6
Table 11 Organisational innovation by type of innovation and size of enterprise, 2004 - 2006
All enterprises
Source: CSO/Forfás - Community Innovation Survey 2004 - 2006
Organisational Innovation
A pilot module was included in the CIS 2004-2006 which included some new questions on organisational innovation. Almost 42% of all enterprises carried out an organisational innovation between 2004 and 2006. The most common form of organisational innovation was the introduction of new business practises and 38% of all enterprises indicated that they engaged in this activity.
An organisational innovation was introduced by 61% of large enterprises between 2004 and 2006. Half of all medium sized enterprises introduced an organisational innovation in the period compared to 39% of small enterprises.
See Table 11 and Figure 11.
[image:7.595.43.223.74.326.2]Industrial enterprises were slightly more likely to have engaged in an organisational innovation when compared to service enterprises. Just under 43% of enterprises in the industrial sector introduced an organisational innovation while 41% of service enterprises introduced an organisational innovation in the period. Enterprises in both industry and services generally had very similar rates of introducing the various categories of organisational innovations.See Table 12 and Figure 12.
Fig 12 Organisational innovation by type of innovation and sector,
2004-2006
0 10 20 30 40
New business practices
New knowledge management
systems
New methods of workplace organisation
New methods of organising
external relations
%
Industry Services Fig 11 Organisational innovation by
type of innovation, 2004-2006
0 10 20 30 40
New business practices
New knowledge management
systems
New methods of workplace organisation
New methods of organising
external relations
[image:7.595.239.557.238.368.2] [image:7.595.42.222.400.696.2] [image:7.595.243.561.518.614.2]Central Statistics Office Community Innovation Survey
Background Notes
Introduction The Community Innovation Survey (CIS) 2006 is a survey of innovation activities of enterprises in Ireland and other EU Member States. The CIS is carried out under Commission Regulation (EC) No 1450/2004 implementing Decision No 1608/2003/EC. The survey collects information about product and process innovation as well as organisational innovation along with other key variables during the three year period 2004 to 2006 inclusive. Most questions cover new or significantly improved goods or services or the implementation of new or significantly improved processes, logistics or distribution methods.
The CIS was previously conducted by Forfás but is now jointly conducted by the CSO and Forfás to increase efficiency in the collection of statistical data and to reduce the burden on the participating enterprises. Data were collected in accordance with Section 33 of the Statistics Act, 1993 and with EU law and the survey was carried out under the agreed set of international rules as laid out in the OECD Oslo manual. Data are strictly confidential and will be used only for statistical purposes.
Methodological changes have been introduced in the CIS 2004-2006. As a consequence ofthis, no conclusions should be drawn regarding the direction or scale of any real changes between CIS 2002-2004 (CIS4) and CIS 2004-2006.
Survey The CIS survey sampled enterprises with ten or more persons engaged in the selected NACE categories as included in the table below. The CSO and Forfás jointly conducted a postal survey in October 2007. A total of 4,150 survey forms were issued to the sampled enterprises from the CSO’s Business Register. The sample returns were then grossed using this Register population to produce overall results.
Questionnaire The CIS questionnaire is available from the CSO website. Go to www.cso.ie and then go to Business Sectors: Science and Technology.
Definitions Product Innovation: The introduction of a new good or service or a significantly improved good or service with respect to its capabilities. The product innovation could either be new to the market or new to the firm.
Process Innovation: The introduction of a new or significantly improved production process, distribution method, or support activity for goods and services. The process innovation could either be new to the market or new to the firm.
New to Market Innovation: An innovation activity, which saw the introduction of a new good or service by the firm onto its operating market before other competitors.
New to Firm Innovation: An innovation activity which saw the introduction of a significantly improved good or service to the firm, that was already available from competitors in the operating sector.
Innovation Expenditure: Spending on activities to support and implement production or process innovations.
Nace Rev. 1
Sections and Divisions Description
C (10-14) Mining and quarrying D (15-37) Manufacturing
E (40-41) Electricity, gas and water supply 51 Wholesale trade
I (60-64) Transport, storage and communications J (65-67) Financial intermediation