Energy Procedia 70 ( 2015 ) 103 – 110
ScienceDirect
1876-6102 © 2015 The Authors. Published by Elsevier Ltd. This is an open access article under the CC BY-NC-ND license (http://creativecommons.org/licenses/by-nc-nd/4.0/).
Peer-review by the scientific conference committee of SHC 2014 under responsibility of PSE AG doi: 10.1016/j.egypro.2015.02.104
International Conference on Solar Heating and Cooling for Buildings and Industry, SHC 2014
A Case for façade located solar thermal collectors
Richard O’Hegarty
*, Oliver Kinnane, Sarah McCormack
*Dept of Civil, Structural and Environmental Engineering, Trinity College Dublin, Ireland
Abstract
This paper explores the potential for façade located solar thermal collectors. Building typologies with limited roof space area are highlighted. A relationship exists between hot water consumption and the solar collector area; hence, a literature review of the hot water consumption of different building typologies is conducted. The review showed that there is a paucity of information on the hot water consumption of buildings, primarily attributed to the difficulty in quantifying it. The hot water consumption is typically described using liters per capita per day (Lcd) units, with a broad range of values existing, dependent, primarily on the building’s function and location. A simulation-based study is conducted to size solar thermal systems for different buildings and their associated hot water loads. High solar fractions, for buildings with high levels of hot water consumption, could only be achieved by using significantly larger collector surface areas. As a result, façade located solar thermal collectors are required for certain high-rise buildings that aim to provide for their hot water needs using a considerable portion of solar energy.
© 2015 The Authors. Published by Elsevier Ltd.
Peer-review by the scientific conference committee of SHC 2014 under responsibility of PSE AG. Keywords: Domestic hot water, Solar thermal, Solar fraction, Façade
1.Background
It is estimated that buildings account for over one third of the world’s final energy consumption [1]. More than half of this portion is associated to thermal conditioning (i.e. heating, cooling and ventilation). Hence, new renewable energy technologies need to be considered in order to meet this proportion with sustainable energy sources. Additionally, new methods of implementing, the currently existing technologies, are required. Solar heating for domestic hot water (DHW) has proven to be one of the most promising renewable energy technologies. Solar
* Corresponding author. Tel.: +353-87-750-2926. E-mail address: ohegartr@tcd.ie.
© 2015 The Authors. Published by Elsevier Ltd. This is an open access article under the CC BY-NC-ND license (http://creativecommons.org/licenses/by-nc-nd/4.0/).
thermal systems are typically installed on the roofs of residential dwellings in the form of evacuated tubes or flat plate collectors. This paper looks at the potential for locating similar systems onto the façade of buildings. A case is made for façade integration by investigating a range of building typologies, in terms of geometry and functionality. A strong relationship exists between the solar collector area and the hot water consumption of that building. Hence, a building with a high DHW demand and limited roof area becomes suitable for façade integration. A simulation study is conducted in order to identify these building types; building upon a literature review of the hot water consumption of different buildings.
1.1.Hot water consumption
In order to design a solar thermal system that provides energy for the DHW load of a building, it is paramount to have information on the hot water consumption of the building. However, there are a large number of variables that dictate the hot water (HW) consumption of different buildings in a given location. These variables include the building’s function and occupancy pattern, as well as, the behavior of occupants themselves. As a result, it is difficult to accurately quantify the hot water consumption of buildings. Obtaining information on the hot water consumption of buildings will allow for a more accurate and hence more economic sizing of a solar thermal system. According to The National Standards Authority of Ireland [2], the HW consumption of a residential dwellings is equal to 28 liters plus 26 liters times the number of occupants, i.e. a linear function of the number of occupants [2]. Studies in other countries have quantified the hot water consumption of residential buildings [3]–[8]. Each study assesses the HW consumption as a function of different parameters, however, it is the study of Lutz et al. [3], that models the HW consumption with the most variables. Their paper is based on the hot water consumption of American residential buildings in the 80’s.
[image:2.544.75.470.389.497.2]While there is a paucity of information on the hot water consumption of residential buildings, there is an even greater deficiency of information when it comes to the HW consumption of non-residential buildings. A literature review has been conducted, identifying the studies that examine the hot water consumption of different buildings. A summary of the studies (including UK and Irish standards) that described the hot water consumption on a liter per occupant per day basis is presented in Table 1.
Table 1. Hot water consumption in Litres per capita per day (Lcd) Country Year Reference Canada 2013 [4] Ireland 2012 [2] UK 2012 [9] U.S. 2011 [10] Poland 2010 [11] U.K. 2008 [7] SA 2006 [12] UK 2005 [8] SA 1998 [5], [6] Building type
House/Apartment 65 28+26N1 36+25N1 60 40+28N1 49 56-66
Hotel 76 65-110
Hospital 197 111-124
Office 4
N1 refers to the number of occupants. A number of studies describe the HW consumption as a function of N, rather than in Lcd.
2.Methodology
2.1.Introduction
To evaluate the requirement for facade integrated solar thermal collectors the following methodology is outlined. Buildings vary considerably in terms of both function and geometry; therefore, it is unrealistic to evaluate the potential for solar thermal energy for each individual building. Instead, a general case will be made for four different building functions; namely, “an apartment block”, “a hotel”, “a hospital” and “an office block”; beginning with a case study of a 17-storey building located in Dublin, Ireland (Fig. 1). The building’s geometry will be defined and then the potential requirement for facade integrated solar thermal systems will be compared for different building typologies and for different solar fractions. The solar fraction, in this case, is the amount of heat supplied by solar energy, divided by the total amount of heat energy used to provide hot water over a one-year period. The hot water consumption per occupant will be taken from the sources in Table 1, which have been provided as a result of a literature review. Occupants per floor areas will be taken from guidelines outlined in standards [13], [14]. Once an estimate of the building’s HW consumption is established, in addition to the climatic conditions and building orientation, a collector area will be calculated using simulation software.
2.2.Case study building
[image:3.544.66.485.332.477.2]The case study building, “Liberty Hall”, located in Dublin, Ireland is modelled as “an apartment block”, “a hotel”, “a hospital” and “an office block” (Fig. 1). While this building is considered as a high-rise building in Dublin it would be considered as a typical mid-rise building in many major cities around the globe making it suitable for this study. Furthermore, this building is currently up for refurbishment.
Fig. 1. Plan and elevation of Liberty Hall, Dublin, Ireland. Adapted from Google maps [15].
The collector area and storage volume required for the estimated HW consumption will first be estimated using simple rules of thumb [16] for different solar fractions. A higher solar fraction will result in more energy saved but a greater capital cost and collector area. It is up to the designers to decide what fraction of the hot water demand is to be supplied by the solar thermal collectors i.e. what the solar fraction is. Using these results, a system will be modelled using simulation software (Polysun). The output of the simulation is the solar fraction. In the case of large scale systems, solar fractions of 0.25 and 0.5 are typically considered and will be used in this study [16]. Therefore, a collector area and storage volume will be given for the example building functioning as “an apartment block”, “a hotel”, “a hospital” and “an office block” for both a 0.25 and 0.5 solar fraction, hence, there will be 8 resulting sizes, each with an upper and lower limit.
Furthermore, it should be pointed out that it is unlikely that the entire roof area may be available, thus, these results illustrate a worst case scenario for making the case of façade integrated collectors based on a shortage of roof space.
In order to get an idea of the effect the geometry has on the need for façade located solar collectors, a building with the same floor area and more roof space will also be considered. Conclusions will be made based on the results obtained in the next section. The floor area of the building is approximately 5,200 m2. The CIBSE Guide A
acknowledges that the occupant densities of a building may range from 4 to 24 m2 per person [13]. For this reason,
each building is defined separately and assumptions are outlined.
2.3.Building function
2.3.1.Apartment
If this building were to function as a block of flats or apartments the population of the building must first be estimated. A minimum of 90m2 is recommended for a three bedroom apartment [17]. Given the dimensions of the
case study building, three three-bedroom apartments could be planned for each floor, giving a total of 51 apartments and a full population of 153 people, assuming there is one person per bedroom. Using Irish and UK standards [3 and 10], HW consumptions of 106 and 111 Lcd are estimated per three-room apartment from the respective references. Using U.S. guidelines [10] and results from a Canadian journal paper [4], the HW consumption for each apartment was found to be 180 and 195 Lcd respectively. Using these figures as lower and upper limits respectively, a building of this size would consume between 5,400 and 10,000 Liters of HW per day. These figures will be used in the results section of this report.
2.3.2.Hotel
For this high-rise building to function as a hotel, an estimation of the number of rooms for the given floor area must be made. The total floor area of this building would not be covered entirely by bedrooms. A hotel design, planning and development guide [18] suggests that there should be sufficient space to provide for other areas such as meeting rooms and reception area. Furthermore, another planning guide for hotels [19] suggests that 90% of economy or budget hotels floor space is allocated for rooms; for business class hotels this is estimated to be approximately 70%. This study represents an average hotel; hence, it is assumed that 80% of the floor area is used for bedrooms. A further assumption is required in order to estimate the number of occupants; an occupancy density value of 0.05 people/m2 is taken [20]. This results in a population of 208 for this hotel. From the literature (Table 1)
it was concluded that the HW consumption ranges from 76-110 Lcd. This results in the HW consumption ranging from 15,808 to 22,880 Liters per day. Again, as with the apartment these figures, based on the outlined assumptions, will be used in the results section. A study of a case study of a high-rise hotel building in Brazil, showed that façade located collectors provided a good solution for this type of building [21].
2.3.3.Hospital
Hospital buildings vary considerably from one to the other in terms of their function, and hence, in their hot water consumption. This paper aims to obtain a general idea of the hot water consumption of a hospital building. As a result, an assumption is made that 40% of the floor area is allocated to bedrooms. An occupancy density of 0.105 per/m2 is taken [20].The literature review found that the consumption of hot water ranges from 111 – 197 Lcd [10],
[11]. Hospitals are big consumers of hot water and could be an ideal location for solar collectors. In this case the range in HW consumption is between 24,198 and 42,946 Liters per day.
2.3.4.Office
Out of the four building functionalities considered, offices consume the least amount of HW per m2 of floor area
since showers and baths are either minimal or non-existent in this type of building. An assumption that 95% of the floor area of the building is allocated to offices is made, leaving the remaining area for corridors and reception areas. An occupancy density of 0.095 per/m2 is used [20]. There is a paucity of information on the HW consumption of
3.Results
The building modelled is a 17-storey building with a roof area of 300m2, located in Dublin. The system is sized
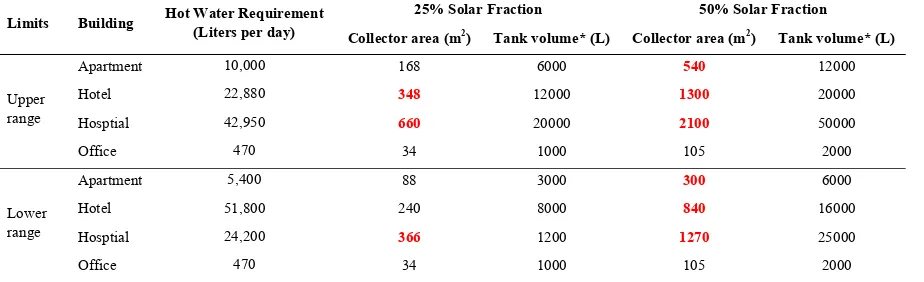
[image:5.544.48.510.225.366.2]for a standard, good quality, solar collector located at an inclination angle of 45° to the roofs horizontal surface and facing south. The system modelled, using polysun, is a system that uses a thermal buffer store and external heat exchangers, this is typical of a large scale system [16]. Each system consists of a solar collector, two storage tanks, a backup oil boiler, heat exchangers and a hydraulic network of pipes. The results may represent a number of systems, that sum up to the same volume and area displayed in Table 2, rather than one large system; this makes practicle sense, since, the storage tanks would be too large otherwise. The required collector area and associated storage volume, to achieve the outlined solar fractions, for the given building typologies, are illustrated in Table 2. The scenarios that surpass the given roof space of 300m2 are highlighted in a red bold font.
Table 2. Required collector area and tank volume for four different buildings with the same geometry (roof area = 300m2; roof/façade ratio = 0.1; roof/living space ratio = 0.06)
Limits Building Hot Water Requirement (Liters per day)
25% Solar Fraction 50% Solar Fraction
Collector area (m2) Tank volume* (L) Collector area (m2) Tank volume* (L)
Upper range
Apartment 10,000 168 6000 540 12000
Hotel 22,880 348 12000 1300 20000
Hosptial 42,950 660 20000 2100 50000
Office 470 34 1000 105 2000
Lower range
Apartment 5,400 88 3000 300 6000
Hotel 51,800 240 8000 840 16000
Hosptial 24,200 366 1200 1270 25000
Office 470 34 1000 105 2000
*Tank volume is the sum of a number of tanks, not, the size of one single tank.
3.1.Investigation of the effect of the building’s geometry
This building has a specific geometry; therefore, two additional geometries, with the same floor area of 5200m2,
hence, the same assumed hot water consumption, are assessed in the same manner. Fig 2 illustrates the three geometries, while Table 3 and Table 4 highlight the scenarios that surpass the given roof spaces of 520m2 and
Fig 2. Three buildings with a floor area of 5200 m2 and different geometries, as labelled.
Table 3. Required collector area and tank volume for four different buildings with the same geometry (roof area = 520m2; roof/façade ratio = 0.2; roof/living space ratio = 0.1)
Limits Building Hot Water Requirement (Liters per day) 25% Solar Fraction 50% Solar Fraction
Collector area (m2) Tank volume* (L) Collector area (m2) Tank volume* (L)
Upper range
Apartment 10,000 168 6000 540 12000
Hotel 22,880 348 12000 1300 20000
Hosptial 42,950 660 20000 2100 50000
Office 470 34 1000 105 2000
Lower range
Apartment 5,400 88 3000 300 6000
Hotel 51,800 240 8000 840 16000
Hosptial 24,200 366 1200 1270 25000
Office 470 34 1000 105 2000
*Tank volume is the sum of a number of tanks, not, the size of one single tank.
Table 4. Required collector area and tank volume for four different buildings with the same geometry (roof area = 866m2; roof/façade ratio = 0.4; roof/living space ratio = 0.17)
Limits Building Hot Water Requirement (Liters per day) 25% Solar Fraction 50% Solar Fraction
Collector area (m2) Tank volume* (L) Collector area (m2) Tank volume* (L)
Upper range
Apartment 10,000 168 6000 540 12000
Hotel 22,880 348 12000 1300 20000
Hosptial 42,950 660 20000 2100 50000
Office 470 34 1000 105 2000
Lower range
Apartment 5,400 88 3000 300 6000
Hotel 51,800 240 8000 840 16000
Hosptial 24,200 366 1200 1270 25000
Office 470 34 1000 105 2000
[image:6.544.42.505.489.631.2]As expected, increasing the roof to façade area ratio and hence roof to living space ratio reduces the necessity for façade located solar collectors. Therefore, a stronger case, for solar collectors to be installed on the façade of buildings, can be made for high-rise buildings.
4. Conclusion
A review of the literature associated with the hot water consumption of buildings showed that there is a paucity of information on the hot water consumption of buildings, in particular, non-residential buildings. As a result, ranges were taken for the HW consumption of the different buildings, giving upper and lower limits. First a case study building was taken as an example, which had a roof area of 300m2 and a roof to façade area ratio of 0.1. The analysis
found that the buildings with the greater hot water consumptions, i.e. the hospital and hotel would require façade integrated solar collectors if they were to achieve a solar fraction of above 25%. Additionally, it was found that achieving high solar fractions in the range of 50% for a building of this geometry would be difficult, in particular, for the hospital and hotel typologies. A further analysis showed that for the same floor area, hence, the same hot water consumptions, residential and commercial buildings with greater roof to façade area ratios might not necessarily need façade located collectors to achieve a solar fraction of 25%. However the large consumers i.e. the hospital and the hotel typologies would require façade located collectors to achieve the higher 50% solar fraction. Ultimately the results show there is a case for façade located solar thermal collectors as a result of limited roof space, especially for high rise buildings with high hot water consumptions.
The case is made in this paper for façade integrated/located solar thermal collectors by highlighting a deficiency in roof space. This study was conducted for a northern European climate; further research could look at other locations and other building types. While there are greater levels of solar radiation in warmer climates, there is also greater competition for the valuable roof space with the likes of roof gardens, swimming pools, restaurants as well as other renewable energy technologies such as photovoltaic panels; again making a case for façade integration. There are a number of other reasons why building integrated solar thermal (BIST) collectors have an advantage over the typical roof installed collectors. BIST collectors also offer market flexibility, potential architectural advantages, multifunctional potential, a reduction in the heat loss through pipes due to the reduction in the distance the hot water must travel and a reduction in potential stagnation (overheating) if the collectors are installed at 90 degrees. For these reasons as well as the limited roof space shown in this paper, a case can be made for façade integrated solar thermal collectors.
References
[1] IEA, ‘Transition to Sustainable Buildings - Strategies and Opportunities to 2050’, 2013.
[2] NSAI S.R. 50-2, ‘Building services Code of practice Part 2: Thermal solar systems’, in National Standards Authority of Ireland, 2012. [3] J. D. Lutz, X. Liu, J. E. McMahon, C. Dunham, L. J. Shown, and Q. T. McCure, ‘Modeling patterns of hot water use in households’,
Lawrence Berkeley Natl. Lab., Jan. 1996.
[4] J. C. Evarts and L. G. Swan, ‘Domestic hot water consumption estimates for solar thermal system sizing’, Energy Build., vol. 58, pp. 58–65, Mar. 2013.
[5] J. P. Meyer and M. Tshimankinda, ‘Domestic hot-water consumption in South African apartments’, Energy, vol. 23, no. 1, pp. 61–66, Jan. 1998.
[6] J. P. Meyer and M. Tshimankinda, ‘Domestic hot water consumption in south african townhouses’, Energy Convers. Manag., vol. 39, no. 7, pp. 679–684, May 1998.
[7] Energy Saving Trust, ‘Measurement of Domestic Hot Water Consumption in Dwellings’, 2008.
[8] BRE Housing centre, ‘Estimates of hot water consumption from the 1998 EFUS. Implications for the modelling of fuel poverty in England.’, DTI and DEFRA, 2005.
[9] SAP, The government’s standard assessment procedure for energy rating of dwellings. BRE, 2012.
[10] NREL, ‘Domestic Hot Water Assessment Guidelines (Fact Sheet), Saving Energy In Commercial Buildings, NREL (National Renewable Energy Laboratory)’, 2011. [Online]. Available: http://www.nrel.gov/docs/fy11osti/50118.pdf. [Accessed: 03-Feb-2014].
[11] J. Bujak, ‘Heat consumption for preparing domestic hot water in hospitals’, Energy Build., vol. 42, no. 7, pp. 1047–1055, Jul. 2010. [12] R. Rankin and P. G. Rousseau, ‘Sanitary hot water consumption patterns in commercial and industrial sectors in South Africa: Impact on
heating system design’, Energy Convers. Manag., vol. 47, no. 6, pp. 687–701, Apr. 2006.
[14] NREL, ‘U.S. Department of Energy, Commercial Reference Building Models of the National Building Stock’, National Renewable Energy Laborator y, NREL/TP - 5500 - 46861, 2011.
[15] ‘Google Maps’, 2014. [Online]. Available: https://maps.google.com/ . [Accessed: 06-May-2014].
[16] DGS, Planning & Installing Solar Thermal Systems, Aguide for installers, architects and engineers, German Solar Energy Society, 2nd ed. Earthscan, 2010.
[17] Environ, Department of the Environment, Heritage and Local Government. Sustainable Urban Housing: Design Standards for New Apartments, Guidelines for planning authorities. Department of the Environment, Heritage and Local Government, 2007.
[18] R. H. Penner, L. Adams, and S. K. A. Robson, Hotel Design, Planning and Development, Second. USA and Canada: Routledge, 2013. [19] J. deRoos, ‘Planning and Programming a Hotel’, Cornell University, 01-Jan-2011. [Online]. Available:
http://scholarship.sha.cornell.edu/articles/310.
[20] NCM, ‘National Calculation method, NCM Database for iSBEM_v4.1.e’, 2007. [Online]. Available: http://www.ncm.bre.co.uk/download.jsp. [Accessed: 09-May-2014].
[21] A. Colmenar-Santos, J. Vale-Vale, D. Borge-Diez, and R. Requena-Pérez, ‘Solar thermal systems for high rise buildings with high consumption demand: Case study for a 5 star hotel in Sao Paulo, Brazil’, Energy Build., vol. 69, pp. 481–489, Feb. 2014. [22] POLYSUN, ‘POLYSUN, simulation software for solar thermal systems’, 2014. [Online]. Available:

![Fig. 1. Plan and elevation of Liberty Hall, Dublin, Ireland. Adapted from Google maps [15]](https://thumb-us.123doks.com/thumbv2/123dok_us/941426.607122/3.544.66.485.332.477/plan-elevation-liberty-hall-dublin-ireland-adapted-google.webp)