Segmentation of Lettuce Plants Using Super Pixels
and Thresholding Methods in Smart Farm
Hydroponics Setup
Pocholo James M. Loresco, Ryan Rhay P.Vicerra, and Elmer P. Dadios
Abstract— Segmentation is one of the significant requirements
of efficient computer vision applied in plant growth monitoring. Existing segmentation techniques has their own merits, however should be selected for a specific situation with respect to varying plant environment. Consideration of segmentation in the context of lettuce in hydroponics environment remain an open research. In this paper, a lettuce plant segmentation by using thresholding and super pixels is proposed, which can classify lettuce plant and background from images taken at a smart farm hydroponics setup. Lab color information of the image extracted from a training image dataset undergo two-level thresholding and K-means clustering thru superpixels to identify each pixel class. Experimental testing results demonstrate an improved performance in segmentation in terms sensitivity, precision, and F1-score.
Index Terms— k-means clustering, lettuce segmentation,
superpixels, simple linear iterative clustering algorithm, thresholding
I. INTRODUCTION
MAGE segmentation is one of the most essential process in computer vision applied in plant growth monitoring [1]. The accuracy of identification of the plant growth depends on the efficiency of the isolation of plant to the background environment [2]. Several computer vision algorithms for plant growth monitoring were emphasized on the works about plant parts segmentation [3],[4], disease detection [5], feature extraction [6],[7] which remain challenging for plant imaging area.
Many supervised, unsupervised and semi-supervised methods from different perspectives have been proposed to address the image segmentation task [8]-[10]. However, each segmentation has its own merits and should be selected for a specific situation with respect to varying plant environment to address computer vision problems such as camera resolution, illumination changes [11], and scale invariance [12].
Manuscript received March 04, 2019; revised April 06, 2019. This work was supported in part by the Philippine Council for Industry, Energy and Emerging Technology Research and Development (DOST-PCIEERD) and Commission on Higher Education (CHED).
P.J. M. Loresco is a Ph.D. student from the Electronics & Electrical Engineering Dept., De La Salle University, Manila, Philippines. He is faculty member of Electrical and Electronics Engineering Department of Far Eastern University Institute of Technology (e-mail: [email protected], [email protected]).
Dr. R.R.P. Vicerra is with the Manufacturing Engineering and Management Department, De La Salle University, Manila, Philippines (e-mail: [email protected])
Dr. E.P. Dadios is with the Manufacturing Engineering and Management Department, De La Salle University, Manila, Philippines (e-mail: [email protected])
Although the vision-based lettuce growth monitoring has encountered several developments in recent years, some problems remain an open research area. Current studies have not satisfactorily resolved the challenges and requires improvement and extensive testing for functionality and robustness when applied in controlled greenhouse environment or smart farms. Manual segmentation was done in [13],[14] planted in open field. Most of the segmentation is scenario-dependent [15],[16], and limited studies have considered segmentation of lettuce in hydroponics setup.
Superpixels technique has experienced significant developments in its use in computer vision applications. Superpixels approach have been used in preprocessing [17], segmentation [18], and classification [19] with each approach has its own advantages. This study proposes a segmentation of lettuce plant which uses combination machine vision using K-means clustering thru super pixels and thresholding methods. Simple linear iterative clustering algorithm (SLIC) is used to create the superpixels.
This paper consists of five sections organized as follows. The first chapter presents some recent examples of segmentation. The second chapter discusses the background environment where the lettuce crops are planted and its inherent computer vision problems. Chapter 3 introduces K-means clustering and superpixels. Chapter 4 discusses the proposed methodology about plant segmentation using super pixels and thresholding. Experimental results and analysis are discussed on Chapter 5 followed by the last chapter for conclusions and future directions of the proposed work.
II. HYDROPONICS SETUP
The main objective of this study is to segment the region as lettuce plant and non-lettuce plant regions in a smart farm hydroponics setup. This kind of setup belongs to controlled-environment agriculture (CEA) [20] which is a horticultural technology supported by integrated science and engineering approach. In this setup such as shown in Figure 1, lettuce plants are planted hydroponically on rockwool that floats on top of holes on pipes. Nutrient solution flows through the pipes. This system enables better control of pests, conserves space and eliminates that need for constant watering.
The smart farm hydroponics chamber is designed to produce maximum number of harvestable crops. There is temperature control and an artificial light system installed. The vision system is developed to monitor the crop growth. The
nutrients solution is maintained according to recommended thresholds measured using pH and conductivity.
Fig. 1. Hydroponics setup for the proposed study
Lettuce images are captured on top view using a monocular camera. Artificial LED lighting is used as a source of white light and no direct sunlight is allowed inside the chamber to maintain the quality of the taken images. Some inherent problems encountered in image acquisition are intensity variations, illumination variations, blurred capture and background noises. Figure 2 shows some sample captured images.
[image:2.612.47.304.364.455.2](a) (b) (c)
Fig. 2. Capture Setup for the proposed study (a) noisy background (b) blurred capture (c) greenish rock wool used for planting the lettuce similar in color with plant
III. K-MEANS &SUPER PIXELS
A. K-Means
K-means is clustering method that group similar objects into k mutually isolated clusters. K-means clustering operates on assigning objects to the cluster that has the closest centroid on each iteration. The new centroids are then recalculated from the assigned data clusters. There are different distance measures, depending on the kind of data to be clustered. An example of Euclidean distance formula is shown in (1). The process of assigning data to centers and recalculation of new centers are repeated until convergence, such that no movement of data to another cluster is still happening [21]. K-means clustering have been used in many applications such as classification analysis [22], unsupervised machine learning [23], and machine vision [24].
Where E (r, c): The Euclidean distance of a pixel with spatial coordinates (r,c) using color components Ri,Gi,Bi (RGB) in
reference to its centers Rc,Gc,Bc (RGB)
B. Super pixels
Superpixel has drawn popular use in computer vision applications. In the last few years superpixels are widely used in segmentation applications such as in [17-19]. There are several superpixels algorithms that in general has its own merit in improving computer vision applications [25]. SEEDS algorithm is used for applications for critical computing time required. Ncut algorithm are used to build a graph that generates superpixels that are more visually pleasing. SLIC algorithm are often used in pre-processing for segmentation however, in this study SLIC superpixels are used to improve segmentation technique based on thresholds.
The image is divided into multiple segments called superpixels. K-means classification algorithm classifies each pixel in the superpixel region to create image patches spatially coherent homogeneous structure that adheres well to image boundaries. Figure 3 shows an example of superpixel implementation. Superpixels carry more information as it aligns with intensity edges as compared to rectangular patch. Superpixels create consistent meaningful regions which can be utilized for succeeding image processing tasks and can be used to solve classification problems on superpixels regions instead over the full original image.
(a) (b)
Fig. 3. Supexpixels implementation of Figure 2(a), (a) superpixel boundaries overlaid on the original image, (b) superpixel results
[image:2.612.326.543.442.554.2]IV. PROPOSED METHODOLOGY
[image:3.612.55.306.158.345.2]Figure 4 depicts the image processing techniques used in this research. The lettuce images taken on the smart farm hydroponics setup were processed to extract segmented lettuce plant. Segmentation were performed based on color features using K-means clustering and superpixels. Two-level thresholding fine-tuned the segmentation.
Fig. 4. Image processing techniques used in this research
The lettuce images in RGB color space were enhanced and converted to equivalent Lab color space. The Lab color space was derived from the XYZ tristimulus values. The Lab color space comprises of luminosity ‘L’, chromaticity ‘a’ and ‘b’. ‘L’ corresponds to brightness layer while ‘a’ corresponds to chromaticity that is determined in the red-green axis, and ‘b’ corresponds to chromaticity that is determined in the blue-yellow axis. Transformation formulas to Lab from RGB is given in (2) to (7). X, Y and Z called the tristimulus values are RGB extrapolations.
(2)
(3)
(4)
(5)
(6)
(7)
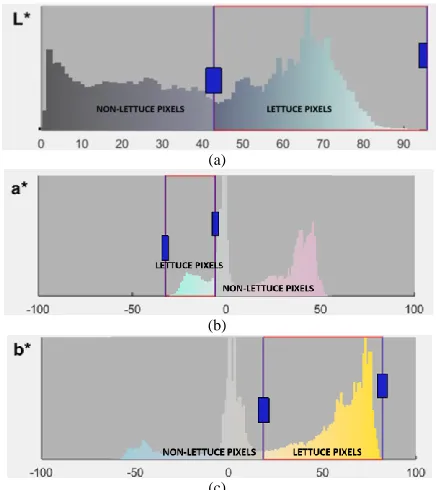
Next, images were segmented by labeling every pixel by the learned threshold of L, a and b for lettuce pixels and non-lettuce pixels. Each pixel was set that qualifies statement in (8) as lettuce pixels otherwise as non-lettuce pixels. If P was true then [L(i,j),a(i,j),b(i,j)] was classifies as a lettuce pixel else [L(i,j),a(i,j),b(i,j)] a non-lettuce pixel. Histograms in CIELab used in first level segmentation is shown in Figure 5. The output image here was still in an RGB image.
P= (a(i,j) < al) && (a(i,j) > au) && (L(i,j) >Ll)& & (Ls(i,j) < Lu) && (b(i,j) > bl) && (b(i,j) < bu)
(8)
Where a (i, j), b(i,j),L(i,j) are CIELab color space components with spatial coordinates (i,j), al ,Ll, ,bl and au , Lu bu are
CIELab learned lower thresholds and upper thresholds respectively.
The superpixels of the resulting RGB image was then calculated. Simple linear iterative clustering (SLIC) algorithm was used in this research. Simple linear iterative clustering (SLIC) clustered five dimensional vectors. Thus, for each pixel 5 vectors were noted [R, G, B, x, y] color information and spatial position.
(a)
(b)
(c)
Fig. 5. Histograms in CIELab used in first level segmentation filtering out lettuce pixels, (a) Luminance, (b) chromaticity that is determined in the red-green axis (c) chromaticity that is determined in the blue-yellow axis
The detailed Superpixel algorithm used in this research can be described as follows:
1. Initialize the superpixels centers by sampling n locations on a regular grid in image plane. The number of superpixels considered here are 50, 500, and 1000. The compactness parameter is set to a constant value. 2. For each cluster center mi with color information as
(Ri,Gi,Bi) and spatial coordinates as (xi,yi) , compute
distance between mi and each pixel with color information
(Rj,Gj,Bj) located at (xj,yj) in a neighborhood of mi using
(9) to (11). Assign pixel to cluster i if its distance is better than its current value.
(9)
(10)
(11)
[image:3.612.325.543.200.445.2]function, ds is spatial distance function, C is maximum color distance, S is maximum spatial distance
3. Update the cluster centers using K-means 4. Repeat until convergence
5. Replace colors of pixels in each cluster with the average RGB color
The resulting superpixel RGB image was converted again to Lab color space. The 2nd level thresholding using the learned L, a and b thresholds were used to label every pixel as lettuce or non-lettuce pixels. Similar equation in Equation (8) but with updated threshold was used for segmentation. This process was used to isolate lettuce regions and create the binary mask.
To test the performance of the system in terms of segmentation, vision metrics and computational efficiency were evaluated in terms of sensitivity, precision, F1 score and computing time. Equations (12) to (14) are statistical evaluation criteria of the performance of the image segmentation. In the context of lettuce plant segmentation, sensitivity is the fraction of correct results which are positive (lettuce pixels). On the other hand, precision is the positive predictive value or the fraction of positive lettuce pixel classification results which are correct. The F1 score or simply F score is the harmonic mean of precision and recall (sensitivity). To determine these evaluations, ground truth (GT) images were identified by inspection and manually drawing the border around the lettuce plants and counting the number of correct lettuce pixels thru a program.
(12)
(13)
(14)
V. DISCUSSION OF RESULTS
This section presents the results of the proposed segmentation method for lettuce. The methodology was evaluated on a set of 20 images of lettuce images obtained from Smart farm hydroponics setup. The ground truth images were found via human-based segmentation and counting thru a program the number of lettuce and non-lettuce pixels.
Figure 6 shows sample results of segmentation obtained using the proposed algorithm. Original lettuce image is shown in Figure 6(a). The RGB color image was then converted to its corresponding CIELab color space. Figure 6(b) to 6(d) shows the CIELab components of lettuce superpixels which were used to compare to learned thresholds shown in Figure 6(a) to6(c). Lettuce plant pixels were classified accordingly to their corresponding thresholds which is shown in Figure 6(e). It can be noticed at the leftmost leaf, the presence of some lettuce pixels converted to black pixels due to illumination. Boundaries for the regions was computed using 500 superpixels shown in Figure 6(f). Result of segmentation using SLIC is shown in Figure 6(g). It is worth noting in this
clustering, the edge information of the original images was carefully preserved. With this, the leaf color information which was too dark and too light were clustered effectively to their corresponding superpixel region bounded by the edges of the leaves. Finally, region of interest of segmented lettuce can be seen in Figure 6(h). Superpixels made a compact representation of the regions of the images. Superpixels grouped the lettuce pixels and non-lettuce pixels together making it very useful in further segmentation.
This study used 50, 500 and 1000 number of superpixels to test the performance of the system. Table 1 gives the performance of the system in terms of segmentation.
(a) (b)
(c) (d)
(e) (f)
(g) (h)
[image:4.612.329.546.207.553.2]
Fig. 6. Proposed segmentation process, (a) original image, (b) L component of CIELab conversion (c) a component of CIELab conversion (d) b component of CIELab conversion (e) 1st level thresholding based on CIELab (f) superpixel boundaries overlaid on the original image (g) Each superpixel regions were replaced by the regions’ mean RGB (h) binary masking based on the 2nd level CIELab thresholding
TABLE I.
PERFORMANCE EVALUATION OF THE SYSTEM USING DIFFERENT
NUMBER OF SUPERPIXELS REGIONS
No. of Superpixels
Regions
Sensitivity Precision F1-Score Computing Time
n=0 0.992447 0.980764 0.986522 3.965996
n=50 0.982170 0.994207 0.987909 8.936581
n=500 0.997534 0.984113 0.990726 8.97144
[image:4.612.309.568.652.731.2]Notable improvements of segmentation for the proposed methods in terms of sensitivity, precision and F1-score are apparent in Table 1 compared to n=0 (Thresholding only). Selecting a more appropriate number of superpixels regions for the study presented here can improve the performance of the segmentation application. From the results, it was found out that n=500 performs best considering sensitivity while n=1000 performs best considering precision. However, an additional computing time of about 5 seconds is required.
Since F1 score is the harmonic mean of precision and
sensitivity, it achieves its best value when precision and recall are both high and of similar value. An optimal setting for sensitivity and precision can be achieved if the best F1 score is
required as illustrated in Figure 7. Based on the results (n=0,50,500 and 1000), the proposed methodology with the 1000 number of superpixel regions obtained the highest F1
[image:5.612.51.294.284.413.2]score.
Fig. 7. Sensitivity, Precision and F1-score vs. number of superpixel regions
VI. CONCLUSIONS
A proposed method using SLIC superpixels, two-level CIELab thresholding is proposed for segmentation of lettuce plant in a smart farm hydroponics setup. Based on the results, the methodology has improved segmentation of lettuce plant pixels and background pixels. Testing gave a high performance in segmentation in terms sensitivity, precision and F1-score for an additional computing time of about 5 seconds. F1-score identified experimentally, n=1000 supepixel regions as the optimal value for best performance in terms of sensitivity and precision. Future work includes modification of the methods to further segment leaves and stem from the segmented lettuce plant.
ACKNOWLEDGMENT
The authors are grateful for the support of USAID STRIDE, Department of Science and Technology – Philippine Council for Industry, Energy and Emerging Technology Research and Development (DOST-PCIEERD) and Commission on Higher Education (CHED). Special thanks to Intelligent Systems Laboratory (ISL) for the use of their laboratory equipment and project site in the completion of this research.
REFERENCES
[1] PJ.M. Loresco, I.C.Valenzuela, E.P. Dadios, Color space analysis using KNN for lettuce crop stages identification in smart farm setup, Proceedings of TENCON 2018 IEEE Region 10 Conference, 2018 , pp. 2040 – 2044
[2] A. Abbasi, N. Fahlgren, Naïve Bayes pixel-level plant segmentation , 2016 IEEE Western New York Image and Signal Processing Workshop (WNYISPW) , 2016, pp: 1 – 4
[3] Q. Cao, L .Xu, Unsupervised greenhouse tomato plant segmentation based on self-adaptive iterative latent Dirichlet allocation from surveillance camera, 2019, Agronomy 9(2),91
[4] M.P. Rico-Fernández,et. al, A contextualized approach for segmentation of foliage in different crop species, Computers and Electronics in Agriculture, 2019, 156, pp. 378-386,
[5] X. Guo, M. Zhang, Y. Dai, Image of plant disease segmentation model based on pulse coupled neural network with shuffle frog leap algorithm, 2018 14th International Conference on Computational Intelligence and Security (CIS), 2018, pp. 169 – 173
[6] R.G. de Luna et. al, Identification of Philippine herbal medicine plant leaf using artificial neural network, 2017 IEEE 9th International Conference on Humanoid, Nanotechnology, Information Technology, Communication and Control, Environment and Management (HNICEM), 2017, pp. 1 - 8
[7] P.J. Loresco, A.Bandala, A. Culaba, E. Dadios, Computer vision performance metrics evaluation of object detection based on Haar-like, HOG and LBP features for scale-invariant lettuce leaf area calculation, International Journal of Engineering and Technology,2018,7(4):pp. 4866-4872
T. Jerbi, A.V. Ramirez, D.V.D. Straeten, Robust plant segmentation from challenging background with a multiband acquisition and a supervised machine learning algorithm,
2, pp. 100-105
[9] P. Tamilselvi, K.A. Kumar, Unsupervised machine learning for clustering the infected leaves based on the leaf-colours, 2017 Third International Conference on Science Technology Engineering & Management (ICONSTEM), 2017, pp. 106 – 110
[10] Z. Feng , D. Nie , L. Wang , D. Shen, Semi-supervised learning for pelvic MR image segmentation based on multi-task residual fully convolutional networks, 2018 IEEE 15th International Symposium on Biomedical Imaging (ISBI 2018) 2018, pp. 885 – 888
[11] R. Bhagwat, Y. Dandawate, Indian plant species identification under varying illumination and viewpoint conditions, 2016 Conference on Advances in Signal Processing (CASP), 2016, pp. 469 - 473
[12] PJ.M. Loresco, E.P. Dadios, A scale-invariant lettuce leaf area calculation using machine vision and knowledge-based methods, International Journal of Engineering and Technology, 2018, 7(4): pp. 4880-4885
[13] D. Fernandez-Pacheco, D. Escarabajal-Henarejos, A. Ruiz-Canales, J. Conesa, J. Molina-Martinez, "A digital image-processing-based method for determining the crop coefficient of lettuce crops in the southeast of Spain," Biosyst. Eng., 2014, vol. 117, pp. 23-34,
[14] D. Escarabajal-Henarejos, J.M. Molina-Martínez, D.G.Fernández-Pacheco, F., Cavas-Martínez, G. García-Mateos, Digital photography applied to irrigation management of Little Gem lettuce, Agricultural Water Management, 2015, 151, pp. 148-157
[15] J.M. González-Esquiva et. al, Web application for analysis of digital photography in the estimation of irrigation requirements for lettuce crops, Agricultural Water Management, 2017, 183, pp. 136-145 [16] J.-S. Jiang, H.-J. Kim, W.-J. Cho, On-the-go image processing system
for spatial mapping of lettuce fresh weight in plant factory, IFAC-PapersOnLine , 2018, 51(17), pp. 130-134
[17] L. Cong, , S. Ding, , L. Wang, , A. Zhang, , W. Jia, Image segmentation algorithm based on superpixel clustering, IET Image Processing, 2018, 12(11), pp. 2030-2035
[18] Z. Ban, J. Liu, L. Cao,Superpixel segmentation using gaussian mixture model, IEEE Transactions on Image Processing, 2018, 27(8), pp. 4105-4117
[20] J.D. Stevens, T. Shaikh, MicroCEA: developing a personal urban smart farming device, 2nd International Conference on Smart Grid and Smart Cities, ICSGSC 2018, 2018, 8541311, pp. 49-56
[21] S. Banerjee, A. Choudhary, S. Pal, Empirical evaluation of k-means, bisecting k-means, fuzzy c-means and genetic k-means clustering algorithms, 2015 IEEE International WIE Conference on Electrical and Computer Engineering (WIECON-ECE), 2015, pp. 168 - 172
[22] E. Hot, V. Popović-Bugarin, Soil data clustering by using K-means and fuzzy K-means algorithm, 2015 23rd Telecommunications Forum Telfor (TELFOR), 2015, pp. 890 - 893
[23] L. Zhang, , B. Du, J. You, D. Tao, Hyperspectral image unsupervised classification by robust manifold matrix factorization, Information Sciences, 2019, 485, pp. 154-169
[24] M. Shrivastava, P. Matlani, A smoke detection algorithm based on K-means segmentation, 2016 International Conference on Audio, Language and Image Processing (ICALIP), 2016, pp. 301 - 305 [25] Y. Guo, L. Jiao, S. Wang, S. Wang, F. Liu, W. Hua, Fuzzy superpixels