Abstract— An anomaly (deviant objects, exceptions, peculiar objects) is an important concept of the analysis. The volume and velocity of the data within many systems makes it difficult to detect and process anomalies for Big Data in real-time. Many anomaly detective systems count on the historical data for detecting behaviors’. Considering it as a problem to financial institutions in Ghana, the researcher proposed robust anomaly detection framework. The proposed frame work defines Spark stream, as part of Spark ecosystem, which stream data in real-time. Also, the proposed framework data model was build using SVM, Linear regression and Logistic regression as a package found in Spark MLlib. Additionally, the proposed framework was explained clearly to be implemented in real systems for financial institutions.
Index Terms— Anomaly, Framework, MLlib, Spark ecosystem, Real-Time, Anomaly detection, Support Vector Machine.
I. INTRODUCTION
Big data was born out of the necessity of data sets growing so large and complex that traditional tools are no longer sufficient to process this data. Furthermore, predictive modeling such as anomaly detection should be performed on this big data.
Anomaly detection has been defined as the task of finding instances in a dataset which are different from the norm [1]. Similarly, [8] have anomalies a pattern in data that do not conform to a well-defined notion of normal or expected behavior. In essence therefore and anomalous data is one that deviates from the expected or different to what is known or expected. There are two applications areas of anomaly detection - intrusion detection (surveillance) and fraud detection. Intrusion detection refers to detection of malicious activity within a restricted domain. Detection of anomalies (outliers or rare events) has recently gained a lot of attention in many security domains, ranging from video surveillance and security systems to intrusion detection and fraudulent transactions [6], [5] and [7].
This work was supported in part by myself and other supporting authors (My gratitude goes to all supporting authors, for supporting financially and also contributing immensely your skills and knowledge into putting up this manuscript).
N. K. Gyamfi is with the Kumasi Technical University, Department of Computer Science, Ghana (+233 207443714; [email protected]).
P. Appiah is with the Department of Information Technology Education, University of Education, Winneba, College of Technology Education, Kumasi-Ghana, [email protected]
A. Aidoo is with the Professor of Mathematics, Eastern Connecticut State University, 83 Windham Street, Willimantic, CT 06226, Ph: 860.465.0115([email protected])
Fraud detection is the identification of actual or potential fraud within an organization. It relies upon the implementation of appropriate systems and processes to spot the early warning signs of fraud [2]. They further, explain that fraud detection usually includes combination of proactive or reactive and manual techniques. In the banking and financial management, business transactions and services generate to millions of data points each daily and these need to be stored, processed and analyzed.
This same exponential increase of data depicts in Ghana financial institutions. Each of these transactional data adds another row to the industry’s immense and growing number of datasets [4]. As Big Data expands in the financial sector, the sources of data it can use, the trustworthiness of each data source needs to be verified and the inclusion of concepts such as adversarial machine learning must be explored in order to identify maliciously inserted data [3]. The research in this paper will describe a technique to detect anomalous values in streaming real-time data with the proposed framework. This research is based on the notion that anomalies have dimensional, content and contextual locality. The primary goal of this proposed framework is to provide a scalable way to detect, classify and interpret anomalies in banks big data systems.
The following sections of the paper are organized as follows: the ‘Background and literature review’ section will describe related works in the field of anomaly detection in systems. The ‘Research design and methodology’ section will outline the approach taken by the proposed research. The framework will be well explained in ‘discussion’ section. Finally, the ‘Conclusions’ section will describe concluding thoughts and ideas for future work in this area.
A. BACKGROUND AND LITERATURE REVIEW In today’s business environment, the face of running trading activities has significantly change due to technological advancement and an increase reliance on it for business transaction. For business to survive in a competitive world they now rely on the advances made in technology to gain competitive edge. Financial institutions today receive millions of multiple data emanating from customers through different channels, in-person, social media, mobile phones, tables and many more and different platforms. According to Kaisler [14], managing and extracting information this different source is not only time consuming, but also pose a lot of technical challenges.
Anomaly Detection Framework for Big Data
from Ghana Perspective
B. KDD AND DATA MINING
Across a wide variety of fields, data are being collected and accumulated at a dramatic pace. There is an urgent need for a new generation of computational techniques and tools to assist humans in extracting useful information (knowledge) from the rapidly growing volumes of data [12]. Historically the notion of finding useful patterns in data has been given a variety of names including data mining, knowledge extraction, information discovery, information harvesting, data archaeology and data pattern processing. The term KDD was coined at the first KDD workshop in 1989 [13] to emphasize the knowledge is the end product of a data-driven discovery. Usama et al, [12] agree and stated that it has been popularized in artificial intelligence and machine learning. KDD comes with a distinct process follow as such, data preparation, data selection, data cleaning, incorporating appropriate prior knowledge and proper interpretation of the results of mining, are essential to ensure that useful knowledge is derived from the data. KDD has evolved, and continues to evolve, from the intersection of research fields such as machine learning, pattern recognition, databases, statistics, artificial intelligence, knowledge acquisition for expert systems, data visualization, and high performance computing.
Data mining has been mostly used by statisticians, data analyst and the management information systems (MIS). Data mining can be declared as discipline that concentrates on extensive database manipulations (Yahaya, 2007). According to Manpreet, Heena & Harish, [17] the process of extracting important and useful information from large sets of data is termed data mining. Yahaya argued that data mining not mainly for extracting important information but often used to help discover relationships, make choices, make predictions and improve processes. Usama et al, [12] contributed that KDD refers to the overall process of discovering useful knowledge from data while mining refers to a particular steps in this process. They further explained that Data mining is the application of specific algorithm for extracting patterns from data.
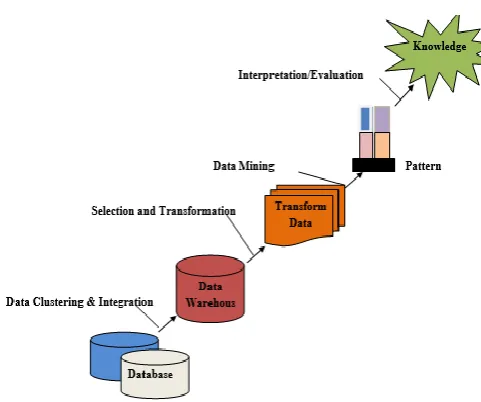
Knowledge Discovery (KDD) Process
[image:2.595.56.297.529.730.2]
Fig 3 Knowledge Discovery in Databases (KDD) Process
C. Data Mining Tools
It is rightfully said that data is money in today’s world. Along with transitions to an app-based world comes the exponential growth of data. However, it takes the combination of one or more algorithm and techniques to extract useful information from the data and transform it into understandable and usable form. There are plenty tools for data mining tasks using artificial intelligence, machine learning and other techniques to extract data. Here are six powerful mining tools frequently used.
RapidMiner: formerly known as YALE, written in java programming language, this tool offers advanced analytics through template-based frameworks. In addition to data mining, RapidMiner also provides functionality like data preprocessing and visualization, predictive analytics and statistic modeling, evaluation and deployment. It holds the top position on the list of data mining tools.
WEKA: The original non-Java version of WEKA primarily was developed for analyzing data from the agriculture domain. With the Java –based version, the tool is very sophisticated and used in many different applications including visualization and algorithms for data analysis and predicting modeling.
R-Programming: Project R, is GNU project, is written in R itself. It is primarily written in C and FORTRAN. And a lot of its modules are written it R itself. It’s a free software programming language and software programming language and software environment for statistical computing and graphics. The R language is widely used among data miners for developing statistics software and data analysis.
Orange: python is picking up in popularity because it’s simple and easy to learn yet powerful. It is good for python developers, is a python-based, powerful and open source tool for both novices and experts. You will love this tool visual programming and python scripting. It also has components for machine learning, add-ons for bioinformatics and text mining.
D. Big Data
of Big Data which is termed as ‘Vs’ of Big Data. Pandey and Tokekar, [11] looks at the basic characteristics of Big Data as ‘3V’.
Traditionally big data has been defined in terms of the three V’s, Volume, Velocity and Variety with the following properties.
a. Volume: Volume is the sum of all the data generated from all different sources per unit time. Many factors contribute towards increasing volume- storing data, live streaming data and data collected from various sources and sensors etc. b. Variety: Variety is provided for through the many
different data sources each generating some amount of data, whose form and structure may be different from all other, per unit time. In our recent world data comes in all types of formats- from traditional databases, text documents, emails, videos, audio, transactions etc.,
c. Velocity: This means the speed with which new data is generated and how quickly the data is process in other words how fast the data is being produced and how fast the data to be processed to meet the demand.
Priyana et al, [16] also define the characteristics by adding another ‘V’ which stands for the veracity of the data. Demchenko et al, [9] argues that, despite Big Data becoming a new buzz-word, there is no constant definition for this emerging technology. They hence, defines the characteristics of Big Data with a ‘5th
V’, that is ‘Value’. E. Anomaly in Big Data
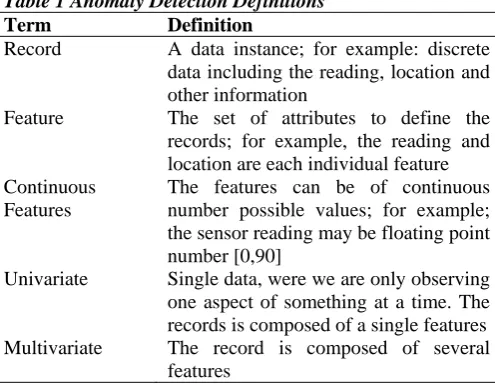
[image:3.595.303.551.56.248.2]Anomalies are data objects that do not comply with the general behavior or model of data. Such data objects are grossly different from or inconsistent with the remaining set of data (adaptation from the definition of “outliers” from the book ‘Data Mining: Concepts and Techniques’ [15]. Anomalies can be caused by the collecting of data from different classes. For example, in a dataset that stores the weights of oranges, there might be a mixture of a few grapefruits. However, the data itself can indicate a natural variation itself; for example, there could be an exception for unusually tall people. Jaiwai and Micheline, [15] in their paper the knowledge of analysts that helps interpret the meaning of these exceptional phenomena and determine if the results found indicate outliers – the noise in the datasets, or they are anomalies – data that may be of interest to users. Their ideal was great but they did not consider the effectiveness of the algorithm to implement for detection. Finding anomalies can be challenging, as in many cases we do not know how many outliers or anomalies exist in the datasets. Assigning thresholds to anomaly scores in order to flag data objects of high anomaly degrees can be difficult as the thresholds vary among datasets and it may require many tests in order to find out the correct ones. With the working assumption that there are considerably more ‘normal’ observations than ‘abnormal’ observations (outliers/anomalies) in the data, from Jaiwai and Micheline, [15] continuously suggested that the problem of detecting outliers in the dataset may become a ‘finding the needle in the haystack’ problem.
Table 1 Anomaly Detection Definitions
Term Definition
Record A data instance; for example: discrete data including the reading, location and other information
Feature The set of attributes to define the records; for example, the reading and location are each individual feature Continuous
Features
The features can be of continuous number possible values; for example; the sensor reading may be floating point number [0,90]
Univariate Single data, were we are only observing one aspect of something at a time. The records is composed of a single features Multivariate The record is composed of several
features
F. Technologies of Big Data Using Apache Hadoop There are a lot of tools and technologies that have being implements into the Apache Hadoop. Hadoop is an open sources framework for the implementation of Big Data with it characteristics. The Apache Hadoop software library is a framework that allows for the distributed processing of large data set across clusters of computers using simple programming models.
G. Hadoop Distributed File System (HDFS)
The Hadoop Distributed File System (HDFS) is designed to store very large data sets reliably, and to stream those data sets at high bandwidth to user applications. In a large cluster, thousands of servers both host directly attached storage and execute user application tasks. By distributing storage and computation across many servers, the resource can grow with demand while remaining economical at every size.
H. MapReduce
MapReduce provides the interface for distribution of sub-task and gathering of outputs. Is the heart of Hadoop, it is a programming paradigm that allows for massive scalability across hundreds or thousands of servers in a Hadoop cluster? The MapReduce concept is fairly simple to understand for those who are familiar with clustered scale-out data processing solutions. In the map phase, [10] explains that, input data is split into independent sub-programs and distributes it from the master node to the workers node for parallel processing in small units and back to the master node.
I. Flink
J. Spark
Spark is fast and general compute engine for Hadoop data. Spark provides a simple and expressive programming model that supports a wide range of applications, including ETL, machine learning, stream processing, and graph computation.
Spark is the heir apparent to the Big Data processing kingdom. Spark and Hadoop are often contrasted as an ‘either/or’ choice. The Hadoop ecosystem can accommodate the Spark processing engine in place of MapReduce, leading to all sorts of different environment make-ups that may include a mix of tools and technologies from both ecosystems.
K. Storm
Apache storm is a distributed real-time computation system, whose applications are designed as directed acyclic graphs. Storm is designed for easily processing unbounded streams, and can be used with any programming language. It has been benchmarked at processing over one million tuples per second per node, is highly scalable, and provides processing job guarantees. Unique for items on this list, Storm is written in Clojure, the Lisp-like functional-first programming language.
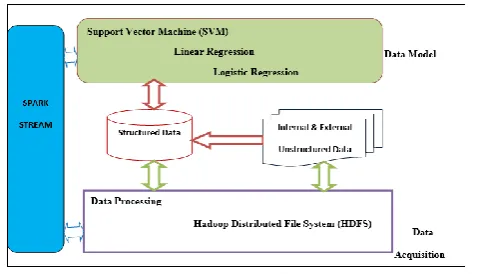
II. RESEARCH DESIGN AND METHODOLOGY The work proposed in this paper describes a framework consisting of Spark ecosystem. The work is described as a framework as it provides an extendible and modular approach to anomaly detection within bank data in particular. The primary reason for using Spark ecosystem is the interest of scalability for large amounts of data streaming and the refine algorithms. The Fig. 2 below shows the architecture of the proposed framework.
Fig 2. Propose Architecture for Big Data Anomaly Detection
The architecture for the proposed anomaly framework, consist of data processing with HDFS, data model by using Spark MLlib algorithms and the Spark stream. Particularly in the case of stream-based applications like ones used by banks, there is an expectation and requirement that the cluster will be available and performing at all times. Potential failures in the Spark driver must therefore be mitigated, wherever possible. The spark stream introduced the practice of checkpoints to ensure that data and metadata associated with RDDs containing parts of a stream are routinely replicated to some form for fault-tolerant storage. Linear regression, logistic regression and Support Vector Machine algorithm was used for modeling the data.
Classification method, known as support vector machine would be used to classify the features of credit cards by each customer. The binary SVM solves the problem of separating two classes represented by n examples of m attributes each. Consider the following problem:
{(x1, y1),..,(xn ,yn )}, xi ∈ R m, yi ∈ {−1,+1}}
Where xi are learning examples and yi their respective classes. The objective of the SVM method is to find a linear function f (equation 1) called hyperplane, which allows to separate the two classes:
F(x) =(x • w) +b (Eqn.1) Where x is an example to classify, w is a vector and b is a bias. We must therefore find the widest margin between the two classes, which is equivalent to minimizing ½w2.
Linear regression models the relationship between the Y ‘Label’ and the X ‘Feature’, in this case the relationship between the amount of fraud and claimed amount. The coefficient measures the impact of the feature, the claimed amount, on the label, the fraud amount. Multiple linear regression models the relation between two or more “Features” and a response ‘Label’. For example, model the relationship between the amount of fraud and the age of claimant, the amount, and the severity of the accident, the multiple linear regression function would look like this; yi = β0 + β1X1 + β2X2 + …
+ βρXp +
ϵ
(Eqn.2)AmntFraud = intercept +coeff1*age + coeff2*claimedAmnt +coeff3 * severity + error.
Whiles logistic regression is a statistical method for analyzing a dataset in which there are one or more independent variables that determine an outcome. The outcome is measured with a dichotomous variable (in which there are only two possible outcomes).
In logistic regression, the dependent variable is binary or dichotomous, i.e. it only contains data coded as 1 (TRUE, success, pregnant, etc.) or 0 (FALSE, failure, non-pregnant, etc.)
Logit (p) = b0+b1X1+b2X2+………+bkXk (Eqn. 3)
Where p is the probability of presence of the characteristic of interest, the logit transformation is defined as the logged odds:
Odds =
p probability of presence of characteristics 1 – p = probability of absence of characteristics (Eqn. 4)
and
Logit (p) = In p
1- p (Eqn. 5)
III. RESULT AND DISCUSSION
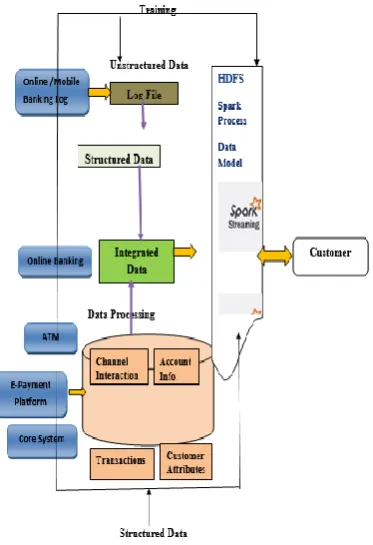
[image:4.595.50.289.467.604.2]Most detective system used by banks doesn’t’ have ability stream real-time data for anomaly. The proposed anomaly detection framework come with Spark APIs for streaming and batch processing, meaning that well modularized Spark functions for the offline machine learning can be used for the real time machine learning. The figure 3.0 below shows the proposed Anomaly Detection Framework.
Fig 3. Proposed Anomaly Detection Framework for Big Data
[image:5.595.74.261.136.409.2]Furthermore, the data flow for the real-time fraud detection using spark streaming is shown as follows in the figure 4 below.
Fig 4. Data Flow for the Real Time Fraud Anomaly Detection
1. Raw events come into Spark streaming as DStreams, which internally is sequence of RDDs. RDDs are like java Collection, except that the data elements contained in RDDs are partitioned across a cluster. RDD operation are performed in parallel on the data cached in memory, making the iterative algorithm often used in machine learning much faster for processing a lot of data.
2. The credit card transaction data is parsed to get the features associated with the transaction.
3. Card holder features and profile history are read from MapR-DB using the account number as the row key.
4. Some derived features are re-calculated with the latest transactions data.
5. Features are run with the model algorithm to produce fraud prediction scores.
6. Non- Fraud events enriched with derived features are published to the enriched topic. Fraud events with derived features are published to the fraud topic. Messages are not deleted from Topics when read, and topics can have multiple different consumers, this allows processing the same message by different consumers for different purposes.
In this solution, MapR Streams consumers read and store all raw events, enriched events and alarm to MapR-FS for future analysis, model training and updating.
IV. CONCLUSIONS
The work presented in the paper describes a framework for anomaly detection in Big Data. Specifically, the framework utilizes Spark streaming approach to identify anomalies in real-time. To cope with volume and velocity of Big Data, the anomaly detection algorithm relies on fast, albeit less accurate, point anomaly detection algorithm to find anomalies in real-time data streams. The Spark ecosystem, approach for the framework allows the linear and logistic regression algorithm to scale to Big Data requirement as the computationally more expensive algorithm is needed on a very small set of the data, i.e. the already determined anomalies.
In the future we would be looking how to implement this framework, and evaluate with real data from some financial institutions.
References
[1] Goldstein M. (2014). Anomaly Detection in Large Datasets, German Research Centre for Artificial Intelligence.
http://km.dfki.de/publication/anomaly-detection-large-datasets.
[2] Fraud Detection, http://www.statsoft.com/textbook/fraud-detection, date accessed: 17th December, 2014.
[3] Cloud Security Intelligence, (2013). Cloud Security Alliance Big Data Analytics for Security Intelligence, https://downloads.cloud
securityalliance.org/initiatives/bdwg/Big_Data_Analytics_for_Securit y_Intelligence.pdf, date accessed: 18th December, 2014.
[4] Turner D, Schroeck M and Shockley R. (2013). Analytics: The real-world use of big data in financial services. IBM Global Business Services.
[5] Latecki, L., Lazarevic, A., Pokrajac, D. (2007). Anomaly Detection with Kernel Density Functions, International Conference on Machine Learning and Data Mining – MLDM 2007, Leipzig, Germany.http://www-sers.cs.umn.edu/~aleks/anomaly_detection.htm (Date accessed: 29/01/2014).
[image:5.595.49.284.509.680.2][7] Cong Y., Liu J, Yuan J, and Luo J. (2013). Self-supervised Online Metric Learning with Low Rank Constraint for Scene Categorization, IEEE Transaction on Image Processing.
[8] Chandola V, Banerjee A and Kumar V. (2009). Anomaly Detection : A Survey, ACM Computing Surveys.
[9] Demchenko, Y., Laat, C. d., & Membrey, P. (2014). Defining Architecture Component of Big Data Ecosystem. IEEE, 104-112. [10] Sara, d. R., Lopez, V., Jose, M., & Herrera, F. (2014). On the use of
MapReduce for imbalanced big data using Random forest. Elsevier - Information Science, 112-137.
[11] Pandey, S., & Tokekar, V. (2014). Prominence of MapReduce in Big Data Processing. IEEE Computer Society, 555-560.
[12] Usama F, Gregory P & Padhraic Smyth (1996). From Data Mining to Knowledge Discovery in Databases. American association for artificial intelligent. 0738-4602-1996.
[13] Piatetsky-Shapiro, G.; Brachman, R.; Khabaza, T.; Kloesgen, W.; and Simoudis, E., 1996. An Overview of Issues in Developing Industrial Data Mining and Knowledge Discovery Applications. In Proceedings of the Second International Conference on Knowledge Discovery and Data Mining (KDD-96), eds. J.
[14] Kaisler, S. Armour, F & Espinosa A (2013), Introduction to Big Data: Scalable Representation and Analytics for Data Science. Hawaii international Conference on Systems.
[15] Han, Jaiwei and Micheline Kamber. Data Mining: Concepts and Techniques Morgan Kaufmann.
[16] Salawasna TA, Y Priyana IMUNES: design and implementation temperature and heartbeat sensors in measuring vital sign through watch. ieeexplore.ieee.org