Agriculture is a significant part of the economy in most member states of the European Union (EU). There is a decreasing share of this sector in employment and Gross Domestic Product(GDP) as a consequence of economic progress (Byerlee et al. 2005; Cervantes-Godoy and Brooks 2008), but it does not mean that its role in economic development has been decreasing. Agriculture accomplishes not only economic but also social, civil, cultural and environmental goals.
Therefore, the functioning of agriculture needs to be analysed, and the changes occurring in this area must be evaluated. The analysis of productivity of production factor is particularly important as it is a useful management tool at any economic level. At the national and sector level productivity factors facilitate evaluating the results of management and the quality of social and economic policies (Prokopenko 1987).
According to a generic definition, productivity is the ability of production factors to produce the output (Latruffe 2010). Productivity in agriculture can be cal-culated as partial productivity referring to a single fac-tor or as total productivity (multi-facfac-tor). Total facfac-tor
productivity (TFP) index is the relation of total produc-tion to total expenditure on such producproduc-tion (Coelli et al. 2005). The wide applicability of total productivity indices in economic analyses is associated with their comprehensive nature resulting from the aggregate analysis of expenditure. According to need, different methods of TFP analysis are applied. Total factor pro-ductivity of agriculture in the member states of the EU has been investigated quite extensively, but the studies often focused on a selected group of states (Brüm-mer et al. 2002) or covered a short period (Čechura et al. 2014). The most commonly applied TFP index is the Malmquist productivity index (Brümmer et al. 2002; Coelli et al. 2005). In turn, alternative produc-tivity indices, e.g. the Hicks-Moorsteen index or the Färe-Primont index are rarely mentioned in reference literature (Rahman and Salim 2013). One of the at-tractive features of the Färe-Primont index is that its increase can be fully attributed to increases in scale and mix efficiency (i.e. economies of scale and scope). For example, the Malmquist index ignores productivity changes associated with changes in scale. Moreover,
Productivity and its convergence in agriculture
in new and old European Union member states
Arkadiusz Kijek
1*, Tomasz Kijek
1, Anna Nowak
2, Adam Skrzypek
3 1Maria Curie-Sklodowska University, Lublin, Poland2University of Life Sciences in Lublin, Lublin, Poland
3Siedlce University of Natural Sciences and Humanities, Siedlce, Poland
*Corresponding author: akijek@poczta.umcs.lublin.pl
Citation: Kijek A., Kijek T., Nowak A., Skrzypek A. (2019): Productivity and its convergence in agriculture in new and old EU member states. Agricultural Economics – Czech, 65: 01–09.
Abstract: This study measures changes in total factor productivity of agriculture for 25 European Union (EU) mem-ber states in 2004–2016 using the Färe-Primont index. It also attempts to answer the question whether in the analy-sed period the levels of total factor productivity in this sector were convergent between member states. To this end, panel unit root tests were used. The study indicates that in new EU member states the level of total factor productivity (TFP) was relatively lower than in most EU-15 states. It was also found that convergence occurred in agricultural productivity almost in all EU member states (except Belgium and the United Kingdom). The research shows that in new EU member states the process of making up differences in the productivity of agriculture was stronger than in old EU member states.
the Färe-Primont index satisfies an identity axiom and a transitivity test.
The productivity of the agricultural sector is quite differentiated in respective member states of the EU (Błażejczyk-Majka et al. 2012, Nowak et al. 2016). Identification of the determinants of growth in agri-cultural productivity is the precondition to make up differences in TFP between member states. Studies on factors improving the productivity of agriculture are described, among other works, in papers written by Rao et al. (2004) and Kijek et al. (2016). They put emphasis on the significance of education, health, knowledge, experience, human capital, innovation, expenditure on research and development (R&D), infrastructure, institutions, economic openness, com-petition, and geographical situation.
Dudu and Kristkova (2017) investigated the impact of payments under Common Agricultural Policy Pil-lar II on the productivity of agriculture in the member states of the EU. The results confirmed significant positive effects of physical, human capital and ag-ri-environmental payments on factor-augmenting technical change in agriculture. It was found that human capital subsidies stimulate labour-augmenting technical change, whereas physical capital subsi-dies increase capital-augmenting technical change. Agri-environmental payments are in turn important in stimulating land-augmenting technical change.
However, the identification of TFP determinants is not the only significant issue of agricultural devel-opment. An important aspect of studies concerning the differentiation of productivity in member states of the EU is the analysis of trends in TFP variance and evaluating whether the distance between EU member states in terms of agricultural productivity is reduced (Baráth and Fertő 2017). Analysis of the process of aligning the economic growth between member states with different operating conditions (historical, institutional, and related to resources) is a major issue which has concerned economists for years. In order to determine the existence of TFP convergence, it must be clearly defined, and a crite-rion for verifying the convergence hypotheses must be set out. Convergence is interpreted as aligning the level of the analysed indicator between member states/regions in which initial levels of the indicator were different. A contrary phenomenon – growth in variance – is called divergence (polarization).
The first researchers who presented significant empirical studies on convergence were, among oth-ers: Barro and Sala-i-Martin (1992) and Mankiw
et al. (1992). Initially, studies focused on the analysis of the convergence of GDP per capita. Currently, empirical papers more and more often refer to the convergence of economic growth indicators other than GDP. Discussions on convergence or divergence, in particular in the conditions of progressing globali-sation, point to the multiplicity of approaches to this issue and the possibility to interpret the observed phenomena and processes. Studies on convergence referring to the agricultural sector were carried out by Rezitis (2010) who analysed the convergence of agriculture in European countries and the United States of America (USA). The results show a wide variation in the rate of TFP growth across countries with an average trend growth rate of 1.62%. Gala-nopouloset al. (2011) evaluated the convergence of agricultural productivity in 32 Western European countries, countries of Central and Eastern Europe and the Middle East and North Africa. The results suggest that, despite the fact that the Central and Eastern European (CEE) and Middle East and North African (MENA) countries have exhibited a high rate of productivity growth since the 1990s, absolute convergence cannot be confirmed. In turn, Baráth and Fertő (2017) investigated the convergence of to-tal factor productivity of agriculture between EU member states. The results imply that TFP slightly decreased in the EU between 2004 and 2013, how-ever, there were significant differences between old member states and new member states. The results suggest that productivity was generally converging over that period, albeit slowly. However, they point to a deficiency in studies in this area, and in particu-lar, as regards the comparison of the levels of TFP in agriculture between old and new member states.
The variety of convergence concepts makes their classification difficult. The way of convergence clas-sification depends on the assumed criteria. One of the more detailed studies on convergence is presented by Islam (2003), who distinguishes different types of convergence according to the methodological criterion. Next, to the so-called classical concepts of convergence (β-convergence and γ-convergence) the researchers employ the analysis of dynamics of income per capita
of verifying technological convergence is the analysis of total factor productivity (TFP). Islam (1995) refers to the convergence of TFP levels as ‘TFP-convergence’. In addition, he identifies deterministic and stochastic convergence. However, irrespective of its type, conver-gence always leads to the disappearance of inequalities between entities that are different at the beginning.
Due to the high diversity of the level of agriculture development in the member states of the EU and the importance of convergence issue in this sector, the objective of our study is to assess the changes in to-tal factor productivity of agriculture in the member states of the European Union in 2004–2015. We also attempt to answer the question whether there was a tendency to convergence or divergence of TFP levels in these countries.
MATERIAL AND METHODS
In the first step of our analysis, we calculated the total factor productivity (TFP) defined as the aggregated output-input ratio. For this purpose, we used the Färe-Primont index. It is worth noting that this index satis-fies all economically-relevant axioms and tests from index number theory and is multiplicatively-complete (O’Donnell 2011). The class of negative, non-decreasing and linearly homogeneous output-input aggregator functions included in the Färe-Primont index can be written as follows (O’Donnell 2011):
Q(q) = DO (x0, q, t0) (1)
X(x) = DI (x, q0, t0) (2)
where Q(.) is an aggregate output function, X(.) is an aggregate input function, x and q are input and output quantity vectors, x0 and q0 are vectors of representative input and output quantities, t0 denotes a representative time period, and DO(.) and DI(.)are output and input distance functions.
The aggregator functions (1) and (2) give rise to the Färe-Primont index that measures TFP of country i
in period t relative to TFP of country h in period s. The index takes the form (O’Donnell 2011):
0 0
0 0
,
0 0 0 0
, , , ,
TFP
, , , ,
O it I hs
hs it
O hs I it
D x q t D x q t
D x q t D x q t
(3)
In order to calculate the Färe-Primont index, we employed the DPIN program. The program uses data envelopment analysis (DEA) linear programs (LPs)
to estimate the production technology and levels of productivity. DEA is underpinned by the assumption that the output and input distance functions represent-ing the technology available in period t take the form:
, ,
'α γ 'β
O it it it it
D x q t q x (4)
, ,
'η 'ф δ
I it it it itD x q t x q (5)
where α, β, γ, δ, φ, η are unknown parameters.
DPIN estimates Färe-Primont aggregates by first solving the following variants of linear programs (O’Donnell 2011):
1 ' ' '0, , 0 0 minα,γ,β{γ 0β:γ β α; O
D x q t x ι X Q
'
0α 1; α 0; β 0}
q
(6)
1 ' ' '0, , 0 0 maxф,δ,η{ ф δ : ф δ0 η ; I
D x q t q Q ι X '
0η 1; ф 0; η 0}
x
(7)
where α, β, γ, δ, φ, η are unknown parameters and ι is an unit vector.
Going to TFP convergence analysis, firstly we tested the existence of cross-sectional dependencies in the calculated TFP scores, applying Pesaran (2004), Fried-man (1937) and Frees (2004) test. The first two tests involve the sum of the pairwise correlation coefficients of the residual matrix. This feature implies that these tests are likely to miss cases of cross-sectional depend-ence where the sign of the correlations is alternating. Contrary to the tests by Friedman and Pesaran, Frees’ test provides the possibility of detecting a false null hypothesis, even if there is plenty of cross-sectional dependence left out in the disturbances. As a result of the cross-sectional dependence tests we used Pesa-ran (2007) panel unit root test. PesaPesa-ran (2007) aug-ments the standard Augmented Dickey-Fuller (ADF) specification with the cross section average of lagged levels and first-differences of the individual series. This is done as follows:
1 1
Δyit a b yi i it c yi t d y eiΔ t it (8)
where:
1 1
Δyityityit , Δyt y yt t
1 1
1 , 1
(1/ ) N (1/ ) N
t i it t i it
y N
y y N
y (9)where yit is value of dependent variable for unit i
The unit root hypothesis is based on the t-ratio of the estimate of b bi
ˆi in the above regression. A truncated version of cross-sectionally augmented ADF t-statistics is also considered to correct for undue influence of extreme observations in short-T panels.We conducted our empirical analysis for a sample of 25 EU countries over the period 2004–2016 using panel data from the Eurostat datasets. Croatia, Malta and Cyprus were excluded due to missing data. For the purpose of TFP estimation, we used one output and three inputs. Our measure of the output variable included production value of the agricultural sector (producer prices) at constant prices (2005 = 100). In turn, the input variables were agricultural labour, capital and land. Labor input was measured in annual work unit (AWU), which corresponded to the work performed by one person who was occupied on an agricultural holding on a full-time basis. Capital input was retrieved from total intermediate consumption at constant prices (2005 = 100). Intermediate consump-tion covers purchases made by farmers for raw and auxiliary materials that are used as inputs for crop and animal production. It also includes expenditure on veterinary services, repairs and maintenance, and other services (Eurostat 2017). Land input denoted to the stock of utilised agricultural area. Since time series data for the land input was incomplete, we de-cided to replace missing values by the previous year non-missing values.
RESULTS AND DISCUSSION
Figure 1 presents the level of total factor productiv-ity (TFP) index for particular EU countries from the years 2004–2016.
The results indicate that the highest TFP index was characteristic of Italy, Spain and Greece. However, in the latter, a slight reduction in total factor pro-ductivity in the final years of the study period can be observed, which may be attributed to the economic crisis in that country. Similar trends regarding variance in total factor productivity in Greece are also sup-ported by the results of study carried out by Kijek et al. (2016) for the period 2007–2013. In Spain, except for two years (2012 and 2015), a systematic growth in the analysed index has been observed since 2006. In turn, Italian agriculture is characterized by area structure of farms being less advantageous than in other old EU member states and, despite higher increase in TFP, its workforce productivity in agriculture is considerably lower. In 2015, the gross value added (GVA) of 1 AWU
was 26 004.8 EUR, while the average for EU-15 was 30 535.4 EUR. It is also notable that in 2012–2015 total factor productivity of agriculture clearly increased in Belgium. Until 2012, TFP in that country presented a downward trend, which was also noted by Baráth and Fertő (2017) in their study. In countries such as the Netherlands, France, Luxembourg and Germany, TFP index remained at a relatively constant level throughout the study period with its value ranging between 0.4 and 0.5. It should be emphasised that the above-mentioned countries are included in a group of countries with the highest level of agricultural development, determined, among other things, by a high level of total factor productivity (Nowak et al. 2016). Alston et al. (2010) claimed that the growth in agricultural productivity was lower, in particular in the most developed countries of the world. However, apart for the United Kingdom, they did not analyse the situation in Europe in detail (Alston et al. 2010; Wang et al. 2012). Nonetheless, these observations are sup-ported by a stable level of TFP index in countries with the highest level of development of the agricultural sector. Productivity in the EU has increased over time, albeit at a slower rate in recent years than in the past. While the growth rate surpassed 1% per year between 1995 and 2005, it slowed down to around 0.8% be-tween 2005 and 2015. Member states where a stable but a little higher TPF index level than in the above-mentioned countries is observed include Austria, Portugal, Finland, Sweden, and the United Kingdom. In turn, low fluctuations in the level of the analysed index occurred in a group of five new member states of the EU – Bulgaria, the Czech Republic, Estonia, Latvia, and Lithuania, where it ranged from ca. 0.2 to ca. 0.35. In addition, it must be noted that Latvia had the lowest level of TFP index out of 25 member states of the EU covered by the study. Among new member states, the highest level of TFP of agriculture was recorded in Slovenia and Hungary. In addition, studies by Hamulczuk (2015) indicates that changes in TFP in Slovenia occur faster than in the remaining new member states of the EU.
neglect the time dimension of analysis (Salmerón and Romero-Ávilacross 2015). These shortcomings may be overcome, at least in part, by employing panel unit root tests. In addition, due to the small power of unit root tests for one-dimensional time series they were not taken into account.
If panel unit root tests are used, their application should be preceded by cross-sectional dependence (CD) analysis. Therefore, initially, the presence of CD was analysed using three tests of cross sectional inde-pendence: Pesaran, Friedman and Frees test. Table 1 presents the results of the tests.
The results of three tests suggest rejecting the zero hypothesis of cross-sectional independence at p < 0.01. It means there is a cross-sectional dependence across
[image:5.595.308.521.92.395.2]countries, which is supported by the average abso-lute value of correlation coefficients equal to 0.417. Therefore, we employed second-generation panel unit root tests to study convergence.
Figure 1. Total factor productivity (TFP) level for EU coun-tries in the years 2004–2016
AUT – Austria, BEL – Belgium, BUL – Bulgaria, CZE – Czech Republic, DEN – Denmark, EST – Estonia, FIN – Finland, FRA – France, GER – Germany, GRE – Greece, HUN – Hungary, IRE – Ireland, ITA – Italy, LAT – Latvia , LIT – Lithuania, LUX – Luxemburg, NED – Netherlands, POL – Poland, POR – Portugal, ROM – Romania, SLO – Slovenia, SPA – Spain, SWE – Sweden, SVK – Slovakia, UK – United Kingdom Source: own elaboration
0 0.1 0.2 0.3 0.4 0.5 0.6 0.7
04 05 06 07 08 09 10 11 12 13 14 15 16
BEL DEN GER
TFP level
IRE GRE
0 0.1 0.2 0.3 0.4 0.5 0.6 0.7
04 05 06 07 08 09 10 11 12 13 14 15 16
AUT POR FIN
TFP level
SWE UK
0 0.1 0.2 0.3 0.4 0.5 0.6 0.7
04 05 06 07 08 09 10 11 12 13 14 15 16
HUN POL ROM
TFP level
SLO SVK
0 0.1 0.2 0.3 0.4 0.5 0.6 0.7
04 05 06 07 08 09 10 11 12 13 14 15 16
SPA FRA ITA
TFP level
LUX NED
0 0.1 0.2 0.3 0.4 0.5 0.6 0.7
04 05 06 07 08 09 10 11 12 13 14 15 16
BUL CZE EST
TFP level
[image:5.595.66.283.104.542.2]LAT LIT
Table 1. Results of cross-sectional dependence (CD) analysis tests
Test Statistic p-value
Pesaran 10.963 0.0000
Friedman 58.723 0.0001
critical values
Frees 3.068 0.1984* 0.2620** 0.3901***
Out of panel unit root tests in the presence of cross-section dependence, the Pesaran test was selected. Simulations show that the cross-sectionally augmented panel unit root tests have satisfactory size and power even for relatively small number of cross sections N
and time periods T. TFP scores with cross-sectional average subtracted were used to measure variance in the productivity level between countries.
The Pesaran test assumed the lack of trend, whereas the number of lags included in each individual re-gression was determined based on the Wald test. In addition, in order to compare the phenomenon of convergence between EU member states, panel unit root tests were carried out in two groups. The first group included old member states of the EU (mem-bers before 2004), while the second group were new member states of the EU (members from 2004). The results of the Pesaran test for all member states, both old and new ones are presented in Table 2.
The results of the Pesaran test clearly indicate that convergence exists across all EU member states. De-tailed analysis in the groups of old and new member states of the EU shows that convergence does exist between old EU member states, whereas in the group of new EU member states the situation is ambiguous. For new EU member states, the p-value is slightly higher than 0.05, which means that TFP convergence between these countries is clearly weaker than for the group of old member states of the EU and for all the member states in total. A detailed analysis
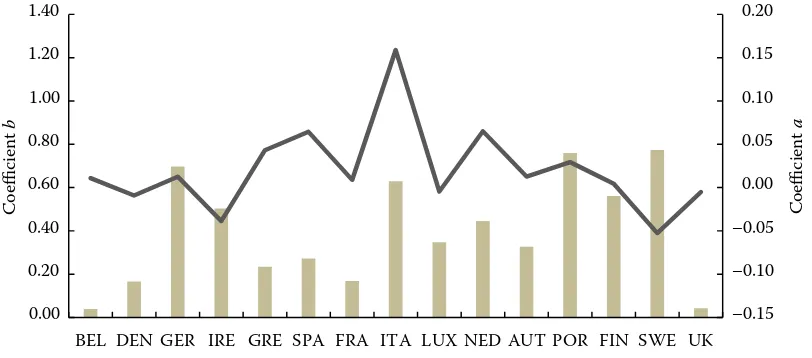
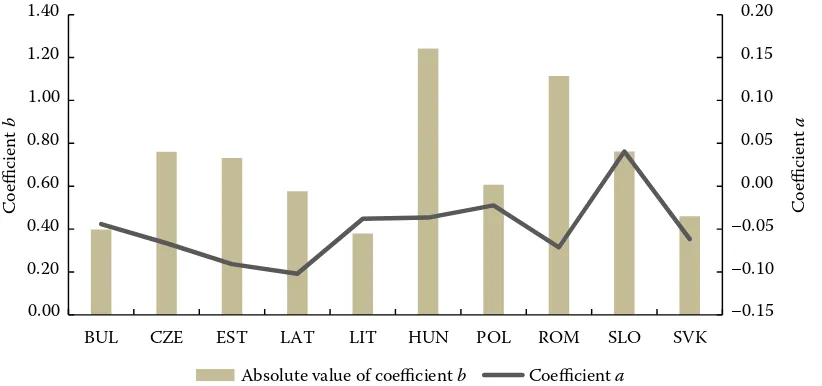
is required in order to explain this situation. For this purpose, we considered the values of coefficients for the model (1) in the group of all EU member states and presented them in Figure 2 (old EU member states) and Figure 3 (new EU member states).
The results show that most old EU member states gained higher productivity than the average for all member states. Only in Sweden and Ireland, TFP was clearly lower than the average. Such results comply with the expectations and confirm the advantage of old EU member states over new EU member states. Also, as expected, nearly all new EU member states (except Slovenia) had lower productivity than the average for the EU.
[image:6.595.304.532.108.166.2]For all the EU member states covered by the study, apart from Belgium, the coefficient b had a negative value, which testifies to the occurrence of convergence. In Belgium, its value was slightly above zero (practi-cally it was equal zero), which suggests divergence. Only in the United Kingdom, the situation was similar to that in Belgium, where the coefficient b was not much below zero. According to the results, Belgium
Table 2. Pesaran unit root test
Countries t-bar Z [t-bar] p-value
All (number = 25) –2.357 –2.893 0.002
Old members (number = 15) –2.404 –2.395 0.008
New members (number = 10) –2.258 –1.590 0.056
Source: own elaboration
Figure 2. Values of a and b coefficients in old EU countries
Symbols of EU member states are used according to the key in Figure 1 Source: own elaboration
–0.15 –0.10 –0.05 0.00 0.05 0.10 0.15 0.20
0.00 0.20 0.40 0.60 0.80 1.00 1.20 1.40
BEL DEN GER IRE GRE SPA FRA ITA LUX NED AUT POR FIN SWE UK
Coefficient
a
Coefficient
b
[image:6.595.95.501.506.685.2]and the United Kingdom can be regarded as countries where convergence did not occur. It may be explained by a high level of agricultural development in those countries as well as inhibited growth in total factor productivity (in Belgium until 2012), which is also supported by the results of a study carried out by the European Commission (2016). In addition, Eurostat databases indicate that the intensity of agricultural production in Belgium decreased in 2004–2015 (Eu-rostat 2017). The value of intermediate consumption in the analysed period decreased by as much as 25%, while it went up in most EU member states. It can be assumed that in other countries covered by the analy-sis convergence did occur but to a different extent.
The analysis for all countries shows that in new EU member states convergence processes were clearly stronger than in old EU member states. Thus, despite weaker convergence between new EU member states, there was a stronger tendency towards a common development path for all EU member states. In turn, old EU member states were more strongly converged than new EU member states, and at the same time, they were considerably closer to the common trend. It resulted in weaker convergence processes for these countries. Old EU member states characterised by the strongest convergence were Sweden, Portugal, Ger-many, Italy and Finland. On the other hand, in new EU member states, convergence processes were the strongest in Hungary, Romania, the Czech Republic, Slovakia and Estonia. New EU member states with
the lowest degree of convergence were Lithuania, Bulgaria and Slovakia. In the two latter countries, the value of agricultural production also decreased in 2004–2015 (in Bulgaria by 9% and Slovakia by 14%). Poudel et al. (2011), investigating reasons for the lack of convergence between respective states in the USA, point to differentiation in their development paths, which can be also observed for two groups within the EU (old and new member states). This situation is a result of different historical conditions that shaped the trajectories of development for respective member states. Research by Bah and Brada (2009) indicates that capital accumulation plays an important role in per capita income convergence, and thus future convergence also depends on continued high rates of capital accumulation.
It should be considered that the strategy of further development of the agricultural sector, in particular in new member states, will remain the improvement of efficiency of production factors, which ought to sup-port reducing differences in the level of agricultural development. However, this requires structural trans-formations in the agriculture of new member states, which are promoted by the mechanisms and instru-ments of the Common Agricultural Policy.
CONCLUSION
[image:7.595.95.506.99.292.2]The presented study measures the changes in total factor productivity of agriculture for 25 EU member
Figure 3. Values of a and b coefficients in new EU countries
Symbols of EU member states are used according to the key in Figure 1 Source: own elaboration
–0.15 –0.10 –0.05 0.00 0.05 0.10 0.15 0.20
0.00 0.20 0.40 0.60 0.80 1.00 1.20 1.40
BUL CZE EST LAT LIT HUN POL ROM SLO SVK
Coefficient
a
Coefficient
b
states in 2004–2015 using the Färe-Primont index. It also attempts to answer the question whether in the analysed period the levels of total factor pro-ductivity in this sector converged. According to the results of research, in new EU member states, the level of TFP index was relatively lower than in most EU-15 countries. It was also found that in nearly all EU member states (apart from Belgium and the United Kingdom) agricultural productivity convergence oc-curred. The study shows that in new EU member states the process of reducing differences in the productivity of agriculture was stronger than in old EU member states. It may be attributed to the fact that they are less developed than EU-15 countries. In addition, an intensified support to structural transformations in new member states, which could add dynamics to the increase of agricultural productivity, seems rea-sonable. The effective use of funds from the second pillar of the CAP should be helpful in this case.
This study contributes to the literature in the field of productivity of agriculture and convergence pro-cesses for three reasons. Firstly, the subjective scope of the study is the community of 25 EU member states. Secondly, this research refers to changes in total fac-tor productivity measured by the Färe-Primont index. It is multiplicatively complete and allows for taking into account the impact of all main production fac-tors in agriculture, that is, labour, land and capital. Thirdly, the paper attempts to fill the gap in studies on TFP convergence in the agricultural sector. As far as we are concerned, the main contribution of the article is the identification of individual indicators of TFP convergence for EU countries, which allowed for more detailed analyses. To our knowledge, such ap-proach to the study of TFP convergence in agriculture is novel and opens a new research area in this field.
The study has not exhausted the options for evaluat-ing convergence processes occurrevaluat-ing in the member states of the European Union. Further studies need to be carried out in this field, in particular with refer-ence to the evaluation of the impact of the cohesion policy and Common Agricultural Policy on reducing disparities between countries with different levels of agricultural development.
REFERENCES
Alston J.M., Andersen M.A., James J.S., Pardey P.G. (2010): Persistence Pays: U.S. Agricultural Productivity Growth and the Benefits from Public R&D Spending. Springer, New York.
Baráth L., Fertő I. (2017): Productivity and convergence in European agriculture. Journal of Agricultural Econom-ics, 68: 228–248.
Barro R.J., Sala-i-Martin X. (1992): Convergence. Journal of Political Economy, 100: 223–251.
Bernard A.B., Jones C.I. (1996): Technology and convergence. Economic Journal, 106: 1037–1044.
Błażejczyk-Majka L., Kala R., Maciejewski K. (2012): Produc-tivity and efficiency of large and small field crop farms and mixed farms of the old and new EU regions. Agricultural Economics, 58: 61–71.
Bah E., Brada J. (2009): Total Factor Productivity growth and structural change in transition economies. Comparative Economic Studies, 51: 421–446.
Brümmer B., Glauben T., Thijssen G. (2002): Decomposi-tion of productivity growth using distance functions: The case of dairy farms in three European countries. American Journal of Agricultural Economics, 84: 628–644.
Byerlee D., Diao X., Jackson C. (2005): Agriculture, Rural Development, and Pro-poor Growth: Country Experiences in the Post-Reform Era. Agriculture and Rural Develop-ment Discussion Paper 21. The World Bank, Washington. Cervantes-Godoy D., Brooks J. (2008): Smallholder adjust-ment in middle-income countries: Issues and policy re-sponses. OECD Food, Agriculture and Fisheries Working Papers, No. 12, OECD publishing.
Coelli T.J., Rao D.S.P., O’Donnell C.J., Battese G.E. (2005): An Introduction to Efficiency and Productivity Analysis. 2nd Ed. Springer, New York.
Čechura L., Grau A., Hockmann H., Kroupová Z., Levkovych I. (2014): Total Factor Productivity in European agricultural production. COMPETE Working Paper, No. 9, October 2014.
Dudu H., Kristkova Z.S. (2017): Impact of CAP Pillar II Pay-ments on Agricultural Productivity. Publications Office of the European Union, Luxembourg.
European Comission (2016): Productivity in EU agriculture – slowly but steadily growing. EU Agricultural Markets Briefs, No. 10, December 2016.
Eurostat (2017): Agriculture, forestry and fishery statis-tics 2017. Publications Office of the European Union, Luxembourg.
Friedman M. (1937): The use of ranks to avoid the assumption of normality implicit in the analysis of variance. Journal of the American Statistical Association, 32: 675–701. Frees E.W. (2004): Longitudinal and Panel Data: Analysis and
Applications in the Social Sciences. Cambridge University Press, Cambridge.
Galor O. (1996): Convergence? Inferences from theoretical models. Economic Journal, 106: 1056–1070.
Hamulczuk M. (2015): Total factor productivity convergence in the EU agriculture. In: Proceedings of International Confer-ence Competitiveness of Agro-Food and Environmental Economy, Bucharest, Nov 12–13, 2015: 34–43.
Islam N. (1995): Growth empirics: A panel data approach. Quarterly Journal of Economics, 110: 1127–1170. Islam N. (2003): What have we learnt from the convergence
debate? Journal of Economic Surveys, 17: 309–362. Kijek T., Nowak A., Domańska K. (2016): The role of
knowl-edge capital in Total Factor Productivity changes: The case of agriculture in EU countries. German Journal of Agri-cultural Economics, 65: 171–181.
Latruffe L. (2010): Competitiveness, productivity and ef-ficiency in the agricultural and agri-food sectors. OECD Food, Agriculture and Fisheries Papers, No. 30, OECD Publishing.
Mankiw N., Romer D., Weil D. (1992): A contribution to the empirics of economic growth. The Quarterly Journal of Economics, 107: 407–437.
Nowak A., Janulewicz P., Krukowski A., Bujanowicz-Haraś B. (2016): Diversification of the level of agricultural develop-ment in the member states of the European Union. Cahiers Agricultures, 25: 55004.
O’Donnell C.J. (2011): DPIN 3.0. A Program for Decomposing Productivity Index Numbers. University of Queensland, Queensland.
Pesaran M.H. (2004): General diagnostic tests for cross sec-tion dependence in panels. Cambridge Working Papers in Economics, 0435: 1–39.
Pesaran M.H. (2007): A simple panel unit root test in the presence of cross-section dependence. Journal of Applied Econometrics, 22: 265–312.
Poudel B.N., Paudel K.P., Zilberman D. (2011): Agricultural productivity convergence: Myth or reality? Journal of Ag-ricultural and Applied Economics, 43:143–156.
Prokopenko J. (1987): Productivity Management. A Practical Handbook. International Labour Office, Geneva. Rahman S., Salim R. (2013): Six decades of total factor
pro-ductivity change and sources of growth in Bangladesh agriculture (1948–2008). Journal of Agricultural Econom-ics, 64: 275–294.
Rao D.S.P., Coelli T.J., Alauddin M. (2004): Agricultural productivity growth, employment and poverty in develop-ing countries, 1970–2000. Employment Strategy Papers, 9: 28–43.
Rezitis A.N. (2010): Agricultural productivity and conver-gence: Europe and the United States. Applied Economics, 42: 1029–1044.
Salmerón M.C., Romero-Ávila D. (2015): Convergence in Output and Its Sources Among Industrialised Countries. A Cross-Country Time-Series Perspective. SpringerBriefs in Economics, Ham, Switzerland.
Wang S.L., Ball V.E., Fulginiti L.E., Plastina A. (2012): Ac-counting for the impacts of public research, R&D spill-ins, extension, and roads in U.S. agricultural productivity growth. In: Fuglie K., Wang S.L., Ball V.E. (eds): Agricul-tural Productivity: An International Perspective. CABI, Wallingford, 13–31.