Government transfers and subsidies in agriculture have a long history and have evolved significantly. The motivation for state intervention in agriculture and agricultural markets is various, but one of the ma-jor objectives has been to stabilise farm income (Meuwissen et al. 2008). Factors that enhance farm income do not necessarily affect income stability. Volatility in farm income is caused by unstable natural and market conditions that are determined by spe-cific features of agricultural production and markets linked to weather conditions, relatively slower growth in demand and faster growth in supply, declining real prices, the low mobility of production factors (land, capital and labour), and the low opportunity costs of labour. Unstable farm income has also been lower than incomes in the rest of the economy (OECD 2009).
Increasing farm income stability is among the key objectives of the Common Agricultural Policy
(CAP) of the European Union (EU), which uses a large share of its budget as subsidies for supporting and stabilising the income of its farmers. However, CAP is not implemented with a view to acting coun-tercyclically. The greater flexibility of CAP to stabi-lise farm income within current policy instruments is also not compatible with other CAP instruments and financial rules. Subsidies as a form of direct payments (DPs) within Pillar I and the rural devel-opment policies within Pillar II for less favoured areas and agri-environmental measures, as well as for farm investment and restructuring, do not focus directly on mitigating the instabilities of farm income, but on supporting determined quantities of farm input resources such as land, livestock and other farm resources. The amount of subsidies is fixed per measure and does not change over time to com-pensate for possible changes in farm market income.
Do CAP subsidies stabilise farm income in Hungary
and Slovenia?
Štefan Bojnec
1*, Imre Fertő
2,31Faculty of Management, University of Primorska, Koper, Slovenia 2Institute of Economics, CERS-HAS, Budapest, Hungary
3Kaposvár University, Kaposvár, Hungary *Corresponding author: stefan.bojnec@siol.net
Citation: Bojnec Š., Fertő I. (2019): Do CAP subsidies stabilise farm income in Hungary and Slovenia? Agricultural Econo-mics – Czech, 65: 103–111.
Abstract: A large share of the Common Agricultural Policy (CAP) budget takes the form of subsidies for supporting and stabilising the income of European Union farmers. This paper assesses whether CAP subsidies stabilise farm income and examines how subsidies may reduce the variability of farm income over time. The analysis is devel-oped on a constant sample of Hungarian and Slovenian Farm Accountancy Data Network farms during the period 2007–2015. It incorporates both the whole sample and farms classified according to two criteria: economic size, and the relative importance of subsidies. Farm income variability is analysed by means of variance decomposition using three main income components: market revenue income, subsidies, and the cost of external factors. Variability in farm income over time is high due to the high variability in the market revenue component. Subsidies mitigate instability in farm income because their variability is lower than that of market revenue income. While CAP subsidies thus represent a stable source of farm income, they have played a limited countercyclical role in stabilising total farm income. Subsidies are not found to be targeted at the farms that face the highest level of income variability and thus may not be an efficient tool for stabilising farm income.
Structural changes in agriculture and economic development have been strongly correlated to farm size growth and farm and agriculture-related socio-economic change, underlying the multifunctional nature of the latter and the increase in environmentally friendly farming and other practices in agriculture and rural areas as providers of public goods (OECD 2003). The policy shift from price and market support toward a greater role for public subsidies that promote economic, social and environmental sustainability objectives raises questions about what the appropriate agricultural policy and solutions are regarding farm income (OECD 2017).
The aim of the research described in this paper was to assess whether CAP subsidies stabilise farm income in Hungary and Slovenia, two of the new EU member states, and to examine how subsidies may reduce the variability of farm income over time. Hungary and Slovenia are known for having a rela-tively high share of subsidies in total farm income, meaning that subsidies are important for both the level of farm income and its stability, which can depend on the (economic) size of the farm and the relative share of subsidies in total farm income. While the variability of farm income over time is high due to the high variability in farm income from market revenue, subsidies can mitigate instability in farm income because they provide a stable source of farm income whose variability is lower than that of income derived from market revenue. Our results suggest that CAP subsidies in Hungary and Slovenia have played a limited countercyclical role in stabilising total farm income.
MATERIALS AND METHODS
This paper focuses on understanding the effect of ag-ricultural subsidies on Hungarian and Slovenian farm income variability using an analysis of farm-level data from the Hungarian and Slovenian Farm Accountancy Data Network (FADN) for the period 2007–2015 (Eu-ropean Commission 2019). We employed balanced panel data that contained a total of 10 872 observa-tions for Hungary and 1 249 observaobserva-tions for Slovenia. In contrast to earlier studies (Severini et al. 2016), we focused on the impact of total agricultural subsi-dies instead of only DPs. DPs comprise a significant part of the total subsidies targeted at farm income enhancement and stabilisation. In addition, all other subsidies contribute to farm income enhancement, irrespective of their specific goals, while if they are regularly received they can contribute to farm income stabilisation. This is the rationale for using total sub-sidies, not only DPs.
The analysis incorporated both the whole sample and the farm subsample according to: (i) classes of eco-nomic size (4 quartiles); and, (ii) relative weight of sub-sidies in total farm income (4 quartiles) (Table 1). Data regarding each of these groups is suitable for analysis given that a sufficient number of farms are represented within each group.
[image:2.595.64.534.563.720.2]The focus is on farm income (FI), defined as: FI = REV – EC + TS = MI + TS (1) where REV is revenues, EC the costs of external (i.e. non-family influenced) factors, TS is total subsidy, and MI is market income (i.e. FI – TS). REV is the FADN
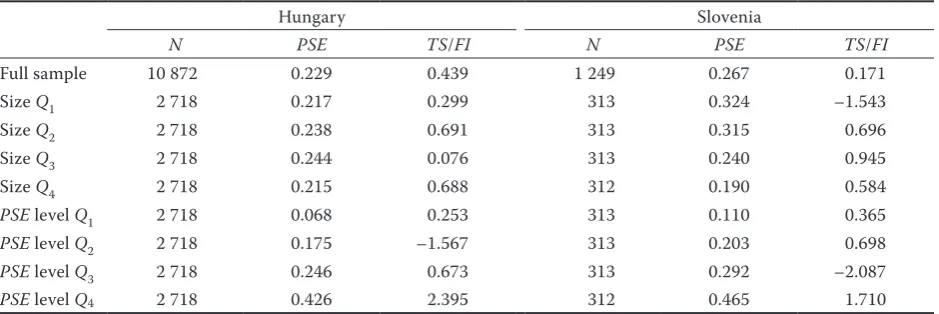
Table 1. Sample size and relative importance of subsidies
Hungary Slovenia
N PSE TS/FI N PSE TS/FI
Full sample 10 872 0.229 0.439 1 249 0.267 0.171
Size Q1 2 718 0.217 0.299 313 0.324 –1.543
Size Q2 2 718 0.238 0.691 313 0.315 0.696
Size Q3 2 718 0.244 0.076 313 0.240 0.945
Size Q4 2 718 0.215 0.688 312 0.190 0.584
PSE level Q1 2 718 0.068 0.253 313 0.110 0.365
PSE level Q2 2 718 0.175 –1.567 313 0.203 0.698
PSE level Q3 2 718 0.246 0.673 313 0.292 –2.087
PSE level Q4 2 718 0.426 2.395 312 0.465 1.710
variable coded SE131 (‘total output’), defined as the total value of the output of crops and crop products, livestock and livestock products and of other output, including other gainful activities of farms. EC is the FADN variable coded SE275 (‘total intermediate con-sumption’), defined as the total specific cost, including inputs produced on the holding and overheads arising from production, including machinery costs. TS is the FADN variable coded SE605 (‘total subsidies’), defined as the total subsidies for current operations linked to production, excluding investments. All data for FADN variables were deflated by means of the price indices which were obtained from the national statistical offices of Hungary and Slovenia, allowing comparison over time. FI and MI are calculated from Equation 1 using the FADN variable codes: FI = SE131 – SE275 + SE605, while MI = SE131 – SE275. FI represents remuneration for fixed factors of production on the family farms (work, land, and capital) and remuneration for entrepreneurial risk (loss/profit) in the accounting year.
The relative importance of TS was assessed by means of two indicators:
PSE = TS/(REV + TS) (2)
where producer subsidy equivalent(PSE),represents the relative importance of TS to whole farm receipts (REV + TS);
TS/FI (3)
which is the share of farm income of TS.
Variability of farm income was assessed by calcu-lating variance and coefficient of variation (CV) over the nine-year period for each individual farm. Fol-lowing the trends in recent literature, the importance of the three components of Equation 1 (i.e. revenues, costs of external factors and subsidies) on income variability was evaluated by employing variance de-composition by income sources, relying on multiplica-tive or addimultiplica-tive identities (El Benni and Finger 2013; Severini et al. 2016). More precisely, we decomposed the observed variability of farm income into its com-ponents (Equation 4).
Dividing Equation 4 by the sum of the first three variance terms provides a normalized format for its in-terpretation (Equation 5).
In Equation 5, p1, p2 and p3 are direct effects, and p12, p13 and p23 are the covariance effects. The three direct effects sum to unity, and an increase in the variance of any of these components increases the variability of FI. Negative (positive) covariance be-tween two factors shows that they move in the op-posite (same) direction over time (El Benni and Finger 2013). This allows for a reduction (increase) in the variability of FI. The results of the income decompo-sition analysis were expected to provide insight into the income-stabilising role of TS.
We investigated the role of TS on farm income stabi-lisation through comparing the coefficient of variation of FI with and without TS (i.e. MI). Note that compari-son of the coefficient of variation is not appropriate if the mean values of the variable have values that are close to zero or are negative. In the Hungarian (Slo-venian) sample, we had 355 (47) cases with negative values for FI, and 1 726 (353) farms with negative values for MI. To eliminate the problem, we restricted our sample to those farms that had a non-negative mean value of FI and MI, resulting in a constant sub-sample of 9 146 (896) farms (i.e. 84.1 and 71.6% of the whole sample). We calculated Pearson’s correlation between TS and MI on the nine years of data for each farm, pre-senting only average data for the whole sample and each group. We also conducted correlation analyses to assess whether TS is targeted to stabilise the income of farms faced with larger variability in income level. Thus, we computed Pearson’s correlation between the rela-tive importance of TS (PSE) and the level of CV of MI. Finally, we examined possible differences among farm groups using non-parametric Conover-Iman tests (Conover and Iman 1979).
RESULTS AND DISCUSSION
Support provided by subsidies
Subsidies in Hungarian and Slovenian agriculture are an important source of farm receipts and farm (5) (4)
2
,
– 2
,
–2 ( , )Var FI Var REV Var TS Var EC Cov REV TS Cov REV EC Cov TS EC
1 2 3 12 13 232 , 2 , 2 ,
Var REV Var TS Var EC Cov REV TS Cov REV EC Cov TS EC
p p p p p p
Var REV Var TS Var EC
income: on average, subsidies in Hungary (Slove-nia) account for 22.9% (26.7%) of total farm receipts with subsidies (PSE) and 43.9% (17.1%) of total farm income with subsidies (TS/FI) (Table 1).
Considerable differences can be seen within the con-stant sample of Hungarian and Slovenian farms by class of economic farm size and by relative importance of PSE level. For Slovenian farms, PSE declines from the first economic size quartile to the fourth size quar-tile, and vice versa; the relative importance of PSE level increases from the first quartile to the fourth quartile. The latter finding is also confirmed for Hungary, as the relative importance of PSE level increases from the first quartile to the fourth quartile, but the former finding does not hold, particularly for the second and third economic size quartile.
There is a non-linear relationship between the percent-age of subsidies in total farm income (TS/FI) by eco-nomic farm size class and by relative magnitude of PSE (at the group level). TS/FI by class of economic farm size is highest for the second quartile and lowest for the third quartile in Hungary, and highest for the third quartile and lowest for the first quartile in Slovenia. TS/FI accor-ding to relative importance of PSE level is highest for the fourth quartile in Hungary and in Slovenia and lowest for the second quartile in Hungary and the third quar-tile in Slovenia. This strongly non-linear distribution can be explained by the high volatility of farm income (ranging from negative to positive values) of individual farms in the nine years under analysis. The negative value of FI for economic farm size class Q1 and PSE level Q3 in Slovenia, and for PSE level Q2 for Hungary is one reason for the negative TS/FI ratio.
Variability of farm income over time
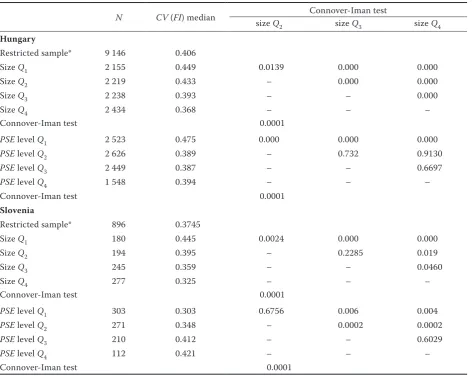
While there is variability in farm income for the con-stant sample with non-negative observations of Hun-garian and Slovenian farms over the nine-year period, such variability is lower than reported for a con-stant sample of Italian farms: on average, the median coefficient of variation of farm income (CV of FI) is 0.41 for Hungarian farms and 0.37 for Slovenian farms (Table 2), while it was assessed at 0.64 for Ital-ian farms (Severini et al. 2016).
Variability of farm income is highest for the first quar-tile of the smallest Hungarian and Slovenian farms, and then declines for the second, the third and the fourth quartile of the largest Hungarian and Slovenian farms. An inverse relation between variability of farm income and farm size was also found by Vrolijk and Poppe (2008)
and Severini et al. (2016). Moreover, a Conover-Iman test rejects the validity of the null hypothesis on equality of CV (FI) median values for the Hungarian farms be-tween economic farm size quartiles, as p-values indicate significant differences in Q1:Q2, Q1:Q3, Q1:Q4, Q2:Q3, Q2:Q4, and Q3:Q4. For Slovenia, the validity of the null hypothesis is rejected for the first quartile of the small-est farms (i.e. that their CV (FI) median value is the same as the CV (FI) median value for the other three quartiles), and that CV (FI) median value for the second farm size quartile is the same as the CV (FI) median value for the fourth farm size quartile. The alternative hypothesis is that the CV (FI) median values are not the same for the second farm size quartile and the third farm size quartile, while for the third farm size quartile we hypothesize that their CV (FI) median values are not the same as the CV (FI) median values for the fourth quartile of the largest farms. Differences between farm size groups for Hungarian and Slovenian economic size groups are statistically significant at the 5% confidence interval according to a Conover-Iman test.
hypothesis about the equality of the CV (FI) median value cannot be rejected. The alternative hypothesis is thus that the CV (FI) median values are not the same between the PSE level of the first quartile as the sec-ond quartile, and between the third quartile PSE level and the fourth quartile PSE level. A Conover-Iman test confirmed that differences between PSE levels groups for Hungarian and Slovenian farms are statistically significant (5% confidence interval).
Decomposition of sources of farm income variability
Following Severini et al. (2016), variance decompo-sition was conducted to identify direct and indirect effects and the relative importance of three income
components that contribute to farm income variabil-ity by economic farm size quartiles and by PSE level quartiles (Table 3).
[image:5.595.64.537.111.487.2]Most of the direct effects of the variance decom-position in Hungarian and Slovenian farm income are explained by farm revenues, and to a lesser extent by the costs of external factors. Subsidies contribute to the remainder of farm income variability. Variability in farm revenues can be explained by the variability of both the quantity of production/sales and farm product prices (Bojnec and Fertő 2018). Variability of farm costs may be determined by the variability of the prices of inputs purchased by farmers. While increases in farm product prices can increase farm revenues and farm income, rises in input prices can increase farm costs and reduce farm income.
Table 2. Variability of farm income over time
N CV (FI) median size Q Connover-Iman test
2 size Q3 size Q4
Hungary
Restricted sample* 9 146 0.406
Size Q1 2 155 0.449 0.0139 0.000 0.000
Size Q2 2 219 0.433 – 0.000 0.000
Size Q3 2 238 0.393 – – 0.000
Size Q4 2 434 0.368 – – –
Connover-Iman test 0.0001
PSE level Q1 2 523 0.475 0.000 0.000 0.000
PSE level Q2 2 626 0.389 – 0.732 0.9130
PSE level Q3 2 449 0.387 – – 0.6697
PSE level Q4 1 548 0.394 – – –
Connover-Iman test 0.0001
Slovenia
Restricted sample* 896 0.3745
Size Q1 180 0.445 0.0024 0.000 0.000
Size Q2 194 0.395 – 0.2285 0.019
Size Q3 245 0.359 – – 0.0460
Size Q4 277 0.325 – – –
Connover-Iman test 0.0001
PSE level Q1 303 0.303 0.6756 0.006 0.004
PSE level Q2 271 0.348 – 0.0002 0.0002
PSE level Q3 210 0.412 – – 0.6029
PSE level Q4 112 0.421 – – –
Connover-Iman test 0.0001
*restricted sample without negative farm income observations; N – number of observations; CV – coefficient of variation;
FI – farm income; Q – quartile; PSE – producer subsidy equivalent
Farm product prices and input prices may explain the direct impact on the variability of farm revenue and farm cost by economic farm size quartile. Farm revenues are the most important component of farm income variability for each of the economic farm size quartiles, particularly for the smallest, and even more for the largest farm size quartile. This direct effect of variance decomposition is reversed for farm costs. Subsidies are the least important direct source of farm income variability.
The distribution of direct sources of farm income variability differs according to PSE level quartiles. Direct effects of farm revenue decline and total sub-sidies increase with higher PSE. The direct effects of farm costs are more significant for Slovenian than Hungarian farms for each level of PSE.
Indirect effects are linked to the correlation between the three income components that were analysed that made a negligible contribution to total farm income
variability in the whole sample, by economic farm size quartile, and by PSE level quartile. This finding is valid for the covariance effect between farm rev-enues and external farm costs, as well as between farm revenues and subsidies. The latter positive covari-ance effect suggests that subsidies have not played a countercyclical role, in comparison to the oscillations of farm revenues over time. The small indirect effect between subsidies and external costs suggests that an increase in subsidies is associated with a relatively high level of external farm costs.
The ratio of farm revenues to farm income is higher than the ratio of costs of external factors to farm income. It is interesting to note that the relative importance of income sources by economic farm size quartile is in all cases higher than the aver-age of the total sample of Slovenian farms, while in Hungary this finding is valid only for the first and second quartiles of smaller economic farm sizes.
Ex-Table 3. Sources of variability of farm income
Variance decomposition Relative importance of income sources
direct effects indirect effects
p1 p2 p3 p12 p13 p23 REV/FI subsidy/FI EC/FI
Hungary
Full sample* 0.908 0.032 0.059 0.0002 0.0002 0.0001 3.29 1.20 –0.20
Size Q1 0.911 0.019 0.069 0.0009 0.0010 0.0003 4.06 2.61 –1.61
Size Q2 0.739 0.043 0.218 0.0006 0.0009 0.0003 3.47 0.79 0.21
Size Q3 0.795 0.027 0.178 0.0007 0.0010 0.0003 2.61 0.67 0.33
Size Q4 0.910 0.034 0.054 0.0009 0.0010 0.0003 3.06 0.76 0.24
PSE level Q1 0.924 0.016 0.060 0.0008 0.0002 0.0002 5.44 0.31 0.69
PSE level Q2 0.904 0.039 0.057 0.0008 0.0008 0.0007 2.08 0.44 0.56
PSE level Q3 0.846 0.088 0.066 0.0009 0.0009 0.0004 2.24 0.73 0.27
PSE level Q4 0.759 0.195 0.046 0.0014 0.0012 0.0007 3.50 3.38 –2.38 Slovenia
Full sample* 0.838 0.015 0.145 0.000 0.002 0.003 1.86 0.49 1.24
Size Q1 0.802 0.047 0.150 0.002 0.012 0.009 3.39 1.68 3.54
Size Q2 0.708 0.049 0.243 0.003 0.011 0.008 3.35 1.65 3.72
Size Q3 0.674 0.056 0.270 0.006 0.008 0.003 2.64 0.88 2.30
Size Q4 0.884 0.014 0.103 0.007 0.008 0.001 2.87 0.59 2.21
PSE level Q1 0.876 0.004 0.119 0.006 0.008 0.001 2.94 0.37 2.06
PSE level Q2 0.642 0.037 0.321 0.006 0.008 0.003 3.05 0.81 2.54
PSE level Q3 0.649 0.102 0.249 0.009 0.009 0.004 3.38 1.39 3.47
PSE level Q4 0.528 0.264 0.207 0.015 0.015 0.007 2.85 2.24 3.68
*full sample including negative farm income observations; REV – revenues; FI – farm income; EC – costs of external factors;
Q – quartile; PSE – producer subsidy equivalent
[image:6.595.65.533.113.444.2]cept for the fourth quartile of the largest Hungarian farms, the ratio of subsidies to farm income decreases from smaller to bigger economic farm size (at the level of quartile). As expected, the subsidy-to-farm income ratio increases from lower to higher PSE level at quartile level. This clearly indicates the very important role that subsidies play in farm income in Hungary and Slovenia.
Do subsidies stabilise farm income?
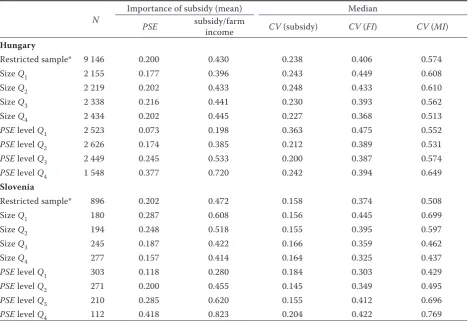
Table 4 shows, for the restricted sample of obser-vations with non-negative farm income values, that subsidies can stabilise farm income due to their lower variability than other components of farm income, particularly market income (MI).
The income-stabilising role of subsidies increases as one moves from the first to the higher quartiles of PSE level. This finding for Hungarian and Slovenian farms is in line with findings for Italian farms
[image:7.595.64.535.388.709.2]of Sev-erini et al. (2016). On the other hand, the income-stabilising role of subsidies in Slovenia, and to a lesser extent Hungary, decreases when moving from the first quartile of smallest farms to the higher quartiles (i.e. larger farms). There is an inverse relationship between the variability of market income and the variability of subsidies in Slovenia and a more stable relationship for Hungary. Except for Hungary, where the variability of subsidies is greatest for the first PSE level, the variability of subsidies in Slovenia increases only slightly when moving from the second to the third quartile of farm economic size, and when mov-ing from the second to the higher quartiles of PSE level. Wilcoxon tests (p-values = 0.000) confirmed that the differences between the median values of CV (subsidy), CV (FI) and CV (MI) are always statisti-cally significant at 1%. Consistent with the findings of Severini et al. (2016), the greater the relative level of subsidy increases, the greater the increase in the stabilising role of subsidies. Farms that receive a
Table 4. Income-stabilising effect of subsidies
N Importance of subsidy (mean) Median
PSE subsidy/farm income CV (subsidy) CV (FI) CV (MI) Hungary
Restricted sample* 9 146 0.200 0.430 0.238 0.406 0.574
Size Q1 2 155 0.177 0.396 0.243 0.449 0.608
Size Q2 2 219 0.202 0.433 0.248 0.433 0.610
Size Q3 2 338 0.216 0.441 0.230 0.393 0.562
Size Q4 2 434 0.202 0.445 0.227 0.368 0.513
PSE level Q1 2 523 0.073 0.198 0.363 0.475 0.552
PSE level Q2 2 626 0.174 0.385 0.212 0.389 0.531
PSE level Q3 2 449 0.245 0.533 0.200 0.387 0.574
PSE level Q4 1 548 0.377 0.720 0.242 0.394 0.649
Slovenia
Restricted sample* 896 0.202 0.472 0.158 0.374 0.508
Size Q1 180 0.287 0.608 0.156 0.445 0.699
Size Q2 194 0.248 0.518 0.155 0.395 0.597
Size Q3 245 0.187 0.422 0.166 0.359 0.462
Size Q4 277 0.157 0.414 0.164 0.325 0.437
PSE level Q1 303 0.118 0.280 0.184 0.303 0.429
PSE level Q2 271 0.200 0.455 0.145 0.349 0.495
PSE level Q3 210 0.285 0.620 0.155 0.412 0.696
PSE level Q4 112 0.418 0.823 0.204 0.422 0.769
*restricted sample without negative farm income observations; N – number of observations; PSE – producer subsidy equivalent;
higher level of subsidies can better cope with a high level of market income variability than other farms (El Benni et al. 2012).
While the variability of subsidies is smaller than the variability of farm market income, this does not a priori mean that subsidies have played a countercycli-cal role in moderating fluctuations in market income as a share of farm income over time. Therefore, the correla-tion between MI and subsidy was assessed to identify whether subsidies are targeted to stabilise the income of farms that face greater market income variability. Table 5 reveals that only for the smallest farms (first economic size quartile) in Slovenia is the evolution of subsidies over the nine years of analysis negatively correlated with the evolution of MI. This empirical result suggests that subsidies have played only a lim-ited countercyclical role in terms of fluctuations in MI over the analysed nine years. Moreover, the empirical results suggest that subsidies are not well targeted: the correlation coefficients between the variability of MI and the relative level of PSE – except for the second and third economic farm size quartiles in Slovenia – are low. We therefore conclude that subsidies are not specifically targeted to stabilise the income of farms that witness large variations in income.
CONCLUSION
In spite of the fact that Hungarian and Slovenian farms have received a substantial share of their in-come through subsidy support, which has contributed to stabilising income, the farm income stabilisation role of subsidies has been limited due to the
lim-ited countervailing role of subsidies weighed against the very high instability and fluctuations in market farm income, and to a lesser extent costs incurred due to external factors. The failure of CAP subsidy policy to react in a countercyclical fashion, particularly to oscillations in market farm income, is confirmed.
Stability of employment and the use of different farm input resources in sum lead to greater stability of farm income from subsidies, but are independent of instabilities in market farm income which largely depend on farm sales and potentially greater insta-bilities in farm output prices and, thus, to greater exposure to potential oscillations in production, marketing and sales conditions. In addition, CAP subsidies do not account for input prices and input costs, which represent less important causes of farm income instability than market farm income, a finding which has also been confirmed for other countries (Severini et al. 2016). The variability of farm income that is associated with the variability of market farm income remains an open question for farm managers and policy makers, while both private market risk management tools and/or CAP public policy instru-ments aim at reducing market farm revenue variability and, through this, at stabilising farm income.
[image:8.595.67.533.112.271.2]Farm-input/resource-quantity-based CAP subsi-dies contribute to increasing farm income and might contribute to the renewal and growth of farm input resources, which may be important for farm restruc-turing, but are less likely to stabilise farm income. In reality, the primary objective of CAP subsidies is not to stabilise farm income. The specific focus of our analysis was on groups of farms delineated
Table 5. Correlation between market income (MI) and subsidy, and between the coefficient of variation of MI and of subsidy
Hungary Slovenia
MI and subsidy CV (MI) and PSE MI and subsidy CV (MI) and PSE
Restricted sample* 0.77 0.15 0.29 0.37
Size Q1 0.72 0.13 –0.02 –0.02
Size Q2 0.05 0.25 0.36 0.42
Size Q3 0.09 0.14 0.03 0.49
Size Q4 0.76 0.13 0.23 0.19
PSE level Q1 0.73 –0.03 0.55 –0.02
PSE level Q2 0.89 0.04 0.69 0.11
PSE level Q3 0.90 0.06 0.77 0.13
PSE level Q4 0.79 0.14 0.81 0.28
*restricted sample without negative farm income observations; MI – market income; CV – coefficient of variation; PSE – pro-ducer subsidy equivalent
according to economic size classes and the relative importance of subsidies. Consistent with the results of earlier studies (Severini et al. 2016), small farms in Hungary and Slovenia are found to face a higher level of income variability than larger (economic size) farms. Relatively large amounts of subsidies in farm income are more liable to stabilise farm income.
Indirectly, CAP subsidies contribute to stabilising farm income mainly because they are less variable than the remaining sources of income and thus mitigate the variability of farm income over time. However, this is not enough to eradicate the variability in the farm income that arises from market farm income, as well as from the cost of external factors. Therefore, subsidies are found to play a very limited counter-cyclical role in terms of moderating the fluctuations of the remaining farm income. A striking finding, similar to those of earlier studies (Severini et al. 2016, 2017), is that CAP subsidies are not targeted at those farms that face the highest level of income variability. The lack of a strong link between subsidies and farm income stability suggests that, while subsidies reduce instability in farm income, they are less likely to serve as an efficient tool for stabilising it. CAP subsidies are increasing the level of farm income, but are not stabilising farm income in Hungarian and Slovenian farms. They only reduce the volatility which arises from market farm income and, to a lesser extent, from the cost of external factors.
A limitation of the present analysis is that it assumes that a reduction in DPs does not affect production costs. This may be true for completely decoupled DPs, but may not be the case for coupled DPs and other forms of support such as rural development pay-ments that affect farmers’ behaviour. To obtain more information and in-depth results about CAP subsidies and their effects, more detailed analysis of the impact of different CAP subsidies on farm income variability according to the type of farm and different farming conditions (such as a comparison between farms in less and non-less favoured areas) is suggested.
REFERENCES
Bojnec Š., Fertő I. (2018): Assessing and understanding the drivers of farm income risk: evidence from Slovenia. New Medit, 17: 23–35.
Conover W.J., Iman R.L. (1979): On Multiple-Comparisons Procedures. Technical Report LA-7677-MS, Los Alamos Scientific Laboratory, Los Alamos.
El Benni N., Finger R., Mann S., Lehmann B. (2012): The dis-tributional effects of agricultural policy reforms in Swit-zerland. Agricultural Economics – Czech, 58: 497–509. El Benni N., Finger R. (2013): Gross revenue risk in Swiss
dairy farming. Journal of Dairy Science, 96: 936–948. European Commission (2019): Farm Accountancy Data
Net-work. European Commission, Brussels. Available at http:// ec.europa.eu/agriculture/rica/concept_en.cfm.
Meuwissen M.P.M., van Asseldonk M.A.P.M., Huirne R.B.M. (eds.) (2008): Income Stabilisation in European Agricul-ture. Wageningen Academic Publishers, Wageningen. OECD (2003): Multifunctionality – towards an Analytical
Framework. OECD, Paris.
OECD (2009): Managing Risk in Agriculture. A Holistic Ap-proach. OECD, Paris.
OECD (2017): Evaluation of Agricultural Policy Reforms in the European Union. The Common Agricultural Policy 2014–20. OECD, Paris.
Severini S., Tantari A., Di Tommaso G. (2016): Do CAP direct payments stabilise farm income? Empirical evidences from a constant sample of Italian farms. Agricultural and Food Economics, 4: 1–17.
Severini S., Tantari A., Di Tommaso G. (2017): Effect of ag-ricultural policy on income and revenue risks in Italian farms: implications for the use of risk management policies. Agricultural Finance Review, 77: 295–311.
Vrolijk H.C.J., Poppe K.J. (2008): Income variability and in-come crisis in the European Union. In: Meuwissen M.P.M., van Asseldonk M.A.P.M., Huirne R.B.M. (eds): Income Stabilisation in European Agriculture. Wageningen Aca-demic Publishers, Wageningen: 33–54.