Ames Laboratory Accepted Manuscripts
Ames Laboratory
2-5-2019
Ultrafast manipulation of topologically enhanced
surface transport driven by mid-infrared and
terahertz pulses in Bi2Se3
Liang Luo
Iowa State University and Ames Laboratory, liangluo@iastate.edu
Xu Yang
Iowa State University and Ames Laboratory, xuy@iastate.edu
X. Liu
University of Notre Dame
Zhiyan Liu
Iowa State University and Ames Laboratory, zyliu@iastate.edu
Chirag Vaswani
Iowa State University and Ames Laboratory, chiragv@iastate.edu
See next page for additional authors
Follow this and additional works at:
https://lib.dr.iastate.edu/ameslab_manuscripts
Part of the
Condensed Matter Physics Commons
, and the
Quantum Physics Commons
This Article is brought to you for free and open access by the Ames Laboratory at Iowa State University Digital Repository. It has been accepted for inclusion in Ames Laboratory Accepted Manuscripts by an authorized administrator of Iowa State University Digital Repository. For more information, please contactdigirep@iastate.edu.
Recommended Citation
Luo, Liang; Yang, Xu; Liu, X.; Liu, Zhiyan; Vaswani, Chirag; Cheng, Di; Mootz, M.; Zhao, Xin; Yao, Yongxin; Wang, Cai-Zhuang; Ho, Kai-Ming; Perakis, I. E.; Dobrowolska, M.; Furdyna, J. K.; and Wang, Jigang, "Ultrafast manipulation of topologically enhanced surface transport driven by mid-infrared and terahertz pulses in Bi2Se3" (2019).Ames Laboratory Accepted Manuscripts. 245.
Ultrafast manipulation of topologically enhanced surface transport driven
by mid-infrared and terahertz pulses in Bi2Se3
Abstract
Topology-protected surface transport of ultimate thinness in three-dimensional topological insulators (TIs) is
breaking new ground in quantum science and technology. Yet a challenge remains on how to disentangle and
selectively control surface helical spin transport from the bulk contribution. Here we use the mid-infrared and
terahertz (THz) photoexcitation of exclusive intraband transitions to enable ultrafast manipulation of surface
THz conductivity in Bi2Se3. The unique, transient electronic state is characterized by frequency-dependent
carrier relaxations that directly distinguish the faster surface channel than the bulk with no complication from
interband excitations or need for reduced bulk doping. We determine the topological enhancement ratio
between bulk and surface scattering rates, i.e.,
γ
BS/
γ
SS ~3.80 in equilibrium. The ultra-broadband,
wavelength-selective pumping may be applied to emerging topological semimetals for separation and control
of the protected transport connected with the Weyl nodes from other bulk bands.
Keywords
Terahertz optics, Topological insulators, Ultrafast photonics
Disciplines
Condensed Matter Physics | Quantum Physics
Authors
Liang Luo, Xu Yang, X. Liu, Zhiyan Liu, Chirag Vaswani, Di Cheng, M. Mootz, Xin Zhao, Yongxin Yao,
Cai-Zhuang Wang, Kai-Ming Ho, I. E. Perakis, M. Dobrowolska, J. K. Furdyna, and Jigang Wang
ARTICLE
Ultrafast manipulation of topologically enhanced
surface transport driven by mid-infrared and
terahertz pulses in Bi
2
Se
3
L. Luo
1, X. Yang
1, X. Liu
2, Z. Liu
1, C. Vaswani
1, D. Cheng
1, M. Mootz
3, X. Zhao
1, Y. Yao
1, C.-Z. Wang
1,
K.-M. Ho
1, I.E. Perakis
3, M. Dobrowolska
2, J.K. Furdyna
2& J. Wang
1Topology-protected surface transport of ultimate thinness in three-dimensional topological insulators (TIs) is breaking new ground in quantum science and technology. Yet a challenge remains on how to disentangle and selectively control surface helical spin transport from the bulk contribution. Here we use the mid-infrared and terahertz (THz) photoexcitation of exclusive intraband transitions to enable ultrafast manipulation of surface THz conductivity in Bi2Se3. The unique, transient electronic state is characterized by frequency-dependent carrier relaxations that directly distinguish the faster surface channel than the bulk with no com-plication from interband excitations or need for reduced bulk doping. We determine the topological enhancement ratio between bulk and surface scattering rates, i.e.,γBS/γSS~3.80 in equilibrium. The ultra-broadband, wavelength-selective pumping may be applied to emerging topological semimetals for separation and control of the protected transport connected with the Weyl nodes from other bulk bands.
https://doi.org/10.1038/s41467-019-08559-6 OPEN
1Department of Physics and Astronomy and Ames Laboratory-U.S. DOE, Iowa State University, Ames, Iowa 50011, USA.2Department of Physics, University
of Notre Dame, Notre Dame, IN 46556, USA.3Department of Physics, University of Alabama at Birmingham, Birmingham, AL 35294-1170, USA.
Correspondence and requests for materials should be addressed to J.W. (email:jgwang@ameslab.gov)
123456789
T
he recent discovery of topology-protected charge trans-port of three-dimensional (3D) TIs has led to a pro-mising platform for exploring both fundamental topological quantum phenomena and technological applica-tions1–7. The emergent behaviors associated with this exotic state of matter, such as spin-locking, helical spin structure, topological invariant, chiral anomaly, and dissipationless cur-rents8–13, offer new perspectives for achieving transformational technological applications in spintronics and quantum sensing, computing, and communications3 beyond the currenttech-nological limit. One of the current frontiers for topological phenomena lies in the fundamental challenge of how to dis-entangle and manipulate symmetry-protected transport from bulk conduction. On one hand, development and optimization of hot electron transistors and modulators operating at ultra-high THz frequencies will significantly benefit from the direct probing of ultrafast THz charge transport on the surface and from a better understanding of the fundamental effects of topological spin-locking on carrier scattering. Although the existence of a helical Dirac spectrum has been well established in electrical transport14 and photoemission8,15,16, ultrafast control of THz helical spin transport is much less known. This is due, in part, to the limitations of conventional transport characterization methods that are incapable of probing frequency-dependent conductivity characterized by femtose-cond (fs) in time and THz in energy scales, especially with low frequency photon pumping17–19. On the other hand, in 3D TIs, the coexistence and mutual scattering of Dirac and bulk car-riers lead to an intertwined response. Despite recent observa-tions from static THz measurements of TI samples with significantly reduced doping and defects20,21, it is still chal-lenging to selectively control the intrinsic surface dynamics from the bulk contribution for samples that exhibit uninten-tional doping into bulk states.
The transport properties of 3D TIs are determined by carriers in narrowly gapped bulk bands and by gapless surface states protected by the time-reversal symmetry. Although the spin-momentum locking of Dirac electrons increases the conductivity from atomically-thin surface states, its contribution can still be masked by the high density carrier conduction in static transport measurements, at either bulk or interface states, even infilms with tens of nm thickness. Consequently, very few experimental techniques are capable of isolating and studying the intrinsic topological transport on the surface, especially for high Fermi energies. Sophisticated characterization and sample synthesis are involved, e.g., anisotropic magneto-transport by adjusting mag-netic field directions14 and significantly reduced doping and
thickness by thin film engineering20–29. There has been con-siderable progress yet with complications, e.g., limited applic-ability or difficulty in the interpretation. For example, intrinsic Dirac-cones could be contaminated with possible gap opening in very thin samples. The separation of surface and bulk/interface contributions to the static THz conductivity spectra has to rely on reduced doping.
Recently, ultrafast THz conductivity has been shown to be promising by providing time resolution able to distinguish the surface from the bulk responses after suddenly driving the system out-of-equilibrium28,30. However, the high photon frequency pumping at 1.55 eV used so far introduces interband excitations from valence to conduction and other high lying bands at both surface and bulk. Such coupling causes population transfer between surface and bulk bands and enhanced scattering between high-energy states. Selective mid-IR and THz pump-THz probe spectroscopy used in this work represent powerful and versatile tools that allow us to measure and control surface transport in TIs, even for Fermi levelEFinto the bulk bands.
We emphasize several strategic advantages of low frequency pumping scheme like ours, as illustrated in Fig. 1a. First, in
a
b
d c 20
15
10
5
0
248 meV pump
T = 300K
4 3 2 1 0 –1 –2
tgate(ps) 20
15
10
5
0
248 meV pump
T = 5 K –4 –2 0 2
ΔEsample (a.u.) 25
20
15
10
5
0
10 8 6 4
Photon energy (meV) Static, T = 5 K
Exp Fit
–4 –3 –2 –1 0 1
10 8 6 4
Photon energy (meV) Exp Fit
1
(
)(10
–3
Ω
–1)
Δ
tpp
(ps)
Δ
tpp
(ps)
THz
probe Mid-IR& THz
pump
E
EF
Einter
k
1
(
)(10
3)
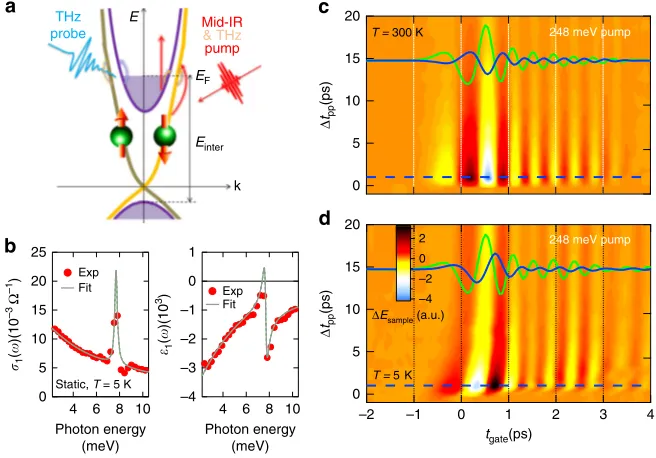
Fig. 1Ultrafast mid-IR/THz pump and THz probe spectroscopy for Bi2Se3.aSchematic of the surface and bulk electronic band structures of the Bi2Se3film
with Fermi level (EF) indicated, illustrating mid-IR/THz intraband excitations and THz conductivity detection.bStatic THz spectra ofσ1(ω) andε1(ω) (red
dots) of the Bi2Se3film atT=5 K. Shown together are the theoreticalfitting (gray lines) using the composite THz model from Eq. (1).c,dA 2D false-color
plot of pump-induced THzfield changesΔEsampleas a function of gate timetgate(horizontal axis) and pump-probe delayΔtpp(vertical axis) after 248 meV
(5μm) photoexcitation of the sample atcT=300 K anddT=5 K, respectively. Plotted together are the corresponding static THzfieldsEsample(tgate)
(green curves) and their pump-induced changesΔEsample(tgate) atΔtpp=1 ps (blue curves, ×5, from the cut positions as marked by the blue-dashed lines),
in order to compare their relative amplitude changes and phase shifts at different temperatures
ARTICLE
NATURE COMMUNICATIONS | https://doi.org/10.1038/s41467-019-08559-6 [image:4.595.134.462.433.662.2]contrast to interband photoexcitation that couples high-energy electronic states between two bands, THz and mid-IR photo-excitation mainly excites intraband transitions nearEF. Here the photon energy is below the insulating bandgap and interband transition energy, which suppresses many other charge transfer channels. This allows measurement of intrinsic scattering rates and strongly constrains thefitting parameters to scattering rates only, as discussed later. Additionally, our time resolution can separate intrinsic surface from bulk conductivity via their dif-ferent hot carrier cooling times, i.e., resolve the issue directly in the time-domain. The extracted spectra fully characterize THz response functions as the complex frequency-dependent con-ductivity. In this way we can determine the intrinsic surface electron scattering rates and their ultrafast dynamics, compli-mentary to commonly used transport14, and photoemission8,16 measurements. Finally, comparison of the conductivity for wavelength-selective photoexcitations below and above the interband transition enabled by tuning the pump photon energy allows the optical control of carrier dynamics of surface and bulk bands in a selective way. However, in contrast to the several interband photoexcitation studies performed in TIs28,30, mid-IR, and THz pump-induced conductivity experiments have not been carried out so far in TIs.
Here we report ultrafast THz charge transport and dynamics in n-type Bi2Se3 that arise from nonequilibrium Dirac surface
and bulk transient states induced by intraband mid-IR and THz photoexcitation. We observe frequency-dependent carrier cooling times of photoinduced THz conductivity that clearly differentiate surface from bulk contributions and allow deter-mination of their scattering rates. We show that the topological enhancement of surface transport suppresses the surface elec-tron scattering rate as compared to the bulk, i.e.,γBS/γSS~3.80
in equilibrium. This result is consistent with surface helical spin transport in the presence of short-range disorder31. Moreover, the clear similarities between mid-IR and THz pumping and their distinct difference from high-photon-energy cases clearly show: (1) ultrafast manipulation of the surface and bulk THz conductivities via wavelength-selective pumping; (2) intraband vs. interband excitation mechanisms driven by low and high-photon-energy pumping. These are distinctly different from any known THz transport measure-ments so far, which have used either high-energy optical fre-quency photoexcitation or only detected time-averaged properties. The intraband, mid-IR/THz-induced THz con-ductivity provides a powerful method for isolating the surface transport channel in TIs—unhindered by complications from interband pumping or high density doping into bulk states. The distinct spectral-temporal characteristics obtained in this way in TIs may be extended to study and understand much broader topological phenomena32.
Results
Frequency-dependent dynamics of THz conductivity spectra. The Bi2Se3thinfilm sample, 50 nm thick, is grown by molecular
beam epitaxy on a 0.5 mm thick sapphire substrate. The static THz conductivity spectra are shown in Fig.1b. The details about THz data analysis, sample preparation, and experimental setup are described in the Methods. We characterize the none-quilibrium THz responses of the Bi2Se3thinfilm by extracting the
real parts of the transient conductivityσ1(ω,Δtpp) and dielectric
functionε1(ω,Δtpp) as a function of both the frequencyωand the
pump-probe delay time Δtpp. These spectra describe the dis-sipative and inductive parts of the response functions of quasi-particles, respectively, and are extracted from raw THzfields in time-domain.
The pump-induced raw THz fields in Fig. 1c, d exhibit a distinctly different temperature dependence. At 300 K, the transmittedfield changeΔEsamplehas a πphase shift relative to the static field Esample without any other frequency- and time-dependent changes. This behavior is characteristic of an absorption-dominated response, i.e., a large increase in σ1(ω).
On the other hand, at low temperatureT=5 K, a large inductive response ε1(ω) appears in addition to the dissipative one, as
manifested by a significant frequency- and time-dependent THz
field reshaping besides the dominantπphase shift as in the 300 K case. These distinct spectral-temporal characteristics give rise to several salient features in the extracted THz response functions Δσ1(ω) andΔε1(ω), shown in Fig.2a–d, that allow us to directly
separate the intrinsic surface and bulk transport contributions to the conductivity from the experimental data withoutfitting.
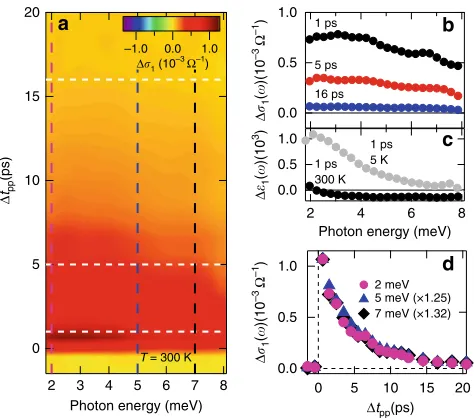
Thefirst feature, shown in Fig.2a, b, is that the pump-induced THz conductivity spectra Δσ1(ω) extracted from the measured
time-dependent THzfields exhibit a clear bipolar behavior with frequency-dependent cooling times under intraband excitation (248 meV) at low temperature (5 K). Specifically, as shown by comparing three time-cut spectra (white-dashed lines in Fig.2b), Δσ1(ω) at early times (Δtpp<5 ps) is characterized by a strong
bleaching, i.e., a negative conductivity change, in the low frequency 2–3 meV range. This changes to a strong absorption, i.e., positive conductivity change, towards high frequencies up to ~7 meV, as seen in the 1 ps trace (black dots in Fig. 2a). At Δtpp>5ps, the low frequency bleaching has quickly diminished, and the transient spectra are dominated by the high frequency absorption with longer cooling times, e.g., as shown in the 5.4 ps (red dots) and 15.4 ps (blue dots) traces. The frequency cuts of the Δσ1(ω) spectra from Fig.2b are summarized in Fig.2e (atω=2
meV) and2f (atω=7 meV) (black dots) as a function ofΔtpp. Clearly, the cooling times depend on the probe frequency, i.e., the faster (slower) cooling for ultrafast THz conductivity change at low (high) frequency. The characteristic cooling time for the 2 meV probe isτSS=1.48 ± 0.14 ps, significantly shorter than that
for the 7 meV probeτBS=5.30 ± 0.18 ps (the uncertainty is from
single exponential fitting). Such a frequency-dependent decay of THz electron transport is consistent with the significant THz pulse reshaping seen in Fig.1d, which indicates more than one cooling channel of hot electrons.
Second, to understand these experimental results, we compare them with prior ultrafast THz responses from photoexcited Bi2Se3
samples. A decrease in their thickness has been shown to induce a transition to a surface-like, pronounced bleaching behavior that differs from a bulk-like, absorption one30. The latter is expected
from the ionized impurity scattering in the bulk, which decreases scattering rate after pumping at low temperatures33and gives rise
to a positive Δσ1(ω) towards zero frequency (see below for
details). Therefore our results show that THz transport and dynamics of surface and bulk fermions can be selectively separated in time and measured by tuning probe frequency. Most intriguingly, upon closer scrutiny, the time-dependent scattering rates of surface Dirac (red line) and bulk (green line) fermions in Fig. 2e, f match very well with the conductivity dynamics at 2 meV and 7 meV, respectively. These scattering rates are extracted byfitting the time-dependent conductivity data as discussed later. This clearly shows that the experimentally obtainedΔσ1(ω) probed at 2 meV can be used to directly measure
surface transport dynamics, distinctly different from bulk conduction (at 7 meV), without reference to theoretical models. In between 2 and 7 meV, Δσ1(ω) dynamics consist of mixed
cooling time, as shown in Fig. 3. Strikingly, this high-temperature behavior is opposite to the low-high-temperature conductivity responses in Fig. 2. This is consistent with the different, raw THz fieldsΔEsample between T=5 K and 300 K seen in Fig. 1c, d. Specifically, the pump-induced Δσ1(ω)
spectra at 300 K, shown as 2D false-color plot in Fig.3a, are all positive,Δσ1(ω) > 0, without the negative bleaching component
over the measured time and spectral range. Particularly,Δσ1(ω)
has similar amplitude at 5 K and 300 K as shown in Figs.2a and 3b, but Δε1(ω) at 300 K is decreased to approximately one
order of magnitude smaller than its counterpart at 5 K, as shown in Figs.2c and3c (see also the Supplementary Note 1). This indicates large photoinduced conductive response in comparison with inductive one at the elevated temperature. Since phonon-mediated coupling and charge transfer between surface and bulk are activated above the Debye temperature at 182 K15, the dominance of positive Δσ
1(ω) at 300 K is
consistent with our conclusion that the bulk transport and surface-bulk charge transfer dominate at high temperatures and lead to the induced absorption. This suppresses the induced bleaching from the surface seen at 5 K in Fig.2a. On the other hand, the frequency-dependent cooling times previously seen at 5 K are no longer present at the elevated temperature. As shown in Fig. 3d the THz conductivities Δσ1(ω) at ω=2, 5, and 7 meV as a function of pump-probe
delayΔtpp, now decay with the same time at 300 K. The cooling time of ~4.8 ps is similar to the bulk state cooling time τBS
observed at 5 K. These observations corroborate again our claim that the low frequency conductivity at 2 meV, with faster cooling time observed at 5 K, comes from surface transport that is separated from the bulk channel. Furthermore, these distinct differences between high and low temperatures in ultrafast charge transport suggest that surface-bulk charge transfer in TIs is suppressed at low temperature.
20 15 10 5 0 1.0 0.5 0.0 2 meV 5 meV (×1.25) 7 meV (×1.32) 1.0 0.5 0.0 1 ps 5 ps 16 ps 20 15 10 5 0 8 7 6 5 4 3 2
Photon energy (meV) T = 300 K –1.0 0.0 1.0
1.0 0.5 0.0 8 6 4 2
Photon energy (meV) 1 ps 5 K 1 ps 300 K a b c d Δ tpp (ps)
Δ1 (10 –3 Ω–1 ) Δ 1 ( )(10 –3 Ω –1) Δ 1 ( )(10 –3 Ω –1 ) Δ 1 ( )(10 3)
Δtpp(ps)
Fig. 3Frequency-independent dynamics of THz spectra at high
temperature.aPump-induced THz spectra ofΔσ1(ω) after 248 meV (5μm)
photoexcitation withfluence 12μJ cm−2atT=300 K as a function of pump-probe delayΔtpp.bTHz conductivityΔσ1(ω) from three cut positions
froma, atΔtpp=1, 5, 16 ps, as indicated by the white-dashed lines.cTHz
spectra ofΔε1(ω) atΔtpp=1 ps for 5 K (gray dots) and 300 K (black dots),
the amplitude of which is much smaller at high temperature, opposite to low temperature ones in Fig.2c, d.dThe comparison of THz conductivity Δσ1(ω) at three frequencies: 2, 5, and 7 meV, as a function ofΔtpp(scaled
to match amplitude), from three frequency-cut positions fromaas indicated by magenta, blue, and black dots, respectively. The frequency-independent relaxation dynamics ofΔσ1(ω) indicates the strong coupling of
surface and bulk states that make them decay together at high temperature
Δ1 (2 meV)
Δ1 (7 meV) γSS γBS –1 0 1 ps 5.4 ps 15.4 ps 1 ps 5.4 ps 15.4 ps 15 10 5 0 7 6 5 4 3 2
Photon energy (meV) T = 5 K –1 0 1
7 6 5 4 3 2
Photon energy (meV)
1 0
T = 5 K 1 0 0.6 0.4 0.2 0.0 30 20 10 0 3.1 3.0 2.9 2.8 –1.0 –0.5 0.0 1.3 1.2
Scattering rate (THz)
1.1 1.0 0.9 0.8 a b c d e f Δ 1 ( )(10 –3 Ω –1 ) Δ 1 ( )(10 –3 Ω –1) Δ 1 ( )(10 –3 Ω –1) Δ 1 ( )(10 3) Δ tpp (ps)
Δtpp(ps) Δ1 (10
–3 Ω–1) Δ
1 (10 3)
Fig. 2Frequency-dependent dynamics of THz spectra at low temperature. Pump-induced THz spectra ofa,bΔσ1(ω) andc,dΔε1(ω) after 248 meV (5μm)
photoexcitation withfluence 12μJ cm−2atT=5 K as a function of pump-probe delayΔtpp.aandcshow the THz spectra from three cut positions from the
corresponding 2D plots ofbandd, respectively, atΔtpp=1, 5.4, and 15.4 ps, as indicated by the white-dashed lines.eTHz conductivity at 2 meV, i.e.,
Δσ1(2 meV) (black dots, left axis), as a function ofΔtpp, from the frequency-cut position inbas indicated by the red-dashed line. The scattering rate of the
surface stateγSS(red curve, right axis) obtained from theoreticalfitting using Eq.1is plotted together to compare relaxation dynamics.fSimilar toe, THz
conductivity at 7 meV,Δσ1(7 meV) (black dots, left axis) and the scattering rate of bulk stateγBS(green curve, right axis) are plotted.Δσ1(7 meV) is from
the frequency-cut position inbas indicated by the green-dashed line. As shown clearly, the relaxation dynamics of the surface (bulk) scattering rate matches with that of THz conductivity at 2 meV (7 meV) very well. This frequency-dependent THz relaxation dynamics indicates surface (bulk) state is more sensitive to low (high) THz frequency
ARTICLE
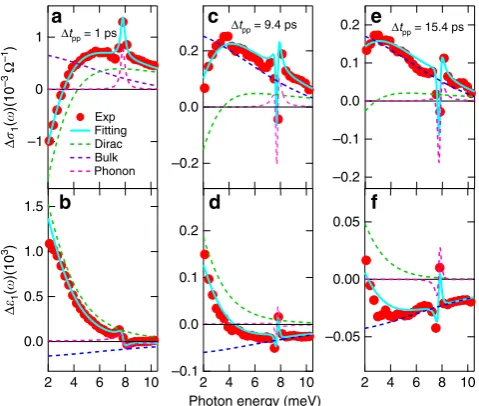
NATURE COMMUNICATIONS | https://doi.org/10.1038/s41467-019-08559-6 [image:6.595.122.479.49.270.2] [image:6.595.50.287.387.596.2]THz spectra analysis andfitting. To put these physical pictures on a strong footing, we quantitatively simulate the experimentally determined THz response functions Δσ1(ω) and Δε1(ω). By
extracting the temporal evolution of surface and bulk con-ductivity spectra, we obtain the intraband scattering rates and ultrafast dynamics of both Dirac (red line) and bulk (green line) fermions, as presented in Fig. 2e, f, respectively. A theoretical model consisting of contributions with Drude and Lorentzian lineshapes is used to reproduce the measured THz response functions. Specifically, two Drude terms account for surface state (SS) and bulk state (BS) plus one phonon oscillator centered at ω0~ 7.7 meV (1.9 THz),
~εðωÞ ¼ X j¼SS;BS
~εDrude
j ðωÞ þεphðωÞ ¼ε1
X
j¼SS;BS ðωpÞ2j
ω2þiωγ
j
þ F
ðω0Þ2ω2iωΓ
;
ð1Þ
whereε∞is the background electrical permittivity and the plasma
frequency ðω2
pÞj¼ne2=ε0m is proportional to the density of
charge carriers of surface (nSS, j=SS) and bulk (nBS, j=BS) electrons.ωandeare the frequency and electron charge.ε0and m* are the vacuum electrical permittivity and carrier effective mass.γjis the scattering rate of surface (j=SS) and bulk (j=BS) carriers. In the last term of Eq.1,Fdenotes the effective transition strength of the optical phonon with resonance frequencyω0and
scattering rateΓ. Such a composite THz response model provides an excellent agreement with the pump-induced transient THz spectra over the entire measured pump-probe delays and spectral range as shown in Fig.4(cyan lines). Suchfit is achieved by only varying the scattering ratesγof surface and bulk carriers, i.e., the charge carrier densities of surface (nSS) and bulk (nBS) states remain constant in the fits. Please also note that the optical phonon resonance ~7.7 meV is fitted by F, ω0, and Γ of the
Lorentzian oscillator, which only affects locally the feature near
the resonance. Examples of typical fits are shown in Fig. 4 at various time delays,Δtpp=1 ps, 9.4 ps, and 15.4 ps. The modelfit (cyan lines) is divided into the sum of the surface (green-dashed lines), bulk (blue-dashed lines), and phonon (magenta-dashed lines) responses. Detailed fitting parameters are listed in the Supplementary Note 5.
We like to emphasize three key observations from the quantitative fitting. First, while the static THz spectra, shown in Fig.1b, can be fitted equally well with either single or multiple Drude components, the transient THz spectra, shown in Fig. 4, can only be fitted by the two-Drude model. This is the case because the strong constraint imposed by the requirement to simultaneously describe both the conductivity Δσ1(ω) and the
dielectric function Δε1(ω) over broad temporal and spectral
ranges, shown in Fig.2a–d, instead of justfitting the lineshape as in the static case. Second, an even stronger constraint comes from the intraband, mid-IR/THz excitation scheme that most likely conserves the number of surface and bulk quasi-particles after the photoexcitation, i.e., carrier densities of both surface and bulk states are kept constant in the fitting, ΔnSS=0 and ΔnBS=0 (more details and discussions in Fig. 5). Remarkably, by simply varying the surface and bulk scattering rates we are able to consistently reproduce the experimental results, as shown in Fig. 4, and extract the scattering rates (or inverse transport lifetimes that should not be confused with hot carrier cooling times)γSS(red line),γBS(green line), and their cooling dynamics
in Fig.2e, f. On theflip side, this excellent agreement implies that mid-IR/THz photoexcitation creates a unique nonequilibrium state of hot, yet mostly conserved, Dirac fermions and bulk carriers in their respective bands. Third, the equilibrium surface and bulk scattering rates, γSS and γBS extracted before the
photoexcitation, are 0.84 THz and 3.18 THz, respectively, which reveal an enhancement ratio,γBS/γSS~3.8. Remarkably, this value
matches very well with the topological enhancement factor, 4, for protected, helical spin transport of non-interacting fermions in the presence of short-range disorder such as structural defects and surface or interface roughness. In the presence of long range, Coulomb disorder, this enhancement decreases from 4 to 2 due to increase of screening31. Furthermore, as shown in Fig.2e, f, the
scattering rates of the surface Dirac and bulk fermions nearly coincide with the frequency-dependent decay of Δσ1(ω) for 2
meV and 7 meV probe, respectively. This corroborates again that tuning the THz probe frequency under mid-IR/THz pump can be used to disentangle the distinct symmetry-protected transport from the bulk conduction and measure their dynamics without reference to theoretical models. In between 2 and 7 meV, it consists of competing responses from surface and bulk, e.g., Δσ1(ω) at 3 meV consists of THz conductivity contributions from
both states with a similar strength.
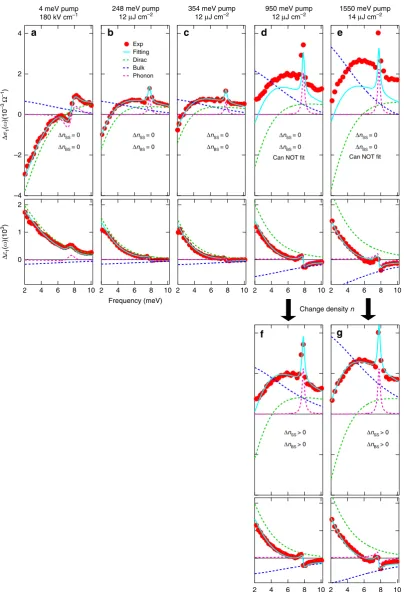
Wavelength-selective pumping from THz to visible. Figure 5 highlights ultra-broadband, wavelength-selective pumping that extends from THz and mid-IR to near-IR and visible. This data show that our THz conductivities following 4 meV (Fig.5a) and 248 meV (Fig.5b) pump have similar bipolar lineshape. In con-trast, high-pump photon energy, e.g., 950 meV (Fig. 5d) and 1550 meV (Fig.5e), show an overall positive conductivity change down to 2 meV. The clear similarities between mid-IR and THz pumping and their distinct difference vs. high-energy pumping allow us to distinguish two excitation channels, i.e., intraband (interband) excitations with low (high) photon energy pumping. Importantly, the data obtained for THz and mid-IR pumping can be well-fitted without changing carrier densities. In sharp con-trast, the data for high-photon-energy pumping cannot befitted in this way. Specifically, our goodfittings obtained in Fig.5a, b –1
0
1 Δtpp = 1 ps Δtpp = 9.4 ps Δtpp = 15.4 ps
Exp Fitting Dirac Bulk Phonon 1.5 1.0 0.5 0.0 10 8 6 4 2 0.2 0.0 –0.2 0.2 0.1 0.0 –0.1 10 8 6 4 2
Photon energy (meV) 0.2 0.1 0.0 –0.1 –0.2 –0.05 0.00 0.05 10 8 6 4 2 a b c d e f Δ 1 ( )(10 –3 Ω –1 ) Δ 1 ( )(10 3)
Fig. 4Theoreticalfitting of the pump-induced THz spectra.a,bThefitting
ofΔσ1(ω) andΔε1(ω) for 248 meV (5μm) photoexcitation withfluence
12μJ cm−2atT=5 K and pump-probe delayΔtpp=1 ps. The experimental
results (red dots) arefitted very well by the THz model from Eq.1(cyan lines), which consists of three individual components, i.e., the Dirac surface state (green-dashed lines), bulk state (blue-dashed lines), and optical phonon mode (pink-dashed lines). Thefitting results forc,dΔtpp=9.4 ps
ande,fΔtpp=15.4 ps are plotted in the same manner asa,b
[image:7.595.54.290.184.235.2] [image:7.595.50.290.445.648.2]Exp Fitting Dirac Bulk Phonon
10 8 6 4 2 2
1
0
10 8 6 4 2 4
2
0
–2
–4
Δ
1
(
)(10
–3
Ω
–1)
Δ
1
(
)(10
3)
ΔnSS = 0 ΔnBS = 0
ΔnSS = 0 ΔnBS = 0
ΔnSS = 0 ΔnBS = 0
ΔnSS = 0 ΔnBS = 0
ΔnSS = 0 ΔnBS = 0
ΔnSS > 0 ΔnBS > 0 ΔnSS > 0
ΔnBS > 0 Frequency (meV)
10 8 6 4 2
Can NOT fit
10 8 6 4 2 10
8 6 4 2 248 meV pump
12 μJ cm–2 354 meV pump12 μJ cm–2 1550 meV pump14 μJ cm–2
10 8 6 4 2
Can NOT fit 950 meV pump
12 μJ cm–2
10 8 6 4 2 4 meV pump
180 kV cm–1
a b c e
f g
d
Frequency (meV) Change density n
Fig. 5Ultrafast THz spectra by wavelength-selective pump from THz to visible. THz spectra for several pump photon energies:a4 meV,b248 meV,
c354 meV,d–f950 meV, ande,g1550 meV atΔtpp=1 ps. Figures forΔσ1andΔε1have the samexandyaxis ranges, respectively, for fair comparison.
The THz spectra fora4 meV,b248 meV, andc354 meV pump can befitted well by keeping the SS and BS carrier densities constant (ΔnSS=0 andΔnBS
=0) and only changing the scattering rates of SS and BS. However, the THz spectra cannot befitted in the same way ford950 meV ande1550 meV pump. Instead, they have to befitted by changing both the carrier densities (ΔnSS> 0 andΔnBS> 0) and the scattering rates of SS and BS, as shown in
fandg
ARTICLE
NATURE COMMUNICATIONS | https://doi.org/10.1038/s41467-019-08559-6 [image:8.595.98.503.46.639.2]indicate that the pump-induced bulk components (dashed blue lines) have nearly identical amplitude and lineshape. This implies that the bulk responses following 4 meV and 248 meV pump are very similar, which indicate a possible transition from filled surface to empty bulk states following 248 meV pump cannot be a major channel, or at least any such contribution is much smaller in our probed THz spectral region than the main intraband sig-nals. Additionally, it is fully consistent that the negative surface response (dashed green lines) is greater following 4 meV pump than 248 meV and 354 meV pump (still below but closer to the bulk bandgap) in the linear Dirac dispersion. In strong contrast, for high-photon-energy pumping we can see that the THz con-ductivities are positive in the probe range and much larger. Importantly, they cannot be fitted by the model with conserved carrier density any more, see Fig.5d, e. Instead, they can befitted decently only withΔnSS> 0 andΔnBS> 0, as shown in Fig.5f, g. Their bulk (dashed blue lines) and surface (dashed green lines) components are both larger than their counterparts following low energy pump, which gives the overall positive THz conductivity change in the probed range, indicative of the bulk-dominant response. Moreover, please note that the fittings are faithful, because it only needs to change two scattering rates, which leads to distinctly different THz lineshapes that uniquely converge. We also rule out the possibility that two different sets of scattering rates, which differ from each other by >2%, canfit the same data. These results clearly demonstrate the control of THz conductivity by ultra-broadband, wavelength-selective pumping from THz to visible.
Discussion
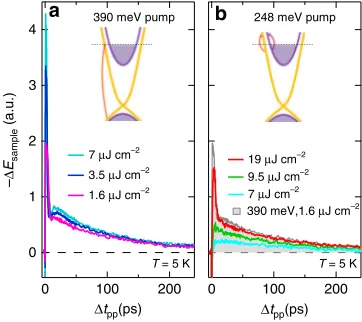
To highlight the difference between the intraband excitation scheme used in this work and the interband excitation found in previous literature, Fig.6a, b compare the ultrafast THz dynamics under 390 meV (3.18μm) and 248 meV (5μm) pumping, respectively. The former resonantly excites interband transitions in our bulk Bi2Se3sample (Fig.1a). Here, for simplicity, we show
the THzfield changeΔEsamplebyfixing the gate timetgateat the peak of the static THz field as a function of pump-probe delay Δtpp, similar to previous studies28,30. Unlike the above-obtained frequency-dependent conductivity Δσ1(ω) dynamics that closely
follows the pump-induced change of surface/bulk scattering rates, ΔEsamplemeasured at afixed gate time originates from frequency-integrated responses within the measured spectral range ~2–10 meV. This frequency average leads to more complicated dynamics that may come from all relaxation channels of opposite signs as shown in Fig.2. Nevertheless, Fig.6shows that there is still a distinct difference between the interband (Fig. 6a) and intraband (Fig.6b) pump excitation schemes. On the one hand, with resonant interband pump excitation at 390 meV (inset, Fig.6a),ΔEsampleat several pumpfluences shows two main decay features: (1) a dominant, fast overshoot, which exhibitsfl uence-dependent amplitude and quickly diminishes within ~4 ps; (2) a slow, hundreds of ps component, which is fluence independent, i.e., the ΔEsamplefor allfluences merge and decay together after ~100 ps. On the other hand, with intraband excitation at 248 meV (inset, Fig.6b), the fast overshoot component is absent in the THz responses at lowfluences≤12μJ cm−2, thefluence used for
mid-IR pumping in Figs. 1–4. A distinct difference is clearly visible between interband and intraband pumping with lowfluence, e.g., the 7μJ cm−2(cyan) and 9.5μJ cm−2(green) traces. Interestingly,
increasing the mid-IR pump fluence to 19μJ cm−2 (red line in Fig. 6b) leads to a transition to a decay profile, where a fast overshoot component now appears similar to the interband photoexcitation, e.g., the 390 meV excitation scan at 1.6μJ cm−2 (pink line in Fig.6a). For a better comparison, this pink curve is also plotted in Fig.6b as afilled gray curve, which resembles the 248 meV excitation scan at 19μJ cm−2, unlike for the lower fl u-ences. This reveals the same relaxation mechanism between the two, which can be attributed to the two photon absorption (TPA) present in the high fluence, mid-IR pumping case. This excites interband transitions in our sample in spite of below gap pump photon energy. The dynamics of Bi2Se3 under
high-photon-energy pumping have been extensively studied recently and the few ps relaxation component is mainly from bulk-surface charge transfer and/or decay that can give the overshoot feature after interband carrier injection16. The absence of such process in the
mid-IR pumping below ~12μJ cm−2 is consistent with the intraband excitation channel and its similarity with THz (few meV) pumping.
Although the optical transition from filled surface state to empty bulk state with 248 meV mid-IR pump is potentially allowed, our results show that the relative strength of this channel and its contribution to the THz conductivity are, however, still an open question. The similarity between THz (few meV) and mid-IR pump implies that this channel is relatively weak for THz and mid-IR pumping when compared to the intraband excitation channel, unlike in the case of optical pump, which warrants further studies. In addition, our fitting is faithful because it only needs to change two parameters, which are the two time-dependent scattering rates directly seen in distinctly different time-resolved THz lineshapes. Since the fitting result is already uniquely converging with the two fitting parameters, additional parameters only relax the constraint and add uncertainty, which is hard to be physically meaningful. The mid-IR/THz pump spectroscopy experiment like ours reveals ultrafast manipulation of surface and bulk THz conductivity via wavelength-selective pumping and underpin the difference of intraband vs. interband pumping, shown in Fig.5, without reference to any model and/or assumption forfitting. The observation of frequency-dependent hot carrier cooling times is shown in Fig. 2a–d, which directly distinguish the faster surface channel from the slower bulk in the raw data. These ultrafast conductivity dynamics of surface states are absent in the prior static THz and time-averaged probes.
Finally, we note that the assignment of THz conductivity of these two decay channels is justified by the distinctly different THz spectrum lineshapes and dynamics of the surface and bulk states,
a b
4
3
2
1
0
–
Δ
Esampl
e
(
a
.u.)
200 100 0
Δtpp(ps) Δtpp(ps) 7 μJ cm–2
3.5 μJ cm–2
1.6 μJ cm–2
390 meV pump
T = 5 K
200 100 0
248 meV pump
T = 5 K 19 μJ cm–2
9.5 μJ cm–2 7 μJ cm–2 390 meV,1.6 μJ cm–2
Fig. 6Ultrafast THz dynamics under interband and intraband
photoexcitations. Pump-induced THzfield changesΔEsampleas a function of
pump-probe delayΔtppaftera390 meV (3.18μm) andb248 meV (5μm)
photoexcitations at variousfluences andT=5 K. The gate timetgateisfixed
at the peak of the static THzfield shown in Fig.1d. One of the THz traces froma(pink curve, 1.6μJ cm−2) is also plotted inbas afilled gray curve for better comparison
[image:9.595.77.258.499.660.2]respectively. First, only the TI surface state could give rise to a photoexcited negative THz conductivity in Fig. 2e and intraband decay of Dirac spectrum at the surface is much faster than the bulk. Second, the other channel, i.e., photoexcited positive THz con-ductivity that we have assigned to bulk in Fig.2f, exhibits a decrease in the scattering rate. This is well explained by the reduced ionized impurity scattering which leads to a decrease in scattering rate and an increase in THz conductivity at low frequency after photo-excitation. Third, a decrease in Bi2Se3thickness has been shown to
induce a transition from a bulk-like, positive conductivity to a surface-like, negative THz conductivity30.
In conclusion, we have provided the measurement and insights into the intraband, mid-IR, and THz pump-induced quantum transport in TIs. We achieve this by suppressing all interband transitions that mask the processes of main interest. The con-clusions from this advanced spectroscopy are the demonstration of another tuning knob for both controlling THz conductivity and isolating the surface contribution from the bulk contribution, by using low photon energy pumping and comparing them to optical pumping. This scheme enables a clear observation of enhanced surface transport, which provides evidence for helical spin structure of surface (Dirac) electrons that suppresses back-scattering. The pump photon energy tuning achieved in this way also allows us to control the surface transport optically in a selective way. Our experiments may evolve into a benchmark characterization method for high frequency topological transport in TI-based device development, and motivate fundamental quantum phase discovery and control at the boundaries of topology, magnetism34, and other broken symmetry states35–37.
Methods
Experimental schemes. Our mid-IR/THz pump and THz probe spectrometer is
driven by a 1 kHz Ti:sapphire regenerative amplifier, which has 800 nm central wavelength and 40 fs pulse duration38. The majority of the output is used to
pump either an optical parametric amplifier to generate mid-IR pulses tunable from 3–15μm (or 83–413 meV) or a lithium niobate crystal to generate strong THz pulses centered at 4 meV39allowing for selective intraband and interband
photo-excitation. The other part of the output is used to generate and detect phase-locked THz electricfields in time-domain via optical rectification and electro-optic sam-pling in a 1 mm thick ZnTe crystal, respectively. THzfields with a bandwidth from 0.5 to 2.5 THz (2.1–10.3 meV) are used as a probe beam. The measurement scheme is briefly illustrated in Fig.1a, in which mid-IR (red) or THz (yellow) pump photoexcites the sample and THz pulse (light blue) probes photoinduced responses of the sample. The transmitted THz probe containing spectral amplitude and phase information of the sample is directly measured in time-domain using an optical gate pulse. The setup is enclosed in a N2gas purge box.
Sample preparation and characterization. The Bi2Se3thinfilm sample, 50 nm
thick, is grown by molecular beam epitaxy on a 0.5 mm thick sapphire substrate. The sample is mounted together with a 0.5 mm thick pure sapphire substrate, used as a reference, into a cryostat with temperatures down toT=5 K. Two copper mounts with the same aperture are placed directly in front of the sample and reference to ensure uniform photoexcitation and accurate comparison of their THz transmission.
The sample studied has a Fermi energyEF~ 60 meV from the bulk conduction
band edge (Fig.1a), as estimated from the measured plasma frequency in the static THz conductivity spectra shown in Fig.1b. The gray lines are theoreticalfittings that are discussed in Results. The estimated Fermi energy is consistent with the difference between the separately measured, interband optical transition onset
Einter~ 390 meV using our wavelength-dependent pump-induced THzfield change
data (see Supplementary Note 1) and the bulk insulating bandgapEg~ 332 meV,
which yields a similarEF=Einter−Eg~ 58 meV. Please note that the exact value of
the gap size is not critical for our scheme, nor does it change our conclusion, as long as the interband transition gap in our sample is larger than our pump photon energy, e.g., 4 meV and 248 meV used.
THz data analysis. Raw THzfield transients are measured as a function of gate
timetgateafter transmission through (i) the reference bare substrateEref(tgate), (ii)
the unexcited sampleEsample(tgate), and (iii) as pump-induced changeΔEsample
(tgate,Δtpp) at pump-probe delayΔtpp. Figure1c,d shows the 2D false-color plots of
ΔEsample(tgate,Δtpp) after below gap photoexcitation at 248 meV (5μm) for high
(300 K) and low (5 K) temperatures, respectively. Also plotted in the abovefigures are the correspondingEsample(tgate) (green curves) and pump-induced change
ΔEsample(tgate) atΔtpp=1 ps (blue curves). For the unexcited sample, through the
fast Fourier transformation and Fresnel equation, the static THz conductivity, shown in Fig.1b, is directly obtained from the experimentally measured complex transmission coefficient~tðωÞwith spectral amplitude and phase information extracted by comparing thefields transmitted through sample and reference, i.e.,
~
tðωÞ ¼EsampleðωÞ=ErefðωÞ, similar to the method reported in ref.29(see also
Supplementary Note 5). For the excited sample atΔtpp, the complex transmission
coefficient is obtained by~texcitedðωÞ ¼ ½ΔEsampleðωÞ þEsampleðωÞ=ErefðωÞand is
used to extract the photoexcited transient THz conductivity. Afterwards, the pump-induced conductivity changeΔσ~ðωÞ ¼~σexcitedðωÞ ~σðωÞis calculated. The
corresponding dielectric function can be calculated by the equation
~
σðωÞ ¼i½1~εðωÞωε0. The simultaneously obtained real parts of transient
con-ductivity changeΔσ1(ω) and dielectric function changeΔε1(ω) as a function ofΔtpp
are presented in the study, which allow us to quantitatively describe the ultrafast dynamic evolution of the photoexcited Dirac and bulk fermions and their intrinsic scattering processes.
Data availability
The data that support thefindings of this study are available from the corresponding author upon reasonable request.
Received: 28 April 2018 Accepted: 18 January 2019
References
1. Hsieh, D. et al. A topological Dirac insulator in a quantum spin Hall phase.
Nature452, 970 (2008).
2. Zhang, H. et al. Topological insulators in Bi2Se3, Bi2Te3and Sb2Te3with a
single Dirac cone on the surface.Nat. Phys.5, 438 (2009).
3. Moore, J. E. The birth of topological insulators.Nature464, 194 (2010). 4. Hasan, M. Z. & Kane, C. L. Colloquium: topological insulators.Rev. Mod.
Phys.82, 3045 (2010).
5. Qi, X.-L. & Zhang, S.-C. The quantum spin Hall effect and topological insulators.Phys. Today63, 33 (2010).
6. Koirala, N. et al. Record surface state mobility and quantum hall effect in topological insulator thinfilms via interface engineering.Nano. Lett.15, 8245 (2015).
7. Bowlan, P. et al. Probing and controlling terahertz-driven structural dynamics with surface sensitivity.Optica4, 383 (2017).
8. Hsieh, D. et al. A tunable topological insulator in the spin helical Dirac transport regime.Nature460, 1101 (2009).
9. Wu, C., Bernevig, B. A. & Zhang, S.-C. Helical liquid and the edge of quantum spin hall systems.Phys. Rev. Lett.96, 106401 (2006).
10. Kane, C. L. & Mele, E. J. Z2topological order and the quantum.Phys. Rev.
Lett.95, 146802 (2005).
11. Moore, J. E. & Balents, L. Topological invariants of time-reversal-invariant band structures.Phys. Rev. B75, 121306(R) (2007).
12. Zyuzin, A. A. & Burkov, A. A. Topological response in Weyl semimetals and the chiral anomaly.Phys. Rev. B86, 115133 (2012).
13. Bravyi, S., Hastings, M. B. & Verstraete, F. Lieb-Robinson bounds and the generation of correlations and topological quantum order.Phys. Rev. Lett.97, 050401 (2006).
14. Qu, D.-X., Hor, Y. S., Xiong, J., Cava, R. J. & Ong, N. P. Quantum oscillations and hall anomaly of surface states in the topological insulator Bi2Te3.Science 329, 821 (2010).
15. Wang, Y. H. et al. Measurement of intrinsic dirac fermion cooling on the surface of the topological insulator Bi2Te3using time-resolved and
angle-resolved photoemission spectroscopy.Phys. Rev. Lett.109, 127401 (2012).
16. Sobota, J. A. et al. Ultrafast optical excitation of a persistent surface-state population in the topological insulator Bi2Se3.Phys. Rev. Lett.108, 117403
(2012).
17. Giorgianni, F. et al. Strong nonlinear terahertz response induced by Dirac surface states in Bi2Se3topological insulator.Nat. Commun.7, 11421 (2016).
18. Kuroda, K., Reimann, J., Güdde, J. & Höfer, U. Generation of transient photocurrents in the topological surface state of Sb2Te3by direct optical
excitation with midinfrared pulses.Phys. Rev. Lett.116, 076801 (2016). 19. Iyer, V., Chen, Y. P. & Xu, X. Ultrafast surface state spin-carrier dynamics in
the topological insulator Bi2Te2Se.Phys. Rev. Lett.121, 026807 (2018).
20. Valdés Aguilar, R. et al. Terahertz response and colossal Kerr rotation from the surface states of the topological insulator Bi2Se3.Phys. Rev. Lett.108,
087403 (2012).
21. Wu, L. et al. Quantized Faraday and Kerr rotation and axion electrodynamics of a 3D topological insulator.Science354, 1124 (2016).
ARTICLE
NATURE COMMUNICATIONS | https://doi.org/10.1038/s41467-019-08559-622. Zhang, Y. et al. Crossover of the three-dimensional topological insulator Bi2Te3to the two-dimensional limit.Nat. Phys.6, 584 (2010).
23. Linder, J., Yokoyama, T. & Sudbø, A. Anomalousfinite size effects on surface states in the topological insulator Bi2Te3.Phys. Rev. B80, 205401 (2009).
24. Liu, C.-X. et al. Oscillatory crossover from two-dimensional to three-dimensional topological insulators.Phys. Rev. B81, 041307(R) (2010). 25. Lu, H.-Z., Shan, W.-Y., Yao, W., Niu, Q. & Shen, S.-Q. Massive Dirac fermions
and spin physics in an ultrathinfilm of topological insulator.Phys. Rev. B81, 115407 (2010).
26. Okada, K. N. et al. Terahertz spectroscopy on Faraday and Kerr rotations in a quantum anomalous Hall state.Nat. Commun.7, 12245 (2016).
27. Dziom, V. et al. Observation of the universal magnetoelectric effect in a 3D topological insulator.Nat. Commun.8, 15197 (2017).
28. Valdés Aguilar, R. et al. Time-resolved terahertz dynamics in thinfilms of the topological insulator Bi2Se3.Appl. Phys. Lett.106, 011901 (2015).
29. Wu, L. et al. A sudden collapse in the transport lifetime across the topological phase transition in (Bi1−xInx)2Se3.Nat. Phys.9, 410 (2013).
30. Sim, S. et al. Ultrafast terahertz dynamics of hot Dirac-electron surface scattering in the topological insulator Bi2Se3.Phys. Rev. B89, 165137 (2014).
31. Ozturk, T. et al. Influence of helical spin structure on the magnetoresistance of an ideal topological insulator.J. Phys. Commun.1, 035005 (2017). 32. Yan, B. & Felser, C. Topological materials: Weyl semimetals.Annu. Rev.
Condens. Matter Phys.8, 337 (2017).
33. Chattopadhyay, D. & Queisser, H. J. Electron scattering by ionized impurities in semiconductors.Rev. Mod. Phys.53, 745 (1981).
34. Wang, J. et al. Ultrafast softening in InMnAs.Phys. E20, 412 (2004). 35. Yang, X. et al. Non-equilibrium pair breaking in Ba(Fe1−xCox)2As2
superconductors: evidence for formation of photo-induced excitonic spin-density-wave state.Phys. Rev. Lett.121, 267001 (2018).
36. Patz, A. et al. Critical speeding up of nonequilibrium electronic relaxation near nematic phase transition in unstrained Ba(Fe1−xCox)2As2.Phys. Rev. B95,
165122 (2017).
37. Patz, A. et al. Ultrafast observation of critical nematicfluctuations and giant magnetoelastic coupling in iron pnictides.Nat. Commun.5, 3229 (2014).
38. Luo, L., Chatzakis, I., Patz, A. & Wang, J. Ultrafast terahertz probes of interacting dark excitons in chirality-specific semiconducting single-walled carbon nanotubes.Phys. Rev. Lett.114, 107402 (2015).
39. Yang, X. et al. Terahertz-light quantum tuning of a metastable emergent phase hidden by superconductivity.Nat. Mater.17, 586 (2018).
Acknowledgements
This work was supported by the U.S. Department of Energy, Office of Basic Energy Science, Division of Materials Sciences and Engineering (Ames Laboratory is operated for
the U.S. Department of Energy by Iowa State University under Contract No. DE-AC02-07CH11358) (science driver, THz spectroscopy experiment and theory). Sample devel-opment was supported by National Science Foundation DMR 1400432. Terahertz spectroscopy instrument was supported in part by National Science Foundation EECS 1611454. Additional analysis by I.E.P and M.M was supported by the U.S. Department of Energy, Office of Science, Basic Energy Sciences under Award #DE-SC0019137.
Author contributions
L.L. and X.Y. performed the experimental measurements and collected the data. They analysed the results and developed the model with the help of J.W., Z.L., C.V., D.C., M.M., X.Z., Y.Y., C.Z.W., K.M.H. and I.E.P. Thinfilm growth and basic characterizations are done by X.L., M.D. and J.K.F. at University of Notre Dame. J.W. and L.L. wrote the paper with help from all authors. J.W. supervised the study.
Additional information
Supplementary Informationaccompanies this paper at https://doi.org/10.1038/s41467-019-08559-6.
Competing interests:The authors declare no competing interests.
Reprints and permissioninformation is available online athttp://npg.nature.com/ reprintsandpermissions/
Journal peer review information:Nature Communicationsthanks the anonymous reviewers for their contribution to the peer review of this work.
Publisher’s note:Springer Nature remains neutral with regard to jurisdictional claims in published maps and institutional affiliations.
Open Access This article is licensed under a Creative Commons Attribution 4.0 International License, which permits use, sharing, adaptation, distribution and reproduction in any medium or format, as long as you give appropriate credit to the original author(s) and the source, provide a link to the Creative Commons license, and indicate if changes were made. The images or other third party material in this article are included in the article’s Creative Commons license, unless indicated otherwise in a credit line to the material. If material is not included in the article’s Creative Commons license and your intended use is not permitted by statutory regulation or exceeds the permitted use, you will need to obtain permission directly from the copyright holder. To view a copy of this license, visithttp://creativecommons.org/ licenses/by/4.0/.
© The Author(s) 2019