CHROMATOGRAPHY: GAS
Column Technology
W. Jennings, J&W Scientific, Inc., Folsom, CA, USA
Copyright^ 2000 Academic Press
Introduction
It is the role of the column to achieve separation of the components of injected mixtures. In many cases, it is also possible to accomplishextra-column ‘separ-ation’, i.e. ‘separation’ by distinguishing between merged or co-eluting solutes. Selective detectors, such as theSame photometric detector, are useful in this regard, but our focus here will be directed toward separation as accomplished in the column.
The resolution equation is usually presented in one of two popular forms:
Nreq"16R2s[(k#1)/k]2[/(!1)]2 [1]
or:
Rs"1/4(N[k/(k#1)][(!1)/] [2]
Equation [1] is used to estimate the number of theor-etical plates that will be required (Nreq) to separate any two solutes to some speciRed degree of resolution (Rs), as functions of the retention factor (k) of the second of those two solutes, and of their separation factor (). These relationships will be utilized later.
Equation [2] emphasizes that resolution (i.e. the degree to which solutes are separated) is affected by only three parameters: (1) the number of theoretical plates (N); (2) solute retention factors (k); and (3) solute separation factors ().
The number of theoretical plates is a function of the ‘sharpness’ of a peak, relative to the time that the solute spends in the column. The measurement is affected by the length of the solute band introduced into the column (it is assumed that this is inR nitesimal-ly small, which is never the case), the length (L) and radius (rc) of the column, the retention factor (k) of the solute, and the average linear velocity (uN) of the carrier gas. It can also be affected by the thickness of the stationary phaseRlm (df), and by solute diffusivity in the stationary phase (DS). Small values of k yield disproportionately large values of N. This anomaly essentially disappears with values ofk55.
The parameters affecting the solute retention factor (k) can be deduced from the inviolable relationship that must always exist between k, the distribution constant (Kc), and the column phase ratio ():
Kc"k [3]
From this, it is evident thatk"Kc;1/, or (using the deRnitions in the Glossary):
k"cS/cM;VS/VM [4]
For a given solute,k varies directly with solubility of that solute in the stationary phase (e.g. thekvalue of pentane would, under similar conditions, be higher in a polydimethylsiloxane stationary phase than in a poly-ethylene glycol stationary phase). In a given stationary phase,kvaries indirectly with temperature: as the tem-perature increases, cSdecreases and cM increases, and
kdecreases in a manner that is essentially exponential. Finally (as evidenced in eqns [3] and [4]),kvaries inversely with the column phase ratio,(or directly with 1/). In other words, solute retention factors (k) increase as the volume of column occupied by station-ary phase (VS) increases and/or the volume occupied by mobile phase (VM) decreases. In packed columns, is usually controlled by the stationary phase ‘load-ing’; in the open-tubular column, is controlled primarily throughdf, and to a smaller extent, through
rc. There are some practical limitations: where
df(0.1m, columns can exhibit excessive activity, as evidenced by ‘tailing’ (reversible and irreversible adsorption) of ‘active’ solutes. Wheredf'1.0m (or even less ifDM(10\7cm2s\1), the mass transport term of the van Deemter equation (CM) becomes limiting, and column efRciency (as reSected by N) decreases. Solute retention factors interrelate with determinations ofN. Unless the gas velocity is so high that solutes can no longer undergo equilibrium par-titioning (this would require extremely high vel-ocities),kis independent ofuN.
Comparisons of Packed and
Open-Tubular Columns
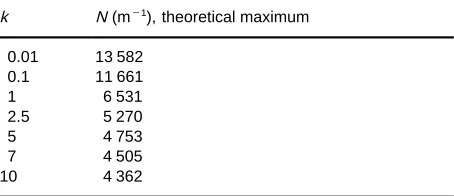
Table 1 Maximum theoretical values of the numbers of theor-etical plates per metre of column length (N m\1) as a function of
the retention factor (k) of the test solute. Values are calculated for a 0.25 mm column, and assume DM"0.6 cm2s\1 and DS"10\7cm2s\1
k N (m\1), theoretical maximum
0.01 13 582
0.1 11 661
1 6 531
2.5 5 270
5 4 753
7 4 505
[image:2.568.51.278.612.710.2]10 4 362
Figure 1 Graph of the data shown in Table 1, maximum theor-etical values of the numbers of theortheor-etical plates per metre of column length (N m\1) as a function of the retention factor (k) of
the test solute. Values are calculated for a 0.25 mm column, and assumeDM"0.6 cm2s\1, andDS"10\7cm2s\1.
length of the packed column is limited in practice to about 5 m, because the packing offers a much greater resistance to gas Sow than does the open tube. As a result, the packed column can deliver a maximum of about 15 000 theoretical plates, which pales in comparison to the 150 000 to 500 000 theoretical plates that can be attained in the modern open-tubu-lar columns. Some work has been reported using longer packed columns operated under extreme pres-sures, but these applications have not proven practi-cal in a working environment.
In the open-tubular column, the theoretical max-imum achievable efRciency can be estimated from the fact that:
H"L/N [5]
and:
Htheor min"rc[(11k2)#6k#1]1/2/[3(1#k)2]
[6]
It was mentioned in earlier discussions ofkthat small values ofkexhibit disproportionately large values of
N(or small values ofH). If we use eqn [6] to calculate
Htheor min and Ntheor max for a 0.25 mm open-tubular column, we obtain the values shown in Table 1. A graph of these data (Figure 1) stresses the very large values of N that are obtained for small values ofk. Note that this effect becomes negligible ask55.0.
For many years, packed columns offered a distinct advantage to the analyst concerned with the separ-ation of highly volatile solutes, because the phase ratio () of the packed column is rarely greater than about 30, while the phase ratios of early wall-coated open-tubular columns were usually about 300. From eqn [3], it is evident that solute retention factors (k) will be some 10 times greater (300/30) on packed columns than on these early open-tubular columns, with all other conditions constant.
The number of theoretical plates that will be re-quired to separate any two solutes is the product of three multipliers in eqn [1]: (1) the degree of resolu-tion required [16R2s] (for baseline separation,
Rs1.5, and this one multiplication factor becomes 36); a squared ratio of the separation factors [/(!1)]2, and a squared ratio of the retention fac-tors [(k#1)/k]2. A highly volatile solute might ex-hibit k"0.01 on one of these earlier open-tubular columns, and the [(k#1)/k]2multiplier would there-fore be [101/1]210 000. On the packed column, the phase ratio is lower, and thekof this solute (all other conditions constant) would increase by the factor 300/30;0.010.1. This results in the [(k#1)/k]2 multiplier becoming 121 instead of 10 000, and the number of theoretical plates required for the separ-ation of this low-ksolute has been decreased by two orders of magnitude.
Because of these relationships, the packed column user was more successful in attaining the separation of some highly volatile (low-k) mixtures that resisted separation on the wall-coated open-tubular columns of those times. The subsequent development of cross-linked and surface-bonded stationary phases permit-ted the manufacture of open-tubular columns with much thicker Rlms of stationary phase } 3, 5 and 8m. In a 0.25 mm column, these give phase ratios of 20.8, 12.5 and 7.8, respectively, and this particular advantage of the packed column disappears. Alterna-tively, retention factors are usually signiRcantly high-er on porous-layhigh-er open-tubular (PLOT) columns that utilize the more retentive mode of gas}solid ad-sorption chromatography rather than gas}liquid parti-tion chromatography. EvenRxed gases such as argon, nitrogen, oxygen can be resolved on such columns.
equation. In its packed column form, this can be expressed as
H"A#B/uN#CuN [7]
whereAis the eddy diffusion or packing factor term,
B is the longitudinal diffusion term and C is the resistance to mass transfer term. BecauseHis a func-tion of 1/N, the smaller the sum of these terms, the smaller H, and the more efRcient the system. (EfR -ciency equations really represent the efRciency not of the column, but of the total system. A number of extra-column factors } the injection process, extra volume in the injector and detector, too low a split ratio or make-up gasSow, lag time in signal acquisi-tion }detract from system efRciency, but efRciency equations attribute all of this to the column.) The open-tubular column has no packing, and theAterm can be discarded to yield the Golay equation:
H"B/uN#CuN. Some major differences between packed and open-tubular columns become more ap-parent if theCterm is expanded to distinguish mass transfer from stationary phase to mobile phase (Cs) from mass transfer from mobile phase to stationary phase (CM):
H"B/uN#uN[CM#CS] [8]
In packed columns, most of the interior volume of the column is occupied by the particles of support material; each particle is covered with a relatively thickRlm of stationary phase, and there is a minus-cule gas volume in the interstitial space between the particles. Hence the volume of stationary phase is large, the volume of mobile (gas) phase is small, and the packed column typically has a smaller phase ratio or. In the packed column, the magnitude of the C
term is largely a function of mass transfer from stationary to mobile phase (CS). A solute molecule dissolved in stationary phase takes some time before it re-enters the mobile phase, where it must proceed only a minuscule distance through the carrier gas (CM) before it again enters stationary phase.CSis the
limiting factorin the packed column, butCMis trivial: hence, hydrogen, helium, nitrogen, argon}methane or carbon dioxide yield essentially the same efRciencies when used as the mobile phase in packed columns.
In the open-tubular column, a much thinnerRlm of stationary phase is on the wall of a tube, which while usually of capillary dimension, requires solute mol-ecules to traverse a much longer Sow path through the mobile phase. Thus the transverse distance across the open-tubular column is signiRcantly greater than the interparticle distance encountered in packed col-umns. As a consequence, column efRciency (and the
optimum average linear velocity of the carrier gas) varies directly with the diffusivity of the mobile phase. In the open-tubular column,CMis the limiting factor andCSis trivial}until we come to the thick-Rlm open-tubular column. In this case,both CSand
CM are signiRcant; the major advantage of the open tubular column has been sacriRced, and column efR -ciency suffers.
An analogous limitation is encountered with low diffusivity stationary phases. In the polydimethyl-siloxane stationary phase,Dsfor a C12compound at 1503C approximates to 1;10\7cm2s\1. At this value, columns yield about the same efRciencies when the stationary phase Rlm (df) is varied from 0.1 to 0.4m; at df'0.4m, the efRciencies of columns coated with this stationary phase begin to decrease. Polysiloxanes are relatively permeable, and substitu-tions that increase the carbon/oxygen ratio (e.g. phenyl) have an adverse effect on that permeability. This lowers the value of Ds, and column efR cien-cy}in terms of plates per metre}decreases, unless
dfis also decreased. As an example, smaller values of
dfare desirable on columns coated with polymethyl-siloxanes containing phenyl, cyanopropyl and/or polyethylene glycol-type substituents, where a signiR -cant increase in efRciency is exhibited by 0.15mRlm columns as compared to 0.25mRlms. As the rate of diffusion through the stationary phase decreases (this is a function ofDs), the distance the solute must travel through that stationary phase (a function ofdf) be-comes increasingly important.
Many investigators have contributed to our pro-gress in stationary phase and column developments. While a thorough discussion of the interrelationships and signiRcance of these contributions is beyond the scope of this article, the Further Reading section include some of the more salient efforts in column developments.
The Stationary Phase
As discussed earlier, packed columns are typically limited to lengths that can generate 10 000 to 15 000 theoretical plates because of their higher pressure drops. With this restriction onN, the separation fac-tor, , becomes more critical to the packed column (eqn [2]), andis best controlled through the choice of stationary phase. While values do respond to changes in temperature, the direction of any given response can be predicted only for solutes whose functionalities are similar. For example, in a series of methyl ketones or a series of parafRn hydrocarbons, values vary inversely with temperature. But if the column temperature is decreased for a sample con-taining a mixture of methyl ketones and parafRn hydrocarbons, one can predict only that theof any two hydrocarbons (and that of any two ketones) will increase. The of a mixed pair }hydrocarbon and ketone}can increase or decrease as the temperature is lowered, and that effect will be reversed if the temperature is raised. In short, the effect of temper-ature on cannot be predicted for two solutes of different functionality. Hence for any given group of mixed solutes, values are controlled primarily through experience and observations on the probabil-ity of interactions between given solutes and a given stationary phase.
The limitation on N and the resultant increased reliance on made stationary phase selectivity of major import to the packed column, and has been largely responsible for the proliferation of some 300 different stationary phases for packed columns. Because much higher numbers of theoretical plates are attainable in open-tubular columns, solute separation factors}}were initially less critical to the user of open-tubular columns. However, the in-exorable increase in the demands placed upon the analytical chemist ultimately necessitated the devel-opment of high-N columns coated with high- phases.
Low-Bleed Columns
As the column temperature is increased, there is an increase in the steady-state baseline signal. The chem-ical bonds of the stationary phase are under increased thermal stress, degradation fragments are produced at an increased but constant rate, and the baseline signal rises and remains steady as long as that temper-ature is maintained. In polysiloxane stationary phases, the degradation fragments consist largely of cyclic siloxanes, dominated by trimers and tetramers of (}Si}O}) to which the methyl (or other) substitu-ents occupying the remaining two bonds of the tetra-valent silicon atom may remain attached, or may cleave. True column bleed does not generate peaks or
humps; a signal that rises and then falls must have a ‘point source’. Bleed signal is annoying with any bleed-sensitive detector, and can be the limiting fac-tor in GC-MS, especially with the newer ion trap mass spectrometers (ITD). For a given quality of stationary phase under a given set of conditions (tem-perature, carrier gasSow), bleed is always a function of the mass of stationary phase in the Sow path. Hence, shorter, smaller diameter, thinner Rlm col-umns will exhibit lower bleed levels than longer, larger diameter, thickerRlm columns.
At the present time, column bleed is usually re-ported in terms of pA of FID (Same ionization de-tector) signal at a given temperature, but this is an imprecise speciRcation. It would be better to report bleed as ‘pg carbon emitted per unit time’ as mea-sured on acalibrateddetector. Only where the same detector is used under the same conditions for both determinations can different columns be truly com-pared in terms of ‘pA of FID signal’. Bleed signal from polysiloxane columns is generally attributed to cyclic siloxanes that usually arise from thermal and/or oxi-dative degradation of the phase, but contaminants in the detector or in gas lines supplying that unit, mater-ials outgassing from septa and ferrules, and contami-nating oils from column installation also contribute to what is perceived as column bleed. The latter sources are usually (but not always) dwarfed by the former, but their signiRcance increases in the case of low bleed columns. It should also be noted that at elevated temperatures, even a pristine FID without any columngenerates 1}2 pA signal.
Some years prior to the invention of gas chromatography, Sveda, a Du Pont chemist working on bulk polymers, Rled two patents on silarylene} siloxane polymers. Shown in Figure 2 are generic structures of (A) the conventional 95% dimethyl}5% diphenylpolysiloxane (in which the phenyl groups are pendant to the siloxane chain), and (B) Sveda’s poly(tetramethyl-1,4-silphenylene siloxane).
Figure 2 Generic structures of (A) the conventional 95% dimethyl}5%diphenylsiloxane and (B) Sveda’s poly
(tetramethyl-1,4-silphenylene siloxane).
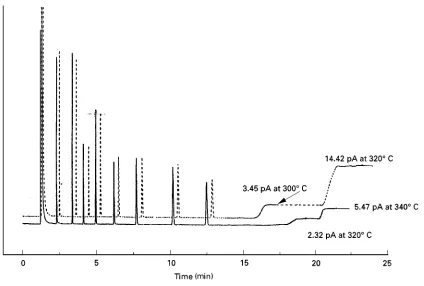
Figure 3 Chromatograms of a column test mixture on 30 m;0.25 mm, df 0.25m columns. Test mixtures were run at 1303C
isothermal, and columns ramped to higher temperatures to determine bleed profiles. Note that the ‘delta bleed’ is 2.32 pA at 3203C for
the ‘second generation’ column, versus 14.42 pA for the ‘conventional’ column. This is essentially the ‘maximum temperature’ of the latter column, which has reached a point where bleed increases exponentially with temperature. The latter column is capable of still higher temperatures, however, and exhibits a bleed signal of 5.47 pA at 3403C. Key: - - -, first generation 35%diphenylpolysiloxane
column;**, second generation 35%phenyl low-bleed column.
Several pathways have been postulated for the ther-mal degradation of siloxanes, some of which require a proximity of two normally separated groups that would require folding of the siloxane chain. It has been suggested that such reactions might be blocked
by the insertion of groups that would make the chain more rigid and restrict itsSexibility. Such efforts have led to the introduction, by more than one manufac-turer, of stationary phases that are characterized by the generation of lower bleed signals, even at elevated temperatures, e.g. 3603C.
Figure 3contrasts the bleed proRles of examples of ‘Rrst generation’ (a silphenylene siloxane) and ‘sec-ond generation’ (a silphenylene siloxane contain-ing ‘chain-stiffencontain-ing’ groups) low-bleed columns. Note that the latter not only exhibits a bleed level about half that of the former, but the bleed pattern is simpler, making the phase especially valuable for those utilizing bleed-sensitive detectors such as the ion trap mass spectrometer. It also possesses a unique selectivity that has excited great interest among those interested in a variety of problematic separations, including the polychlorinated biphenyl congeners.
[image:5.568.74.498.357.643.2]Figure 4 Chromatograms of a test mixture on four dimensionally identical columns, all coated with the same experimental high phenyl stationary phase, but subjected to different deactivation pretreatments. Note the disappearance of 2-ethylhexanoic acid in (D) and the intercolumn variations in retention indices (I) for methylnaphthalene and undecanol. See text for discussion of the effects of the surface energies () on coating efficiencies (CE). Solutes in order of elution: 1, 2-ethylhexanoic acid (totally adsorbed in chromatogram D); 2, 1,6-hexanediol; 3, 4-chlorophenol; 4, tridecane; 5, 2-methylnaphthalene; 6, 1-undecanol; 7, tetradecane; and 8, dicyclo-hexylamine.
suggests that activity sometimes depends on whether solutes ‘see’ the surface. As solute molecules migrate through the stationary phase toward the siliceous surface, the carrierSow sweeps the solute molecules in the gas phase downstream. To re-establish the distribution constant in that portion of the column, solute molecules in the stationary phase reverse direc-tion and migrate toward the mobile phase. Whether this impetus to change the direction of migration occurs before or after the solute has reached the surface would, under a given set of conditions, de-pend on the thickness of the stationary phaseRlm.
The afRnity of the surface for polar stationary phases is sometimes estimated by measuring the surface energy of the prepared surface. While both
the nature and strength of surface-to-polymer interac-tions are important to column performance, they are not necessarily predictable. A given ‘high energy’ sur-face is not always suitable for the deposition of a ‘high energy’ polymer. Architectural ‘tailoring’ of the surface can be as difRcult as tailoring stationary-phase selectivity. The concept of ‘coating efRciency’, used inFigure 4, (CE"100;Htheor min]/[Hobserved]) is often used to measure the compatibility of a surface for a given stationary phase.
which has high surface energy but very poor coating efRciency. (A), (B) and (D) all are nonbeaded surfaces, but the coating efRciencies of (A) and (B) are signiR -cantly better than that of (D). The coating efRciencies of these three columns vary in the order 2'1'4, while the surface energies vary in the order 1'4'2. The column with the lowest surface energy of the coatable surfaces (column B), yields the highest coat-ing efRciency. In column (D), the acid peak disap-peared. In every case, there is almost surely at least a slight effect on selectivity. One of our better ways for estimating this quality is the duplicability of reten-tion indices for polar and apolar compounds, and column-to-column variations in these comparisons imply that closely eluting solutes of different func-tionalities may exhibit a given elution order on the one column, and a different elution order on the other column. These data indicate that both the stationary phase (which may be proprietary) and column pre-treatments (which are almost always proprietary and vary from manufacturer to manufacturer) affect re-tention factors, separation factors, and even the elu-tion order. Surface pretreatments, including but not limited to deactivation, can, and often do, exert profound effects on overall column performance.
Conclusions
During its half century history, gas chromatography (GC) has evolved to become the world’s most widely used analytical technique. The growth has acceler-ated with the commercial availability of columns, the quality of which has shown consistent improvements, and by the continuing development of compatible instrumentation and combined techniques (e.g. gas chromatography}spectrometry, GC-AED, etc.). Also important to that growth is the fact that the technique possesses separation powers so great that the un-skilled analyst can abuse the technique and still gener-ate useful data. Other analytical methods (e.g. capil-lary electrophoresis, capilcapil-lary zone electrophoresis, liquid chromatography) have shown promise of greatly increased growth, but GC has not stagnated. Many of the elements necessary for ‘fast’ GC have been known for some time, but their application usually requires instrumental modiRcation and ad-aptation beyond the purview of most practising ana-lysts. Some cracks in this barrier have recently ap-peared. Developments in more selective stationary phases, electronic pneumatic controls, micropacked columns, and shorter columns of smaller diameter now permit some users to demonstrate improved sep-arations while reducing analysis times. Appreciable time savings have been demonstrated merely through reRnement of operational parameters (temperature,
program rates, gas velocity). By changing both opera-tional and design parameters (e.g. column dimen-sions), analysis times using unmodiRed instrumenta-tion have been reduced from 30 min to a few seconds. A greater utilization of these newer developments, however, will require honing the skills of the average analyst through continuing education.
See Colour Plates 19, 20.
See also: II/Chromatography: Gas: Detectors: General (Flame Ionization Detectors and Thermal Conductivity Detectors); Detectors: Mass Spectrometry; Detectors: Selective; Gas-Solid Gas Chromatography; Historical Development; Sampling Systems; Theory of Gas Chro-matography. Appendix 2: Essential Guides to Method Development in Gas Chromatography.
Further Reading
Blomberg L, Markides K and Wannman T (1980)Journal
of High Resolution Chromatography 3: 527d528;
(1982) 5: 520d533.
Buijten JC, Blomberg L, Hoffmann S, Markides K and
Wannman (1984) Journal of Chromatography 301:
265d269.
Burns W and Hawkes SJ (1977) Journal of
Chromato-graphic Science15: 185d190.
Dandenau R and Zerriner E (1979)Journal of High
Resolu-tion Chromatography2: 351d356.
Desty DH, Haresip JN and Whyman BHF (1960)
Analyti-cal Chemistry32: 302d304.
Dvornic PR, and Lenz RW (1990) High Temperature
Siloxane Elastomers. Basel: Huethig&Wepf.
Ettre LS (1993) Nomenclature for chromatography.Pure
and Applied Chemistry65: 819}872.
Jennings W (1987)Analytical Gas Chromatography, 1st
edn, pp. 11}18. San Diego, CA: Academic Press.
Jennings W, Lautamo R and Reese S (1997) In Kaiser O and
Kaiser RE (eds)Chromatography: Celebrating Michael
Tswett’s 125th Birthday, pp. 117d125. Dusseldorf: In Com.
Jennings W, Mittlefehldt E and Stremple P (1997)
Analyti-cal Gas Chromatography, 2nd edn, pp. 332, 336}339.
Kong JM and Hawkes SJ (1976) Journal of
Chromato-graphic Science14: 279d287.
Wright BW, Lee ML, Graham SW, Phillips LV and Hercules
DM (1980)Journal of Chromatography199: 355d369.
Glossary
Based on the most recent recommendations of the International Union of Pure and Applied Chem-istry (IUPAC), which appeared in Pure and Ap-plied Chemistry65: 819}872 (1993).
AEddy diffusion, or packing factor term of the van Deemter (packed column) equation.
BLongitudinal diffusion term of the van Deemter and Golay equations.
Column phase ratio. The column volume occupied by mobile (gas) phase relative to the volume occu-pied by stationary phase. In open-tubular columns: "[rc!2df]/[2df]rc/2df.
cM,cSSolute concentrations in mobile and stationary phases, respectively.
C Resistance to mass transfer (or mass transfer) in the van Deemter (or Golay) equations; CM and CS denote mass transfer from mobile to stationary and from stationary to mobile phases, respectively.
dcInner diameter of the column. Both mm andm are commonly used. The latter, while consistent with the units used fordf, implies three signiRcant R g-ures, which is rarely true.
dfThickness of the stationary phaseRlm, usually in
m.
DDiffusivity;DMandDSdenote solute diffusivities in the mobile and stationary phases, respectively; usually given in cm2s\1.
F Volumetric Sow of the mobile phase, usually in cm3min\1. Many practical chromatographers as-sume equivalency with (and hence employ) mL min\1.
FIDFlame ionization detector.
GC-MSThe combination of gas chromatography and mass spectrometry, usually a single integrated unit in which fractions separated by GC are sequen-tially introduced to the MS.
HLength equivalent to one theoretical plate (height equivalent to a theoretical plate):H"L/N. When measured atuopt, the result is termedHmin. k Solute retention factor (formerly partition ratio).
Ratio of the amounts of a solute (or time spent) in stationary and mobile phases, respectively. Be-cause all solutes spendtMtime in the mobile phase,
k"[tR!tM]/tM, andk"tR/tM.
KcDistribution constant. FormerlyKD. Ratio of sol-ute concentrations in stationary and mobile phases, respectively:Kc"cS/cM.
LLength of the column, usually expressed in metres for column length, in cm for the determination of
uN, and in mm for the determination ofH. NTheoretical plate number;N"[tR/]2, whereis
the standard deviation of the peak.
NreqNumber of theoretical plates required to separate two solutes of a given alpha and given retention factors to a given degree of resolution: Nreq" 16R2s[(k#1)/k]2[/(!1)]2.
o.d. Outer diameter of the column. rcInside radius of the column.
RsPeak resolution. A measure of separation as evid-enced by both the distance between the peak maxi-ma and by the peak widths. ASTM and IUPAC deRnitions are based onwb (peak width at base) measurements, which require extrapolation. If peaks are assumed to be Gaussian, then Rs" 1.18[tR(B)!tR(A)]/[wh(A)#wh(B)].
Standard deviation of a Gaussian peak.
tMGas hold-up time. The time (or distance) required for a nonretained substance (e.g. mobile phase) to transit the column.
tR Retention time. The time (or distance) from the point of injection to the peak maximum.
tR Adjusted retention time. Equivalent to the resi-dence time in stationary phase; difference of the solute retention time and the gas hold-up time:
tR"tR!tM.
uN Average linear velocity of the mobile (gas) phase:
uN (cm s\1)"L(cm)/t(s).
VVolume.VM andVSrepresent volumes of the mo-bile and stationary phases, respectively.
wbPeak width at base. Determined by measuring the length of baseline deRned by intercepts extrapo-lated from the points of inSection of the peak, and equivalent to four standard deviations in a Gaus-sian peak.
wh Peak width at half-height. Measured across the peak halfway between baseline and peak max-imum, this can be measured directly without extra-polation, and is equal to 2.35 standard deviations in a Gaussian peak.
Derivatization
P. Hus\ek, Institute of Endocrinology, Prague, Czech Republic
Copyright^ 2000 Academic Press
Introduction
Gas chromatography (GC), the longest established instrumental chromatographic technique, dominated