ePrints Soton
Copyright © and Moral Rights for this thesis are retained by the author and/or other copyright owners. A copy can be downloaded for personal non-commercial
research or study, without prior permission or charge. This thesis cannot be
reproduced or quoted extensively from without first obtaining permission in writing from the copyright holder/s. The content must not be changed in any way or sold commercially in any format or medium without the formal permission of the
copyright holders.
When referring to this work, full bibliographic details including the author, title, awarding institution and date of the thesis must be given e.g.
AUTHOR (year of submission) "Full thesis title", University of Southampton, name of the University School or Department, PhD Thesis, pagination
DEPARTMENT of MECHANICAL ENGINEERING
Biomedical Sensor for Transcutaneous Oxygen Measurements
Using Thick Film Technology
By
YU-ZHI (LIZA) LAM
A thesis submitted for the degree of Doctor of Philosophy
This thesis is the result of original work done wholly by myself whilst I was registered for
postgraduate candidature within the Department of Mechanical Engineering, School of
Engineering Sciences at the University of Southampton.
Doctor of Philosophy
Biomedical Sensor for Transcutaneous Oxygen Measurements
Using Thick Film Technology
ABSTRACT
by Yu-Zhi (Liza) Lam
The measurement of the partial pressure of oxygen in arterial blood is essential for the
analysis of a patient's respiratory condition. There are several commercially available
methods and systems to measure this parameter transcutaneously. However, they tend to be
cumbersome and costly. To overcome the disadvantages presented, a new type of sensor for
transcutaneous blood gas measurement was investigated, employing thick film technology,
which is an excellent technique to produce sensors in bulk, as it is cost effective and easy for
reproducible fabrication.
This thesis describes the application of thick film technology to the investigation and
production of these sensors, which are small in size and readily disposable. Such advantages
are greatly welcomed from the medical point of view. The devices under investigation were
based on amperometry. Gold electrodes were printed on an alumina substrate and covered
with a layer of electrolyte gel and then finally, with a membrane. An external silver/silver
chloride reference electrode was also employed in this electrochemical cell set-up. The
project also involved several electronic circuits to support the transcutaneous oxygen
measurement. The main studies were concentrated on the materials employed as the
electrolyte and membrane. Investigations were carried out to evaluate the performance of
these devices in atmospheric and hydrated environment as well as under the influences of
different temperatures. Detailed discussions of the results were presented and future work for
the project is identified.
The novel contributions towards this research work were categorized into two major modules.
Firstly, in the heating module, a single element taking both the roles of a heating element and
a feedback temperature sensor was employed for the wheatstone bridge circuit configuration
most promising choice for the thick film transcutaneous oxygen sensor was the prototype
with Nafion as the electrolyte and PTFE as the membrane. The disposable prototype
produced results achieving low manufacturing cost of approximately £1 and was able to
make continuous measurement of up to 46 hours. It proved to be compact, non-biohazardous
and portable with a good degree of user-friendliness. It also provided accurate and
reproducible measurements of not more than 3% error.
Thorough intensive research activities were carried out to overcome all existing problems in
order to achieve the objectives of the research project. With more than 70% of the
specifications being met, the positive results had presented a successful design for the
fundamental version of the disposable transcutaneous oxygen sensor employing thick film
Content Page
Abstract I
Contents III
List of Figures X
List of Tables XVI
Acknowledgements XVII
Symbol Definition XVIII
Glossary of Terms XX
Chapter 1 Introduction 1
1.1 Project Background 1
1.2 Objectives and Scope of the Thesis 3
1.3 Specifications of Sensor Prototype 5
1.4 Contribution of the Research 7
Chapter 2 Literature Review 8
2.1 Blood Gas Monitoring 8
2.2 Transcutaneous Blood Gas Monitoring 12
2.3 Electrochemical Principles 17
2.3.1 The Function of the Materials within a Clark Cell 17
2.3.2 The Function of Aqueous Salt Electrolytes and
Membranes and their Material
19
2.4 Polymer Electrolytes 24
2.5 Polymer Membranes 27
2.6 Thick Film Technology 29
2.6.1 Raw Materials (Ink or Paste) 30
2.6.2 Screen Artwork 31
2.6.3 Substrate 33
2.6.4 Printing/ Drying/ Firing Processes 33
Chapter 3 Sensor Fabrication and Design 36
3.1 Fabrication of Sensor Prototype 36
3.2 Potentiostat 41
3.3 Heater Module 43
3.3.1 Heating Circuit 43
3.3.2 Heater Element 46
Chapter 4 Theoretical Modeling for 1-Dimensional Diffusion 47
4.1 Electrode Material and Structure 47
4.2 Electrolyte Material and Structure 51
4.3 Membrane Material and Structure 55
4.4 Theoretical Modeling 61
Sensing Module
5.1 Effects of Different Placements of Heater Element 68
5.1.1 Experimental Procedure 68
5.1.2 Resultant Relationship Plots between Resistance and
Temperature
69
5.1.3 Observations and Discussion 70
5.2 Stability of Heater Module 71
5.2.1 Experimental Procedure 72
5.2.2 Observations and Discussion 73
5.3 Transient Heater Measurement Using an Infrared Camera 75
5.3.1 Experimental Procedure 76
5.3.2 Results and Discussion 77
5.4 Sensor Fabrication 80
5.5 Voltammogram for Transcutaneous Measurement at 0% Oxygen 81
5.5.1 Experimental Procedure 81
5.5.2 Observations and Discussion 83
5.6 Investigations on the Effects of Electrolyte Thickness for
Nafion-based Prototype
86
5.6.1 Experimental Procedure 87
5.6.2 Results and Discussion 87
5.7 Study of Sensor's Performance under Continuous Powering
Conditions
89
5.7.1 Experimental Procedure 89
5.8 Transient Response of Oxygen Sensor at Transcutaneous
Temperature
93
5.8.1 Experimental Procedure 94
5.8.2 Results and Observations 94
5.8.3 Discussion 95
5.9 Conclusions 97
Chapter 6 Establishing Relationship between Oxygen Levels and Output Current
99
6.1 Sensors Employing KNO3 Electrolyte 99
6.1.1 Investigating the Effects of Different Voltammetric Sweep
Rates
99
6.1.1.1 Experimental Setup 99
6.1.1.2 Results of Voltammogram to Investigate the Effect
of Different Sweep Rates
101
6.1.1.3 Conclusions for the Effect of Different Sweep Rates 102
6.1.2 Measurement of Oxygen Levels at Different Temperatures 103
6.1.2.1 Experimental Setup 103
6.1.2.2 Comparison between Sensors' Performance in
Normal Room and Transcutaneous Temperature
104
6.1.2.3 Conclusions on Sensor Performance in Normal
Room and Transcutaneous Temperature
105
6.1.3 Voltammograms for Sensors with Different Membranes for
Transcutaneous Measurement
106
6.1.3.1 Experimental Setup 106
6.1.3.2 Results and Discussion on Voltammogram for
Sensors with Different Membrane Materials under
Transcutaneous Conditions
6.1.4 Relationship between Output Current and Transcutaneous
Oxygen Level
108
6.1.4.1 Experimental Setup 108
6.1.4.2 Establishing Relationship between Output Current
and Transcutaneous Oxygen Level
109
6.1.4.3 Conclusions on Establishing Relationship between
Output Current and Transcutaneous Oxygen Level
112
6.1.5 Overall Conclusions on Sensors Employing KNO3
Electrolyte
115
6.2 Sensors Employing Nafion Polyelectrolyte 116
6.2.1 Effects of Different Voltammetric Sweep Rates on Nafion-
based Sensors
116
6.2.1.1 Experimental Setup and Procedure 116
6.2.1.2 Investigation on the Effect of Sweep Rate using
Direct Voltammetry
117
6.2.1.3 Conclusions on the Effect of Sweep Rate using
Direct Voltammetry
118
6.2.2 Voltammograms for Transcutaneous Sensors with Different
Membranes
119
6.2.2.1 Experimental Setup and Procedure 119
6.2.2.2 Voltammograms of Sensors with Different
Membrane Materials under Transcutaneous
Conditions
119
6.2.2.3 Conclusions on the Voltammetric Study on Nafion-
based Sensors
121
6.2.3 Effects of Oxygen Level Measurement at Room
Temperature and Transcutaneous Temperature
122
6.2.3.1 Experimental Setup and Procedure 122
Different Levels of Humidity
6.2.3.3 Conclusions on Nafion-based Sensors'
Performances in Normal Room and Transcutaneous
Temperature
124
6.2.4 Relationship between Output Current and Transcutaneous
Oxygen Level
124
6.2.4.1 Experimental Procedure 124
6.2.4.2 Establishing the Relationship between Output
Current and Transcutaneous Oxygen Level for
Each Nafion-based Sensor Prototype
125
6.2.4.3 Conclusions on the Relationship between Output
Current and Transcutaneous Oxygen Level for
Each Nafion-based Sensor Prototype
128
6.2.5 Overall Conclusions for Nafion-based Sensors 130
6.3 Effects of Changing pH Level on Sensor Prototype 131
6.3.1 Experimental Setup and Procedure 131
6.3.2 Results and Discussion 133
6.3.3 Conclusions on the Effects of pH Levels 135
6.4 Effects of Changing Concentration of Salt Levels on Sensor
Prototype
137
6.4.1 Experimental Setup and Procedure 137
6.4.2 Results and Discussion 138
6.4.3 Conclusions on the Effects of Salt Concentration Levels 142
6.5 Practical Transcutaneous Oxygen Measurement in a Pilot
Hospital Trial
146
6.5.1 Trial Setup and Procedure 146
6.5.2 Results and Discussion 150
7.1 General Summary and Conclusions 152
7.2 Estimation of Cost 158
7.3 Future Work 160
REFERENCES 163
APPENDIX A - Preliminary Results for Sensors Using AQ55S and PEO as the Electrolyte
A-1
APPENDIX B - Screen Artwork B-1
APPENDIX C - Mathematica Codes C-1
APPENDIX D - TESTPOINT Program Listing D-1
Caption Page Figure 2.1 General Schematic Representation of an Electrochemical Cell
Demonstrating Amperometry
9
Figure 2.2 Measurement Set-up for Pulse Oximetry 11
Figure 2.3 The Principle of Pulse Oximetry 11
Figure 2.4 Layered Structure of Skin 14
Figure 2.5 Commercial Transcutaneous Monitoring System from Radiometer
15
Figure 2.6 Block Diagram of PO-550 (Sumitomo) Monitoring System 16
Figure 2.7 Diffusion Path of the Oxygen Molecule 19
Figure 2.8 Nernst Diffusion Layer Model 21
Figure 2.9 Typical Cyclic Voltammogram 22
Figure 2.10 (a) Polarogram Depicting Current-to-Voltage Relationship at Different Oxygen Tensions
23
Figure 2.10 (b) Calibration of Current to Oxygen at a Fixed Polarization Voltage 23
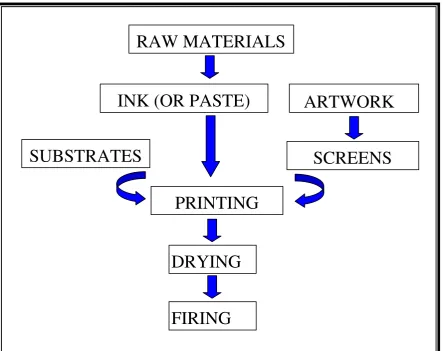
Figure 2.11 Block Diagram of Thick Film Fabrication 29
Figure 2.12 Thick Film (TF) Oxygen Sensor Prototype 30
Figure 2.13 Microscopic View of the Mesh 32
Figure 2.14 Basic Screen Printing Process 34
Figure 2.15 Overall Flow Diagram of Thick Film Process 35
Figure 3.1 (a) Thick Film Printing of the Layers Involved in the Fabrication of the Heater Module of Blood Gas Sensor Prototype
36
Figure 3.1 (b) Thick Film Printing of the Layers Involved in the Fabrication of the Oxygen Sensing Module of the Blood Gas Sensor Prototype
37
Figure 3.2 Effect of Grounded Guard on Oxygen Molecules 38
Figure 3.5 Functional Block of the Potentiostat Circuit 41
Figure 3.6 Helmholtz Layer Model of a Electrical Double Layer 42
Figure 3.7 Block Diagram of the Heating Circuit 44
Figure 3.8 Heating Control Circuit using Single Heater Element 44
Figure 3.9 Heating Element 46
Figure 4.1 Gold (Au) Structure at (a) 50 times and (b) 200 Times its Original Size
47
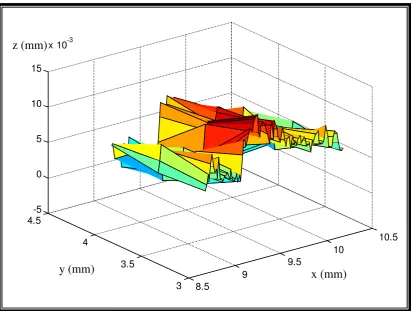
Figure 4.2 3-D Surface Contour of Gold Electrodes 48
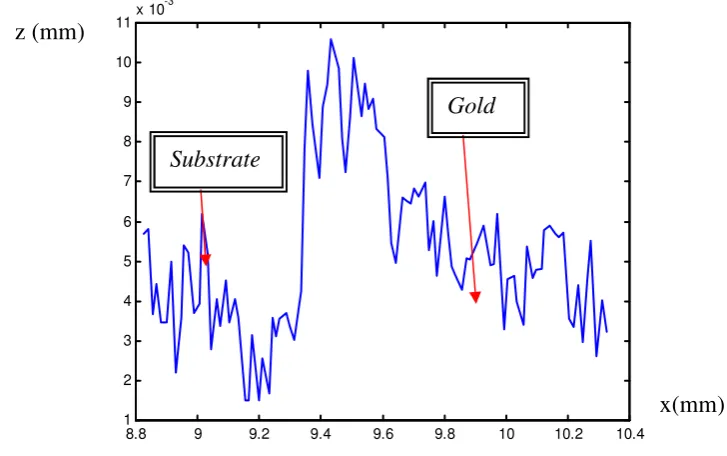
Figure 4.3 2-D Cross-sectional Profile of Gold Electrodes 49
Figure 4.4 Silver/Silver Chloride (Ag/AgCl) Structure at (a) 50 times and (b) 200 Times its Original Size
50
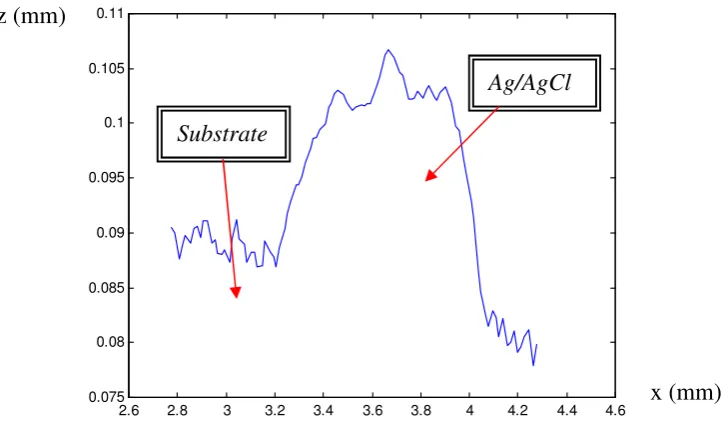
Figure 4.5 2-D Cross-sectional Profile of Silver/Silver Chloride (Ag/AgCl) Reference Electrode
50
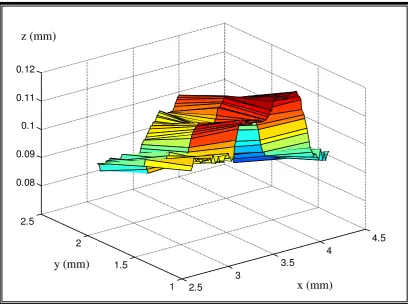
Figure 4.6 3-D Surface Contour of Silver/Silver Chloride (Ag/AgCl) Reference Electrode
51
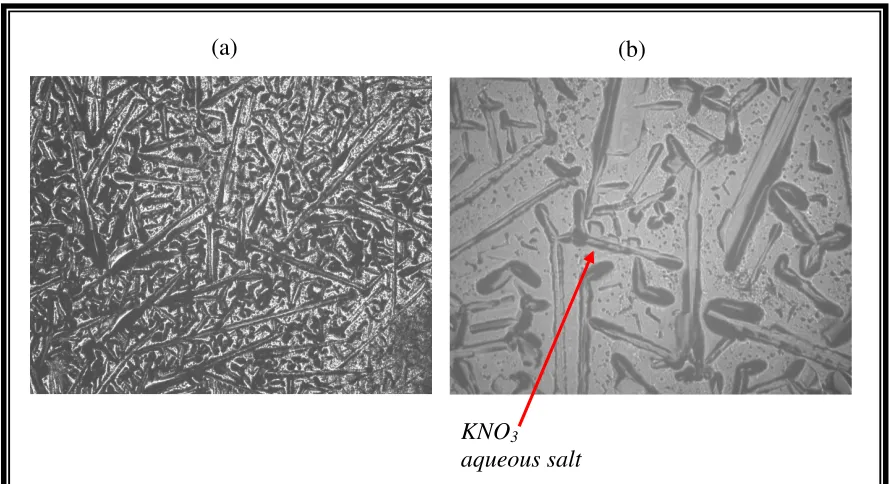
Figure 4.7 Potassium Nitrate (KNO3) Structure at (a) 50 times and (b) 200
Times its Original Size
52
Figure 4.8 2-D Cross-sectional Profile of Potassium Nitrate (KNO3)
Electrolyte Layer
52
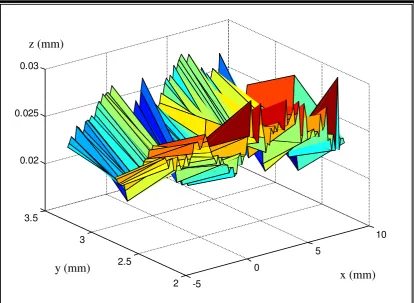
Figure 4.9 3-D Surface Contour of Potassium Nitrate (KNO3) Electrolyte
Layer
53
Figure 4.10 Nafion Structure at (a) 50 times and (b) 200 Times its Original Size
54
Figure 4.11 2-D Cross-sectional Profile of Nafion Electrolyte / Membrane Layer
54
Figure 4.12 3-D Surface Contour of Nafion Electrolyte / Membrane Layer 55
Figure 4.13 Cellulose Acetate (CA) Structure at (a) 50 times and (b) 200 Times its Original Size
56
Figure 4.15 2-D Cross-sectional Profile of Cellulose Acetate (CA) Membrane Layer
57
Figure 4.16 Polyvinyl Chloride (PVC) Structure at (a) 50 times and (b) 200 Times its Original Size
57
Figure 4.17 2-D Cross-sectional Profile of Polyvinyl Chloride (PVC) Membrane Layer
58
Figure 4.18 3-D Surface Contour of Polyvinyl Chloride (PVC) Membrane Layer
58
Figure 4.19 Polytetrafluoroethylene (PTFE)) Structure at (a) 50 times and (b) 200 Times its Original Size
59
Figure 4.20 3-D Surface Contour of PTFE Membrane Layer 60
Figure 4.21 2-D Cross-sectional Profile of PTFE Membrane Layer 60
Figure 4.22 Radial Schematic of Spherical Cathode 62
Figure 4.23 H(t) Response Plot for Sensor with KNO3 Electrolyte and PTFE
Membrane
65
Figure 4.24 Function H(t) Response Plot for Sensor with Nafion Electrolyte and PTFE Membrane
66
Figure 5.1 Experimental Setup Using Climate Testing Cabinet 68
Figure 5.2 Graph of Resistance vs Temperature with Cellulose Acetate (CA) as the Membrane over the Oxygen Sensor
69
Figure 5.3 Graph of Resistance vs Temperature with PTFE as the Membrane over the Oxygen Sensor
70
Figure 5.4 Graph of Resistance vs Temperature with Polyvinyl Chloride (PVC) as the Membrane over the Oxygen Sensor
70
Figure 5.5 Heater Module Temperature Control Circuit 72
Figure 5.6 Experimental Setup for Long-term Stability Test 72
Figure 5.7 Temperature Response of Heater Element in Air and on Skin Surface
73
Figure 5.10 Reconstructed Digitized Images of Temperature Distribution after 1 minute, Front (Left) and Back (Right)
78
Figure 5.11 Temperature Distribution after 5 Mins, Front (Left) and Back (Right)
79
Figure 5.12 Reconstructed Digitized Images of Temperature Distribution after 5 Minutes, Front (Left) and Back (Right)
79
Figure 5.13 Experimental Setup for Voltammetry 82
Figure 5.14 TESTPOINT Menu for Voltammogram 83
Figure 5.15 Voltammogram for KNO3-based Sensor at 44°C, 0% Oxygen
and Low Humidity Conditions
84
Figure 5.16 Voltammogram for KNO3-based Sensor at 44°C, 0% Oxygen
and Hydrated Conditions
84
Figure 5.17 Voltammogram for Nafion-based Sensor at 44°C, 0% Oxygen and Low Humidity Conditions
85
Figure 5.18 Voltammogram for Nafion-based Sensor at 44°C, 0% Oxygen and Hydrated Condition
85
Figure 5.19 TESTPOINT Menu for Varying Oxygen Measurement 87
Figure 5.20 Current vs Oxygen Concentration Plot for Different Numbers of Nafion Layers
88
Figure 5.21 Experimental Setup for Stability Test of Sensor Prototype 89
Figure 5.22 Results of KNO3-based Sensor under Continuous, Long-term
Measurement
90
Figure 5.23 Results of Nafion-based Sensor under Continuous, Long-term Measurement
91
Figure 5.24 Prototype Samples after Long-term Continuous Powering 93
Figure 5.25 Transient Response of KNO3-based Sensors at 44 °C 94
Figure 5.26 Transient Response of Nafion-based Sensors at 44 °C 95
(at 25 °C in a Low Humidity Environment)
Figure 6.3 An Ideal Example of the Voltammetric Responses during Forward Sweep (Cathodic)
102
Figure 6.4 Test Pattern of Oxygen Level Inputs 104
Figure 6.5 Voltammogram for Sensors with Different Membranes at 44°C 107
Figure 6.6 Current Outputs due to Change in Oxygen Levels at 44°C 110
Figure 6.7 Graph to Correlate Output Current Measurement with Transcutaneous Partial Pressure of Oxygen
111
Figure 6.8 Measurement Made from Changing Oxygen Levels at 44°C with the Use of Tegaderm
112
Figure 6.9 Experimental Set-up for Voltammogram 117
Figure 6.10 Voltammograms for Sensor with Nafion Electrolyte under the Influence of Different Sweep Rates (at 44 °C)
118
Figure 6.11 Voltammograms for Sensors with Different Membranes at 44°C and 20% Oxygen
120
Figure 6.12 Current Outputs due to Change in Oxygen Levels at 44°C 125
Figure 6.13 Establishing the Relationship between Output Current Measurement with Transcutaneous Partial Pressure of Oxygen
126
Figure 6.14 Measurement Made from Varying Oxygen Levels at 44°C with the Use of Tegaderm
127
Figure 6.15 Experimental Setup for Current Measurement under the Influence of Varying pH Levels
131
Figure 6.16 Repetitive Oxygen Measurements at Different pH Levels for KNO3-based Sensors with PVC membrane
133
Figure 6.17 Repetitive Oxygen Measurements at Different pH Levels for KNO3-based Sensors with PTFE membrane
134
Figure 6.18 Graph of Current vs pH Level at 0% and 20% Oxygen Levels 135
Figure 6.19 Output Current for Sensors with KNO3 Electrolyte and PVC
Membrane in Different Salt Concentration of NaCl Solution
Figure 6.21 Graph of Current vs NaCl Concentration 140
Figure 6.22 Output Current for Sensors with KNO3 Electrolyte and PVC
Membrane in Different Salt Concentration of KCl Solution
141
Figure 6.23 Output Current for Sensors with KNO3 Electrolyte and PTFE
Membrane in Different Salt Concentration of KCl Solution
141
Figure 6.24 Graph of Current vs KCl Concentration 142
Figure 6.25 Graph of Current vs NaCl Concentration for Sensors with a Nafion Membrane
144
Figure 6.26 Commercial Transcutaneous Oxygen System (TCM-3) 146
Figure 6.27 Clinical Setup for Nafion-based Sensor with PTFE membrane 147
Figure 6.28 Commercial Sensor and In-house Prototype 148
Figure 6.29 Commercial Sensor Tip (TCM-3) 148
Figure 6.30 Commercial System (TCM-3) Experimental Setup 149
Figure 6.31 Hospital Trial Cycle 149
Figure 6.32 Correlation Graph between Thick Film Transcutaneous Oxygen Sensor and Commercial System from Radiometer (TCM-3)
150
Figure 7.1 Overall Flow Diagram of Stages Involved in Sensor Development
155
Figure 7.2 Outlook of Improved Transcutaneous Oxygen Sensor 161
Figure 7.3 Outlook of Improved Transcutaneous Oxygen Measuring System 161
Caption Page Table 2.1 Comparison Table for Different Screens 31
Table 4.1 List of Denotations for Solutions to Planar Cathode Model 64
Table 4.2 Summary of the Properties for Different Materials 65
Table 5.1 Settling Time for Transient Response of Sensor Prototypes 95
Table 6.1 Output Steady-state Current for Sensors at Room and Transcutaneous Temperature
105
Table 6.2 Correlation Equation for Output Current with Partial Pressure of Oxygen
113
Table 6.3 Output Steady-state Current for Nafion-based Sensors at Room and Transcutaneous Temperature
123
Table 6.4 Relationship Between Output Current and Partial Pressure of Oxygen
129
Table 6.5 Regression Information for Establishing Relationship between Output Currents and Salt Concentration Levels
142
Table 7.1 Estimated Cost of Transcutaneous Oxygen Sensor and its System 159
I would like to express my deepest gratitude to my supervisor, Dr John K. Atkinson for his
help, advice and enthusiasm. He has also been most approachable and encouraging
throughout the course of my work.
Special mention of appreciation also goes out to Prof. R. Allen (Institute of Sound and
Vibration Research) and Dr M. Hall (Senior Consultant for Neonatal Intensive Care Unit in
Princess Anne Hospital) for their kind encouragement and sound advice. I would also like to
thank Dr Russell P. Sion for his kind guidance, which proves helpful to the progress of my
work.
Deeply appreciated the kind help from Mr C. S. Toh (Chemistry Department) for putting up
with my questions on the topic of Electrochemistry and Polymers as well as Mr K. S. Tan
(Surface Engineering group) for his guidance in obtaining the photographs from the optical
microscope to determine material thickness. It was also a great pleasure to work with
Mr J. Bilek (Socrates student) on the heating module. I would also take this opportunity to
thank my colleagues and friends namely Dr Gary Zhang, Mrs Gloria Webb, Dr Arnaud Gac
and Miss Yulan Zheng for creating a wonderful and cohesive environment at the Thick Film
Unit.
Last but not least, many thanks to all that have helped me in one way or another throughout
the course of my research. This project was funded by the School of Engineering Sciences,
A Absorbance
Ai Square roots of oxygen diffusion rate (i denoting layer type)
C Concentration of oxygen (mol cm-3)
cbulk Oxygen concentration in bulk material (mol cm-3)
Cdl Double layer capacitance (F)
ce Oxygen concentration in electrolyte (mol cm-3)
CE Counter electrode
cm Oxygen concentration in membrane (mol cm-3)
D Depth of adsorbing layer (m)
DE Diffusion coefficient of electrolyte (m2 s-1)
DL Diffusion coefficient of liquid (m2 s-1)
DM Diffusion coefficient of membrane (m2 s-1)
e- Electron
E Electrolyte layer
EIN Applied potentiostat potential (V)
EOUT Measured potential output of potentiostat (V)
GE Guard electrode
H Transient characteristic
I Transmitted light intensity (candela)
I Current (A or µA)
I0 Incident light intensity (candela)
iR Current within the potentiostat multiply by resistance (V) kB Boltzmann's constant (joules.kelvin-1)
Ki Time constant in i layer
bulk m
K → Distribution coefficient from membrane to bulk material
e m
K → Distribution coefficient from membrane to electrolyte ks Standard heterogeneous electron transfer rate constant
kx Oxygen permeability in x layer (m kg s-2 A-2) L Liquid layer
li Length of layer i (m)
N Number of molecules in a mole
Ns Steady state oxygen flux intensity
pi Partial pressure of oxygen in i layer
PO Partial pressure of oxygen (mmHg) r Radius of particle or molecule (m)
R Gas constant
RCE Solution resistance between counter and reference electrode (Ω)
RE Reference electrode
Ri Diffusional resistance of layer i to oxygen transport (Ω)
RUN Uncompensated resistance between reference and working electrode (Ω)
Rx Output resistance of potentiostat (Ω)
Si Ratio of Li and Aiat i layer T Absolute temperature (K)
WE Working electrode
v Viscosity of the solvent (m N2 s) ε Extinction coefficient
φ Activity energy (J)
σ Conductivity (S m-1)
σO Conductivity at 0 °K (S m-1)
Al2O3 Aluminum oxide
Ag Silver
AgCl Silver chloride
Ag / AgCl Silver-Silver chloride
AgPd Silver Palladium
Amperometric Current measuring
Anion Negatively charged ion
Anode Positively charged electrode where oxidation occurs
Au Gold
CA Cellulose Acetate
Ca+ Calcium ion
Cathode Negatively charged electrode where reduction occurs
Cation Positively charged ion
Cl Chloride molecule
Cl- Chloride ion CO2 Carbon dioxide
d.c. Direct current
GPIB General purpose interface bus
H+ Hydrogen ion H2 Hydrogen molecule
H2O Water molecule
H2O2 Hydrogen peroxide
InSb Indium-antimony
IR Infrared
K+ Potassium ion KCl Potassium chloride
∆KCl Change in potassium chloride level
KNO3 Potassium nitrate
Na+ Sodium ion NaCl Sodium chloride
O2 Oxygen molecule
OH- Hydroxyl ion
PaCO2 Partial pressure of carbon dioxide in artery
PaO2 Partial pressure of oxygen in artery
PEO Polyethylene oxide
pH Measure of acidity or alkalinity
∆pH Change of acidity or alkalinity
PT100 Resistive thermistor
PTFE Polytetrafluoroethylene
PtcCO2 Partial pressure of transcutaneous carbon dioxide
PtcO2 Partial pressure of transcutaneous oxygen
PVC Polyvinyl chloride
R2 Regression coefficient SO3- Sulphate ion
TCR Temperature coefficient of resistance
Chapter 1
Introduction
1.1 Project Background
Healthcare and medical services have always played important roles in part and parcel of
daily lives. In recent years, the need and demand for better and more economical medical
equipment have been on the increase. In order to achieve such improvements, medical
professionals and biomedical engineers often work hand-in-hand to carry out many research
projects, which cover a whole range of medical applications. One such project of particular
interest involves the monitoring and measuring of blood gas levels in arterial blood.
The measurement of partial pressures of two main gases namely oxygen and carbon dioxide
in the arterial blood is essential for doctors to monitor the respiratory conditions of patients,
in particular the preterm neonates who are undergoing surgery or experiencing respiratory
difficulties. Sufficient delivery of oxygen to all the pulmonary and circulatory functions must
be ensured when treating patients particularly critically ill ones. The intention of partial
pressure of oxygen (PaO2) monitoring is to prevent a deficiency in the amount of oxygen
reaching the body tissues, which is known as tissue hypoxia [1]. In the event of having too
little oxygen, irreversible damage could be done to the body's most sensitive organs such as
the brain and heart. Blood oxygen levels are important as the monitored results also reflect
the possible damage due to an excess of oxygen in the body system, which is termed
hyperoxia [1]. Exposure to excessive oxygen can cause retinal vasoconstriction and impaired
cerebral blood flow [2]. Oxidative damage from free radical generation may also occur in
other tissues.
The level of carbon dioxide is also very important as it indicates the status of the central and
cerebral ventilation [1]. In the cases for babies, when there is an acute decrease in partial
pressure of carbon dioxide (PaCO2), blood flow to the brain is reduced (cerebral ischaemia)
and this possibly leads to severe periventricular cyst formation and cerebral palsy. At the
other extreme, excess carbon dioxide could lead to high risk of germinal layer hemorrhage or
profuse bleeding in the blood vessels [3]. These adverse effects due to changes in the blood
consequences prove to be fatal. Hence, continuous monitoring of PaO2 and PaCO2 levels are
crucial in order for doctors to be aware of the patient's current medical condition.
Currently, there are three main methods of measuring blood gas levels commonly used in
clinical practice. One of the techniques is the conventional method of extracting a blood
sample from the patient and analyzing it using a commercial blood gas analyzer. Although
this technique gives very precise and accurate diagnosis, it often exhibits several
disadvantages such as placing unnecessary physical stress on the patient during the blood
sampling procedures. In addition, the analyses and measurements for gas partial pressure can
only be made momentarily using this method. The effective results often exhibit large
variations from the actual on-going situation. In other words, continuous monitoring is not
possible for this clinical evaluation. To overcome these disadvantages, the method of
transcutaneous blood gas monitoring and measurement was introduced in the early 1970s [3].
More recently, oximetry which measures oxygen saturation, has become more widely
available as it is easy to employ but has the drawback of less accurate measurement [4].
These methods will be further elaborated on in Chapter 2.
Due to the advantageous noninvasive feature of transcutaneous blood gas monitoring, it has
constantly been the focus of many doctors and biomedical engineers to improve the existing
commercial systems to achieve more effective measurements. Multi-disciplinary engineering
has been involved to develop many different types of transcutaneous blood gas systems based
on various technologies such as amperometry and optical means. In current measuring
procedures, the sensors come in contact with the patients' skin surface via a detachable
membrane. Hence the sensors are required to be prepared and sterilized before they can be
used again for the following measurement. After each application, these used membranes are
removed and new ones are placed manually. The electrolytes within the sensors are
replenished after approximately 4 to 6 hours of continuous usage. Generally, existing
commercial transcutaneous blood gas systems currently available in hospitals and clinics
adopt such maintenance practices. These prove to be inefficient and cumbersome, as the
replacement and alignment of the membranes must be carried out properly in order for the
sensor to function effectively. Improvements have been made to ease this procedure such as
screwing in the membrane instead of stretching and aligning the membrane over the sensor
tip [5]. However, several disadvantages such as trapping air bubbles while replacing the
Hence, there is a need for a new type of sensor that does away with all the cumbersome
membrane replacement procedure.
Thick film technology is a mature manufacturing technique used to fabricate large volumes
of devices at low cost [6]. It has evolved since the 1950s from being able to produce
replacements or alternatives to printed circuit boards to the current state-of-the-art densely
packed semiconductor hybrid devices. Electrochemical sensors fabricated using thick film
technology are deemed suitable for transcutaneous blood gas measurement, as they are
compact in size, low cost and easy to fabricate in bulk. Thorough and intensive research has
been carried out on both existing and new materials employed for the chemical composition
and design of these sensors. This is essential so that more accurate and desirable
measurement results of blood gas levels can be achieved. Experiments are subsequently
being carried out to investigate the behaviour of the sensors under atmospheric, hydrated and
clinical conditions.
1.2 Objectives and Scope of the Thesis
The main objective of this research project is to apply thick film technology to the fabrication
of transcutaneous blood gas measurement/monitoring sensors in order to achieve better and
more economical alternatives to existing commercial systems. Chapter 2 of this thesis begins
by presenting an overview of the medical instruments which are currently used in hospitals
and clinics for transcutaneous blood gas monitoring. This is followed by a brief explanation
of the correlation between the partial pressure of oxygen in arterial blood and the
corresponding transcutaneous measurement. The working principle of the intended sensor is
based on amperometry of an electrochemical Clark cell [7] and a detailed breakdown study of
the different materials employed for the electrodes, electrolytes and membranes is also
addressed in Chapter 2. An overview of thick film technology is also made available to
highlight the sensor development. In-house fabrication of the thick film sensors was carried
out to produce various types of sensors economically for tests and evaluations.
The ideal blood gas sensor should cater for the measurements of the partial pressure of
transcutaneous oxygen (PtcO2), the partial pressure of transcutaneous carbon dioxide (PtcCO2),
initial studies, the main investigations involved in this project were focused only on the
measurement of partial pressure of transcutaneous oxygen (PtcO2) levels. Oxygen sensor
prototypes were printed in-house in order to evaluate and understand the sensors in more
detail. The fabrication procedures of these sensors using the technique of thick film printing
are presented in Chapter 3. The sensors require the support of electronics modules for
effective operation and measurement. The design and construction of the electronics aspects
such as the potentiostat circuit and heater circuit module are further elaborated on also.
In view of enhancing the geometrical layout as well as the electrolyte and membrane
materials, preliminary theoretical modeling on the effects of diffusion rates is evaluated in
Chapter 4. This technique facilitates the initial understanding of sensor design and enables
improvements to be implemented easily. A one-dimensional diffusion model based on the
four-electron stoichiometry of the oxygen cathode reaction [8] was employed and it involved
simple mathematical evaluations based on several valid assumptions.
Chapter 5 covers a series of experiments, which focus individually on the effects of different
parameters on the sensors. Different types of electrolytes and membranes are investigated
under the influences of temperature, humidity changes and the levels of biasing voltage to the
electrochemical sensors. A comprehensive discussion is presented in Chapter 6 to evaluate
the results obtained from these experiments. In addition, a closer look is taken at the
problems encountered to explain the validity of these results. Studies were also carried out to
understand the effects of different salt concentrations and pH levels on the overall measured
output. Finally, conclusions are drawn from all the investigations and some future work is
also suggested to branch out the research topic into different possible avenues.
1.3 Specifications of Sensor Prototype
Much emphasis and effort is placed in the design and development of a novel transcutaneous
oxygen sensor prototype as opposed to the existing systems. In general, the ideal sensor
prototype should possess the following specifications.
(a) Low cost
sensor, which requires consumables equivalent to €2.50. The prices would reduce
as the product volume per batch increases.
(b) Use for longer period of time
Each prototype should be capable of making continuous measurements for up to
30 hours without replacement as compared to replenishing and maintaining the
existing sensor every 3 to 4 hours.
(c) Power consumption
The electronics modules include the potentiostat and the heating controller
circuit. Generally, both circuits have been designed to adopt ±12V d.c. voltage
supply. A relatively large amount of current (0.15 A) is drawn from the supply in
order to power up the heating element. Ideally, the electronic modules should be
supported by power supplies from both a.c. mains with appropriate transformers
for normal on-site operation as well as rechargeable high-powered batteries for
backup purposes.
(d) Portable / Light weight
As the sensor is to be attached onto the surface of the patient's skin, it has to be
light weight and cause no hindrance. The patient may be moved about and having
a sensor that is portable proves to be helpful.
(e) Compact
To cater for measurements on babies as well as grown-ups, the sensor needs to be
physically small. Hence, considerations for the design must be given towards
compactness in order to fit the whole oxygen monitoring module onto a limited
amount of working area.
(f) Disposable
sterilization. These procedures proved to be relatively time consuming and
expensive. If the sensor is made disposable, it enhances cost effectiveness and
also maintains a high standard of hygiene within the hospital environment.
(g) Non-biohazardous
The application of the sensor requires a high standard of safety since it comes in
direct contact with the patient. There must not be any biohazardous
electrochemical by-products during the reactions.
(h) Accurate
Each sensor type usually produces a unique and calibrated set of readings. It is
important that medical doctors are informed of the relative changes in partial
pressure of oxygen in the arterial blood in order to determine the status of the
respiratory system. Thus, the corresponding absolute value is not essential, which
relieves the need for extremely high accuracy in the sensor. Using the general
specifications of existing commercial transcutaneous monitoring systems, the
level of errors allowed should not be more than 5%. Hence, a reasonable
sensitivity magnitude of the sensor would be approximately 1 µA / mmHg.
(i) Quick response
Each sensor should respond quickly to possible variations in oxygen levels,
ideally reaching steady state measurements within 1 second. This proves to be
necessary for continuous monitoring.
(j) User-friendly
Within a complex working environment such as the surgery rooms in a hospital,
equipment is connected to the patients for the recording of different medical
parameters. The daily maintenance and application of the equipment is carried
out by the medical staff, who are often very busy and not technically trained.
Hence, a high degree of user-friendliness is greatly encouraged. This allows
(k) Easy to integrate and implement
The sensor design should be compatible with future upgrading and also conform
to standard operating conditions such as voltage supply for possible integration
into a larger general system.
In an attempt to satisfy these basic specifications for the desired new sensor design, thick film
technology has been employed to explore the possibilities.
1.4 Contribution of the Research
This research project integrates the knowledge from different disciplines to develop a
transcutaneous blood gas sensor. The technique of transcutaneous measurement and thick
film technology are fairly mature. These aspects are applied to assist in the investigation of
producing a new electrolyte material that is printable by means of thick film technology. The
prototype also displays good accuracy and reliability in its measurement. The final sensor
will then be presented to medical practitioners as a novel and cost effective biomedical
Chapter 2
Literature Review
2.1 Blood Gas Monitoring
The measurement of partial pressures of oxygen (PaO2) and carbon dioxide (PaCO2) in
arterial blood is essential for monitoring the conditions of patients, especially premature or
newborn babies who are suffering from respiratory difficulties. The typical value of PaO2 in
the blood stream is approximately 75 to 100 mmHg for normal healthy human beings. The
need for oxygen monitoring in pediatric and adult intensive care units is constantly required.
Results from blood gas pressure monitoring could be used to denote disconnection due to
failed oesophageal intubation more rapidly. This may prevent considerable periods of
hypoxia, which often result in permanent brain dysfunction [9]. In addition, dangerous
changes in oxygen concentration in the inspired gas may also indicate intrapulmonary
shunting as well as other disturbances of ventilation and perfusion. In many cases, acute
episodes such as pulmonary oedema [10], collapse and tension pneumothorax [11] could
prove to be fatal. Another important application for monitoring the oxygen level is to control
the anesthesia treatment for patients undergoing surgery [12]. There are several methods
currently available in clinical practices to measure and monitor blood gases. These include
blood sample analyzing via a blood gas analyzer, oximetry and transcutaneous blood
monitoring. Generally, most of these systems can measure between a 20 mmHg and 500
mmHg partial pressure of oxygen.
For blood sample analysis, blood is extracted into a syringe, usually from an in-dwelling
arterial or venous catheter or for babies, directly into a capillary tube from a heelprick. At
times, if the blood is required to be kept prior to analysis, heparin is usually added to prevent
coagulation. During the evaluation of the blood gas levels and ionic contents, the blood
sample is injected into a commercial blood gas analyzer such as the CIBA CORNING 800
series [13]. The blood is fed into the system and flows through several chambers via fine
capillary tubes. Each chamber houses a different type of membrane that is porous to the
desired blood gas or ionic content under test. The chamber contains a measuring electrode
and an aqueous electrolyte solution in an electrochemical cell set-up. The blood gases
oxygen (PaO2), the partial pressure of carbon dioxide (PaCO2) and the pH level. At the same
time, the ionic contents such as potassium (K+), sodium (Na+), calcium (Ca+) and chloride (Cl-) are also reflected in the measured results. Often, these commercial blood gas analyzers also provide measurements of other useful parameters such as glucose and haematocrit levels.
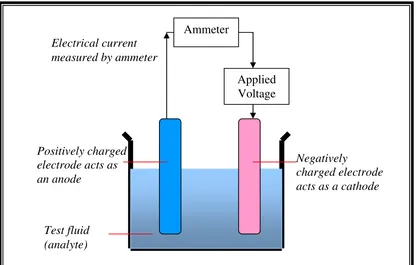
The main working principle for the blood gas level and ionic concentration measurements in
each chamber of this analyzer is based on amperometry of an electrochemical cell. Figure 2.1
shows a general schematic representation of a typical two-electrode electrochemical cell. A
fixed voltage is applied between the two electrodes of the cell. A current generated as a result
of the oxidation or reduction reaction on the electrodes is measured. More detailed
discussions on amperometry will be presented in section 2.3.
[image:33.595.119.536.295.560.2]
Figure 2.1: General Schematic Representation of an Electrochemical Cell Demonstrating Amperometry
There are also other types of blood gas analyzers that employ optical means of measurement.
One such method uses absorption changes by the chemical compounds found in the blood,
which are excited to a higher energy state when subjected to a laser light source. It is found
that in many engineering fields such as computer and communication engineering, there is a
common trend to divert from conventional methods to advanced optical measurement in
order to gain significant improvements in terms of accuracy and stability. Ammeter
Applied Voltage
Electrical current measured by ammeter
Positively charged electrode acts as an anode
Negatively
charged electrode acts as a cathode
Although the results obtained from the blood gas analyzers using sampled blood are accurate
with respect to the contained arterial blood, they are neither real-time nor continuous. Hence,
the measurements could prove useless in cases of emergencies where the condition of the
patient must be monitored instantaneously to reflect his actual medical situation. With
continuous monitoring, the doctors will be well informed of all parameters and hence the
medical status of the patient. This enables diagnosis to be carried out more effectively.
Another major disadvantage of these analyzers is cost. Each analyzer costing up to
approximately £20,000 to £30,000. In addition, a conservative estimate of the daily
consumables required to maintain the system in a hospital environment averages to
approximately a few hundred pounds sterling, depending on the amount of use [13]. With
such high expenditure, smaller medical centers and private practitioners could not afford to
have such systems. To overcome most of these shortcomings, pulse oximetry [14] has been
developed to measure the oxygen saturation continuously by using the differential light
absorbency of two wavelengths of the light transmitted through the tissues. This simple,
non-invasive technique is the brainchild of a Japanese bioengineer, Takuo Aoyogi [14].
In this measuring method, light passing through a living tissue, namely the ear or the finger
will be partially absorbed by each constituent such as the skin pigments, tissue, cartilage,
bone, arterial blood and venous blood. This is shown in the measurement setup in Figure 2.2.
As further illustrated in Figure 2.3, the pulse oximeter measures the absorption of selected
wavelengths of the light source that pass through the living tissue sample. For a given site,
the absorption is constant except for the absorption from added blood volume due to arterial
pulsations. This varying absorption is translated into a waveform at both red and infrared
wavelengths. These absorbances (A) are additive and obey the Beer-Lambert law [14], given
by Equation (2.1):
DC I
I T
A=−log =log 0 =ε
where I0 and I are the incident and transmitted light intensities respectively, ε is the extinction
coefficient, D is the depth of the absorbing layer and C is the concentration of oxygen. It can
be observed that absorbance is directly proportional to the oxygen concentration.
Figure 2.2: Measurement Set-up for Pulse Oximetry [14]
Figure 2.3: The Principle of Pulse Oximetry [14]
Pulse oximetry is employed to perform non-invasive and continuous measurement. In
addition, it responds rapidly to significant desaturation and detects transient variations
effectively. However, pulse oximeters are susceptible to movement artefacts [14] such as
shivering, but this limitation does not reduce the need for the device. Roger A. Wolthuis et al.
[15] developed a fibre optic oxygen sensor based on optical adsorption change for medical
applications in 1992. The focus of his research was also based on the luminescence of
chemical compounds in the blood upon excitation to a higher energy state. The luminescence
A
bs
or
pt
ion
Variable Absorption due to Pulse Added Volume of Arterial Blood
Absorption due to Arterial Blood
Absorption due to Venous Blood
Absorption due to Tissue
TIME
Finger Light Source
intensity could then be correlated to the partial pressure of oxygen. The sensor's viologen
indicator becomes strongly absorbent after brief ultraviolet stimulation and then it returns to
its original transparent state. The rate of the indicator returning back to the transparent state is
proportional to the local oxygen concentration. Caution is practiced to avoid burns from
prolonged skin contact in hypothermic or hypovolaemic patients. This technique however
provides no information on the partial pressure of carbon dioxide (PaCO2).
A more comprehensive method of blood gas analysis could be achieved by employing
transcutaneous monitoring. It provides continuous and reliable trend information on the
body's ability to deliver oxygen to the tissue and respective organs via oxygenated blood.
This technique also provides early warning on the onset of problems and reduces the need for
blood sampling as required by the blood gas analyzers. The principles of transcutaneous
monitoring are based on the fact that the elevation of skin temperature increases the
cutaneous blood flow and hence the partial pressure of oxygen and carbon dioxide can be
measured as the skin becomes permeable to gas diffusion [16].
2.2 Transcutaneous Blood Gas Monitoring
Transcutaneous monitoring of PaO2 and PaCO2 eliminates the need for the extraction of blood
samples. Continuous monitoring enables sudden changes in the blood gas levels to be
detected almost instantaneously. Generally, the analysis of a blood sample is only required
when continuous monitoring justifies it for more accurate and absolute measurement results.
It also provides early warning for sudden changes in the blood gas levels during monitoring.
This advantage enables the medical staff to be informed of the patient's ongoing conditions
so that proper attention and treatment can be given in time.
By increasing the temperature of the skin surface, the cutaneous blood flow is excited and
causes the tissue to dilate. This increases blood flow, which subsequently causes the tissues
in the desired area to be filled with arterial blood. At elevated temperature, the skin becomes
permeable to gas diffusion as the pores expand. Therefore, the oxygen molecules in the blood
diffuse through the tissue (epidermis layer) and reach the surface of the sensor. The oxygen
where a redox reaction occurs. This way, transcutaneous oxygen measurements can be
carried out.
In 1979, O. Lofgren et al. [17] carried out experiments to determine the effects of different electrode temperatures on the partial pressure for transcutaneous oxygen levels (PtcO2). It was
found that the choice of electrode temperature is important, as a higher temperature is
desirable to obtain adequate arterialization while a sufficiently low temperature is preferred
in order to minimize the risk of burns on the skin surface. In short, a clever balance should be
reached for optimum results. In their research analysis, a commercially available sensor from
RADIOMETER [18] to measure PtcO2 from 42 °C to 46 °C was employed. The conclusions
of their studies reflected that for this equipment, the percentage error for the measurements
made between the desired temperature range is between ±1.5% (for normal healthy patients)
to ±20% (for extreme hyperoxia or hypoxia cases). By performing repeated experiments, the
optimal temperature of the electrode was estimated at an average of 44.5 °C. Each operating
temperature varied slightly from one type of sensor to another due to the small differences in
composition and construction. However, in general, a suitable temperature adopted for
transcutaneous measurement is approximately 44 °C [19]. Although it is not a significantly
high temperature, the skin of the patient especially babies may suffer mild blistering when
subjected to long term monitoring. In order to minimize the negative effects, the sensor
usually has its position changed after a continuous measurement of about 3 to 4 hours.
The measured transcutaneous results usually differ from those obtained by the blood sample
tests. This difference is observed because the transcutaneous measurements are obtained from
the gas tension underlying the skin tissues and not from the arterial gas tension. In other
words, the transcutaneous oxygen level is under the influence of the blood flow to the skin
and hence, oxygen is consumed in the subcutaneous tissue [1]. Gas tension in a liquid such as
blood is equivalent to the partial pressure of the gas at the surface of the liquid at equilibrium.
In 1981, D. W. Lubbers [20] worked out a theoretical model where transcutaneous blood gas
level can be quantified with respect to the arterial blood gas concentration during maximum
dilation of the local vasculature in the upper dermis.
Figure 2.4 depicts the layers of tissue and the skin structure through which oxygen diffuses in
structured differently, the equation describing the relationship between PtcO2 and PaO2 is not
entirely the same.
From Fenner's experiment [22], it was found that transcutaneous measurement appeared
reliable but there were occurrences of inconsistencies in the relationship with respect to
arterial measurement. A. Fenner et al. investigated the transcutaneous determination of arterial oxygen tension in 1975 on newborn infants. They tested two groups of infants during
normoxia and hyperoxia using two different methods. The data of PaO2 and PtcO2 collected
from the experiments ranged from 100 mmHg to 600mm Hg. Regression estimates were
applied to the data obtained and it was observed that a linear relationship could be established
between the transcutaneous blood gas level and the corresponding arterial blood gas level,
with a gradient of approximately 1. This shows that PtcO2 is directly proportional to PaO2.
Correlation and proper calibration ought to be performed in order to relate the transcutaneous
measurements and their corresponding arterial values for individual cases.
Figure 2.4: Layered Structure of Skin [21]
In 1991, Steven Keston et al. [9] characterized a transcutaneous monitoring system with healthy subjects who breathed various gas mixtures and the steady-state transcutaneous
readings were compared to the simultaneous arterial blood gas analysis. Agreeing with
proportional to the arterial blood gas level. Although a linear relationship was found, there
was wide variability among the subjects under test. Transcutaneous measurements are
problematic as they reflect both the arterial and tissue gas tensions, which are affected by
capillary blood flow [23], cardiac output [24] and metabolic processes [25]. However, strong
advantages such as easy application, patients comfort and fast responses prove to be more
important than the existing problems. Hence, transcutaneous measurement is still welcomed
by many medical professionals.
Currently, there are several commercial transcutaneous blood gas analyzers available and
used in hospitals all over the world. The sensors are electrochemical cells based on the
working principle of amperometry. An example of such equipment includes the TCM-3
model blood gas analyzer from Radiometer Copenhagen [18] as seen in Figure 2.5. It has
good display panels and is very portable, which provides a high level of user-friendliness in
aiding medical staff to carry out tests on patients. However, the TCM-3 blood gas analyzer
possesses several disadvantages such as high cost in maintenance and replacement of
consumables. In addition, for it to function efficiently over a longer monitoring period, saline
has to be repeatedly applied to the surface of the sensor at intervals of 3 to 4 hours. This is
carried out in order to replenish the depleted solvent in the sensor during the measurement so
as to avoid sensor damage and inaccurate results.
Figure 2.5: Commercial Transcutaneous Monitoring System from Radiometer [18]
Sensors Diameter of
Another example of the transcutaneous blood analyzer that is commercially available and
works on amperometry measurement is the PO-550 from Sumitomo Electric [26]. Figure 2.6
briefly presents a block diagram of this monitoring system.
Figure 2.6: Block Diagram of PO-550 (Sumitomo) Monitoring System
It provides user-friendly features such as good printouts and simple operating procedures.
This particular equipment is very useful as it combines the measurement of partial pressure of
oxygen (PtcO2) and partial pressure of carbon dioxide (PtcCO2) using a single sensor. This
breakthrough in technology has allowed convenience in measurement and is the key
advantage of this equipment. However, there are several disadvantages in this system.
Although they provide continuous, fast responding measurements, the sensors need to be
prepared properly before use. The sensor in this system plays an important part of the
measuring instrument and it has been manufactured and calibrated to give optimum results.
Hence, it is costly and re-used after each measurement. The membrane is usually made of a
disposable material that must be replaced for hygiene purposes. There are several procedures
required to replace the membrane such as stretching the membrane over the sensor tip or
tightening the membrane by screwing onto the sensor tip. In order to achieve good
measurements, the membrane and sensor require good contact. The person carrying out this
replacement requires some experience to replace the membrane properly. Improvements have
been made over the years to ease this inconvenience so that inaccuracy in measurement due
to improper fitting of the membrane has been minimized. Despite this, the idea of having a
totally disposable sensor has always been welcomed by both medical and engineering PtcO2/ PtcCO2
Monitor
Automatic calibrator
Calibration gas
Gas Regulator
Sensor
Control signal
professionals. This new sensor must be cost effective, easy to manufacture, accurate and
compact for making transcutaneous blood gas measurements.
After understanding the basic medical requirements of transcutaneous measurement, the
design and working principles of the desired sensor from the engineering point of view can
be reviewed.
2.3 Electrochemical Principles
The conventional method of analyzing blood samples is carried out by means of a Clark
electrode, which was first discovered in 1956 by Dr Leland Clark [7]. In general, the typical
oxygen sensor is an electrochemical Clark cell that comprises electrodes in contact with
electrolytes. A suitable membrane is then placed over the cell to allow the desired gas to
diffuse through. The working principle of the sensor is based on amperometry, which is
affiliated to the oxygen reduction reaction of the electrochemical cell. The method of making
transcutaneous measurements via a sensor requires the inclusion of an in-built heating device.
2.3.1 The Function of the Materials within a Clark Cell
In order to have a better appreciation of the working principles and sensor design, a
fundamental understanding of electrochemistry and redox reactions is presented. Electrodes
are defined as the solid electrical conductors where current enters or leaves the electrolytic
cell. In a simple two-electrode electrochemical cell, one of the electrodes is made of a noble
metal such as Platinum (Pt) or Gold (Au) as they are thermodynamically stable with respect
to oxidation. In other words, these metals will not corrode under normal environmental
conditions. The gold or platinum electrode is connected to the negative voltage potential for
reduction of oxygen to occur. This electrode is known as the cathode. The other electrode is
referred to as the anode and it is connected to the positive voltage potential for the oxidation
half-reaction. When a potential of approximately -0.6V is applied across the two electrodes
through a suitable electrolyte, a current proportional to the partial pressure of oxygen which
diffused onto the surface of the electrodes will be produced [7, 27-79]. The Ag/AgCl anode
acts as the reference electrode as it has a constant electrochemical potential when there is no
used at higher temperatures with low temperature coefficients. It is the best general purpose
reference with a wide temperature range of -5 to +110°C [30].
At different biasing potentials, different reduction processes could occur [31]. The oxygen
molecules are electrolyzed at the cathode by the following two-electron reactions:
−
− → +
+
+2H O 2e H O 2OH
O2 2 2 2
− −→
+2e 2OH O
H2 2
The oxygen molecules reach the cathode via diffusion and reduce to hydroxyl ions and
hydrogen peroxide components in the presence of H2O provided by the electrolyte solution.
Upon further reaction, the hydrogen peroxide reduces more to give another set of hydroxyl
ions. The reaction tends to increase alkalinity in the medium. If an increase in pH takes place,
a two-step mechanism of 2-electron reaction as described in Equations (2.2) and (2.3) will
predominate. In more recent studies, Bianchi [32] found that in a solution where a high
concentration of hydrogen peroxide was present, the oxygen reduced to hydroxyl ions
directly in a four-electron mechanism given by:
− −
→ +
+2H O 4e 4OH O2 2
These reactions cause an electrolytic current to flow and the current is proportional to the
oxygen concentration in the blood. This phenomenon can be observed from an output current
vs input biasing voltage graph, called a voltammogram [31]. If the biasing voltage is further
increased to beyond -1.5V, hydrogen evolution will occur via the following chemical
equation:
2H2O+2e− →H2+2OH−
The cyclic voltammograms give pictorial representations of all the reactions occurring at
different input biasing potentials. In a two-electrode configuration, the electrolyte needs to be
replenished in order to maintain charge balance. Generally for an Ag/AgCl anode, the
reaction is given by:
− −
+ →
The chloride ions are oxidized to provide the anode with electrons in order to complete the
electrochemical circuit. Effectively, there is no net consumption or gain of electrons in this
equilibrium situation.
2.3.2 The Function of Aqueous Salt Electrolytes and Membranes and their Materials
As the surface area of the silver electrode and the chloride (Cl-) ion concentration is sufficiently large, the reaction does not affect the overall electrolytic current. A glass
insulator is placed around the cathode wire to localize the oxygen sensitivity to an area very
close to the point of contact. The electrodes are then placed in a well of electrolyte, which is
usually of chloride ion bases such as sodium chloride (NaCl) or potassium chloride (KCl).
The definition of an electrolyte is a chemical compound (salt, acid or base) that dissociates
into electrically charged ions when dissolved in a solvent. In other words, the electrolyte
becomes an electrically conductive medium upon ionization. In the event of this, any of the
various ions, such as sodium, potassium, or chloride, are required by cells to regulate the
electric charge and flow of water molecules across the cell. The resultant electrolyte solution
[image:43.595.90.541.450.714.2]is then an ionic conductor.
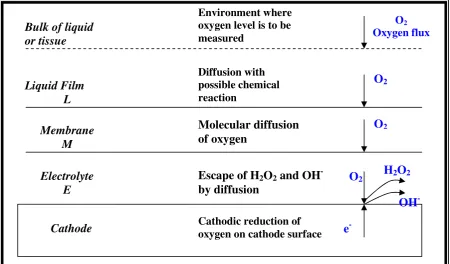
Figure 2.7: Diffusion Path of the Oxygen Molecule
Environment where oxygen level is to be measured
O2 Oxygenflux Bulk of liquid
or tissue
Diffusion with possible chemical reaction
O2
Liquid Film L
Molecular diffusion of oxygen
O2
Membrane M
Escape of H2O2 and OH -by diffusion
O2
Electrolyte E
Cathode Cathodic reduction of oxygen on cathode surface e
-H2O2
-The working principle of the electrolyte solution is to allow the substitution of hydroxyl ions
from the cathodic reaction with the chloride ions within the electrolyte. Ionic conduction
through the electrochemical cell will be carried out by these chloride ions. If there is an
excess of hydroxyl ions, then the electrolyte will be depleted of chloride ions. Hence, there is
a need for the electrolyte to be replenished. Another important function of the electrolyte
material is to ensure transport control in the membrane. The electrolyte should be sufficiently
thin, usually not thicker than the membrane.
The membrane is a thin layer of material that is porous to the desired measurand, in this case
oxygen. The membrane is often necessary to control the amount of oxygen from the bulk
material into the sensor. This is to avoid flooding the pores of the electrolyte which
eventually prevents the ionic conduction process. If the membrane layer is too thin, it may
not serve the purpose of controlling the ionic-exchange transport mechanism within the
sensor
![Figure 2.2: Measurement Set-up for Pulse Oximetry [14]](https://thumb-us.123doks.com/thumbv2/123dok_us/1012105.616021/35.595.103.542.332.567/figure-measurement-set-pulse-oximetry.webp)