Volume 2013, Article ID 164246,8pages http://dx.doi.org/10.1155/2013/164246
Research Article
Characterising Cytokine Gene Expression Signatures in
Patients with Severe Sepsis
Robert Grealy,
1Mary White,
1Patrick Stordeur,
2Dermot Kelleher,
1Derek G. Doherty,
3Ross McManus,
1and Thomas Ryan
11Department of Clinical Medicine, Institute of Molecular Medicine, Trinity College Dublin, St James’s Hospital, Dublin 8, Ireland
2Service d’Immunologie, Hˆopital Erasme, Brussels, Belgium
3Department of Clinical Immunology, Institute of Molecular Medicine, Trinity College Dublin, St James’s Hospital, Dublin 8, Ireland
Correspondence should be addressed to Thomas Ryan; thomasryan1958@gmail.com
Received 13 March 2013; Revised 13 May 2013; Accepted 15 May 2013
Academic Editor: Vera L. Petricevich
Copyright © 2013 Robert Grealy et al. This is an open access article distributed under the Creative Commons Attribution License, which permits unrestricted use, distribution, and reproduction in any medium, provided the original work is properly cited.
Introduction. Severe sepsis in humans may be related to an underlying profound immune suppressive state. We investigated the
link between gene expression of immune regulatory cytokines and the range of illness severity in patients with infection and severe sepsis.Methods. A prospective observational study included 54 ICU patients with severe sepsis, 53 patients with infection without organ failure, and 20 healthy controls. Gene expression in peripheral blood mononuclear cells (PBMC) was measured using real-time polymerase chain reaction.Results. Infection differed from health by decreased expression of the IL2, and IL23 and greater expression of IL10 and IL27. Severe sepsis differed from infection by having decreased IL7, IL23, IFN𝛾, and TNF𝛼gene expression. An algorithm utilising mRNA copy number for TNF𝛼, IFN𝛾, IL7, IL10, and IL23 accurately distinguished sepsis from severe sepsis with a receiver operator characteristic value of 0.88. Gene expression was similar with gram-positive and gram-negative infection and was similar following medical and surgical severe sepsis. Severity of organ failure was associated with serum IL6 protein levels but not with any index of cytokine gene expression in PBMCs.Conclusions. Immune regulatory cytokine gene expression in PBMC provides a robust method of modelling patients’ response to infection.
1. Introduction
Severe sepsis, an overwhelming inflammatory response to an underlying infection, remains a lethal disease that is present in over a third of European intensive care patients [1]. In previous studies this group reported a link between gene expression of specific immune regulatory cytokines in peripheral blood mononuclear cells (PBMC) and the presence of severe sepsis in patients with infection [2–5]. The specific cytokine groups whose differential expression were most closely associated with severe sepsis included the T-cell homeostatic cytokines IL2 and IL7 [6]; cytokines modulating the interaction between innate and adaptive immunity, namely, IL23 and IL27 [7]; and cytokines enhanc-ing bactericidal activity, namely, TNF𝛼and IFN𝛾[8]. In these preliminary studies differential gene expression of a range of other cytokines, such as TGFb-1 were weakly linked, or
such as IL1𝛽, IL4, IL12, and IL18 were not linked, with the occurrence of severe sepsis in patients [9].
In this new study, we sought to validate the findings of our initial studies into a single larger study in a new cohort of patients, integrating all of the cytokines most closely related to the occurrence of severe sepsis identified from prior individual studies. In addition we planned to recruit equal numbers of patients with infection and severe sepsis in order to more accurately characterise cytokine gene expression signatures specific to severe sepsis as opposed to infection. Lastly we derived an index of cytokine gene expression in order to test the strength of the association between cytokine gene expression and the presence of severe sepsis in patients with infection.
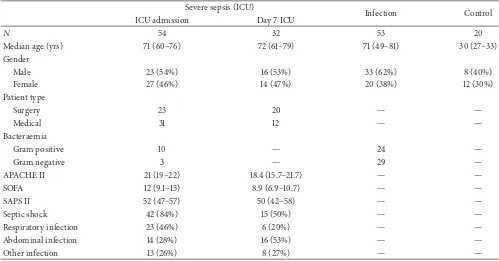
Table 1: Demographics of patients recruited to study. Values expressed as means and 95% confidence intervals.
Severe sepsis (ICU)
Infection Control
ICU admission Day 7 ICU
𝑁 54 32 53 20
Median age (yrs) 71 (60–76) 72 (61–79) 71 (49–81) 30 (27–33)
Gender
Male 23 (54%) 16 (53%) 33 (62%) 8 (40%)
Female 27 (46%) 14 (47%) 20 (38%) 12 (30%)
Patient type
Surgery 23 20 — —
Medical 31 12 — —
Bacteraemia
Gram positive 10 — 24 —
Gram negative 3 — 29 —
APACHE II 21 (19–22) 18.4 (15.7–21.7) — —
SOFA 12 (9.1–15) 8.9 (6.9–10.7) — —
SAPS II 52 (47–57) 50 (42–58) — —
Septic shock 42 (84%) 15 (50%) — —
Respiratory infection 23 (46%) 6 (20%) — —
Abdominal infection 14 (28%) 16 (53%) — —
Other infection 13 (26%) 8 (27%) — —
SOFA: sequential organ failure assessment score; SAPS II: simplified acute physiology score; APACHE: acute physiology and chronic health evaluation.
2. Materials and Methods
The study was conducted in St James’s Hospital, Dublin, Ire-land. Approval was obtained from St James’s Hospital Ethics Committee and informed written consent was obtained from each patient or next of kin. Exclusion criteria included (a) malignancy, (b) chemotherapy, (c) infection with human immunodeficiency virus, (d) immunosuppressive therapy including long-term corticosteroids, and (e) immunological disease. Three patients groups were recruited.
Patients presented with severe sepsis as an admitting diagnosis to the intensive care unit were enrolled. Patients satisfied the criteria of (i) a documented bacterial infection by clinical and/or microbiological evidence and (ii) severe sepsis, with at least one severe sepsis-related organ failure. In patients with severe sepsis, blood sampling was performed upon admission to intensive care within 48 hours of meeting the inclusion criteria and/or 7 days after meeting the inclu-sion criteria.
Severity of illness was characterized upon admission to ICU using the Simplified Acute Physiology Score (SAPS II) [10] and the sequential organ failure assessment (SOFA) scoring systems on day 1 and again on day 7 [11]. The source of infection necessitating the ICU admission and the occurrence of an ICU death or survival to ICU discharge were recorded.
Hospital in-patients with clinical and bacteriological evidence of infection who did not develop organ failure were recruited. In order to avoid recruiting patients with trivial infection or patients with systemic illness misdiagnosed as infection, patients with infection and a confirmed bacter-aemic episode but no organ failure were recruited. In the infection group, blood sampling was performed within 24
hours of the first reported positive blood culture authorised by a consultant microbiologist.
Twenty healthy hospital staff and laboratory co-research-ers were recruited and informed consent was obtained. Blood sampling from healthy controls was at one time point only.
Peripheral blood mononuclear cells were isolated by density centrifugation, lysed, and stored at −80∘ following isolation. Total RNA was extracted using the RNeasy kit (Qiagen, Crawley, West Sussex, UK). Absolute quantification of gene expression was determined using TaqMan Gene expression assays performed on an ABI Prism 7000 or ABI 7900 HT (Applied Biosystems). Interleukin-6 protein measurement was determined by ELISA (Quantikine, RnD Systems, Minneapolis, MN, USA). Immune phenotyping of peripheral mononuclear cells was performed on a Beckman Coulter Cyan ADP Cytometer. Further details of these meth-ods are provided in AppendixA.
Groups were compared using Wilcoxon rank sum test and Kruskal-Wallis test, with Bonferroni correction for mul-tiple comparisons. Spearman rank correlation coefficient was used to analyse the relation between continuous parameters. Gene expression in patient groups was compared by logistic regression analysis. Data analysis was performed using JMP 9.0 statistical package (SAS, Cary, NC, USA).
3. Results
Table 2: Lymphocyte subsets in patients with severe sepsis and healthy controls. All values are median and interquartile range. Analysis is by Wilcoxon rank sum test.
Controls Sepsis 𝑃
𝑁 6 6
T lymphocytes
CD3+CCR7+CD45RA− (%) 6 (1.3–12.9) 4.2 (2.7–10) ns
CD3+CCR7low CD45RA− (%) 23.5 (20–31.3) 21 (17–28.8) ns
CD3+CCR7+CD45RA+ (%) 12.7 (4–24.6) 7.6 (5.3–17) ns
CD3+CCR7−CD45RA+ (%) 28.2 (6.6–43) 18.1 (14.1–24) ns
CD3+CD127+(%) 55 (53–59) 37 (26–43.6) 0.004
CD3+CD127− (%) 17.5 (14.2–21) 18.7 (7.1–24.7) ns
CD16+CD56+(%) 8.3 (4.9–12.3) 1.9 (1–14) ns
Monocytes
CD14+ 3.1 (2.8–3.2) 1.5 (1.3–2.9) ns
CD16+ 1.6 (0.8–3.2) 0.6 (0.4–1.2) 0.06
CD14+/16+ 0.1 (0.1–0.2) 0.2 (0.1–1) ns
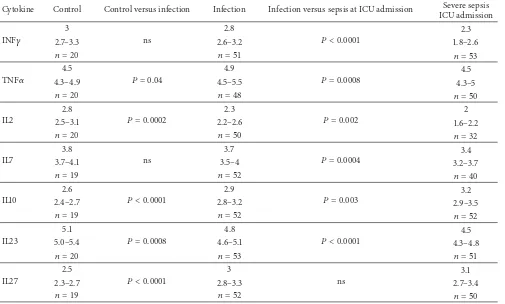
Table 3: Cytokine mRNA levels in patients with severe sepsis and controls. Values denote copy numbers expressed as log10per 107 copy
numbers𝛽-actin. Values are expressed as medians and interquartile ranges. Analysis by Wilcoxon rank sum test between healthy controls, patients with mild sepsis and severe sepsis day 1.
Cytokine Control Control versus infection Infection Infection versus sepsis at ICU admission Severe sepsis ICU admission
INF𝛾
3
ns
2.8
𝑃 < 0.0001 2.3
2.7–3.3 2.6–3.2 1.8–2.6
𝑛 = 20 𝑛 = 51 𝑛 = 53
TNF𝛼
4.5
𝑃 = 0.04
4.9
𝑃 = 0.0008 4.5
4.3–4.9 4.5–5.5 4.3–5
𝑛 = 20 𝑛 = 48 𝑛 = 50
IL2
2.8
𝑃 = 0.0002
2.3
𝑃 = 0.002 2
2.5–3.1 2.2–2.6 1.6–2.2
𝑛 = 20 𝑛 = 50 𝑛 = 32
IL7
3.8
ns
3.7
𝑃 = 0.0004 3.4
3.7–4.1 3.5–4 3.2–3.7
𝑛 = 19 𝑛 = 52 𝑛 = 40
IL10
2.6
𝑃 < 0.0001
2.9
𝑃 = 0.003 3.2
2.4–2.7 2.8–3.2 2.9–3.5
𝑛 = 19 𝑛 = 52 𝑛 = 52
IL23
5.1
𝑃 = 0.0008
4.8
𝑃 < 0.0001 4.5
5.0–5.4 4.6–5.1 4.3–4.8
𝑛 = 20 𝑛 = 53 𝑛 = 51
IL27
2.5
𝑃 < 0.0001
3
ns
3.1
2.3–2.7 2.8–3.3 2.7–3.4
𝑛 = 19 𝑛 = 52 𝑛 = 50
blood samples at ICU admission; 50 patients with severe sepsis had samples 7 days after ICU admission, with 19 of these severe sepsis patients having samples drawn at ICU admission and 7 days later (Figure1).
Immunophenotyping from patients with severe sepsis and healthy controls is detailed in Table 2. CD3+ CD127+ lymphocytes, a population of na¨ıve and memory T cells, were decreased in septic patients.
[image:3.600.51.556.328.632.2]ICU admission
Day 7 ICU
19
[image:4.600.69.275.72.190.2]35 31
Figure 1: Number of patients with severe sepsis: blood was drawn for study at ICU admission, at day 7 of ICU admission, or both.
regression, comparing cytokine gene expression in health and infection, IL10 (𝑃 = 0.02), IL23 (𝑃 = 0.01), IL27 (𝑃 = 0.01), and TNF𝛼(𝑃 = 0.03) were significantly different. The area under a receiver operator curve for this regression model was 0.97.
In patients with infection, cytokine gene expression was similar in patients with gram-positive and gram-negative infection.
When patients with infection and patients with severe sepsis on ICU admission were compared, IL2, IL7, IL23, IFN𝛾, and TNF𝛼gene expression was lower in patients with sepsis, while IL-27 gene expression was similar in these two groups (Table 3). Upon correction for multiple comparisons IL10 gene expression was greater in patients with severe sepsis. In a multivariate nominal logistic regression model comparing gene expression in patients with infection and those with sepsis at ICU admission, IL10 (𝑃 = 0.02), IFN𝛾(𝑃 < 0.0001), and TNF𝛼(𝑃 = 0.03) retained statistical significance. The area under a receiver operator curve for this regression model was 0.88, with cut-off values of 3.1 for IL10, 2.5 for IFN𝛾, and 4.75 for TNF𝛼.
At the time of ICU admission cytokine gene expression was similar in the severe sepsis patients with medical or surgical illness (AppendixB).
In the 19 septic patients with cytokine gene expression assayed on ICU admission and after 7 days of ICU stay, after Bonferroni correction for multiple comparisons, cytokine gene expression did not change over time (Appendix B). When gene expression for all patients with samples at the time of ICU admission was compared with all patients with gene expression data on the seventh day of ICU admission, cytokine gene expression was similar at ICU admission and 7 days later (AppendixB).
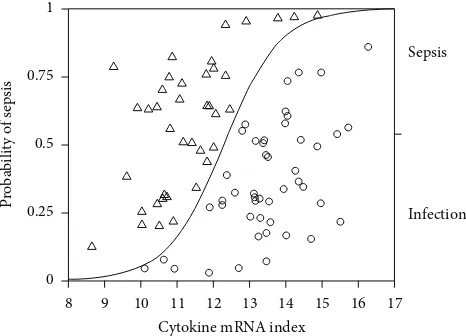
An index of cytokine gene expression was derived. This cytokine gene expression index consisted of the difference in log mRNA copy numbers for cytokines that were decreased in sepsis, namely, IFN𝛾, TNF𝛼, IL7, and IL23, and the cytokine increased in sepsis, namely, IL10 (IFN𝛾+ TNF𝛼+ IL7 + IL23– IL10). IL2 was excluded from this score as it was not assayed in all patients.
This index was significantly different in healthy controls (median 14.2, interquartile range 13.6–15.3,𝑛 = 18), patients with infection (median 13.5, interquartile range 12.9–14.4, 𝑛 = 47), and patients with severe sepsis at ICU admission
0 0.25 0.5 0.75 1
8 9 10 11 12 13 14 15 16 17
P
roba
bili
ty o
f s
epsis
Cytokine mRNA index
Sepsis
Infection
Figure 2: Probability of presence of sepsis in relation to cytokine mRNA index. Logistic regression analysis; model;𝑛 = 87,𝑟2= 0.39,
𝑃 < 0.0001.
(median 11.2, interquartile range 10.6–12,𝑛 = 40,𝑃 < 0.0001). When this index of cytokine gene expression in patients with severe sepsis at ICU admission and infection were included in a logistic regression analysis there was a significant relation between cytokine index and patient group (Figure2; logistic regression model;𝑛 = 87,𝑟2 = 0.39,𝑃 < 0.0001); the odds ratio for developing severe sepsis increased by 3.6 per unit change of the score, and by an odds ratio of 18340 over the range of the score, with an area under the receiver operator characteristic curve of 0.887. This algorithm, at a cut-off value of 12.5, correctly identified 36 of 40 patients with sepsis and 39 of 47 patients with infection but without severe sepsis on day 1, giving a sensitivity of 90%, a specificity of 83%, a positive predictive value of 81%, and a negative predictive value of 90%.
In patients with severe sepsis there was no association between the severity of organ failure and cytokine gene expression or gene expression score in PBMCs. There was no association between mortality and PBMC cytokine gene expression. Serum IL6 levels were greater in patients with severe sepsis at ICU admission (median 741.8 pg/mL, IQR 578–1247, 𝑛 = 50) than patients with infection (median 80 pg/mL, IQR 61–105,𝑛 = 49, 𝑃 < 0.0001). In patients with severe sepsis there was a significant association between sequential organ failure assessment (SOFA) scores and serum IL6 protein levels at ICU admission and 7 days after admis-sion (admisadmis-sion𝑃 < 0.001, Spearman𝜌= 0.796,𝑛 = 49; day 7𝑃 < 0.001, Spearman𝜌= 0.812,𝑛 = 30).
When blood levels of IL-6 were included with the cytokine gene expression score in a multivariate analysis (logistic regression model;𝑛 = 87,𝑟2 = 0.76,𝑃 < 0.0001), both IL-6 (𝑃 = 0.001) and cytokine index (𝑃 = 0.02) retained statistical significance, and the area under a receiver operator curve was 0.98.
4. Discussion
[image:4.600.312.545.74.242.2]in PBMCs, rather than soluble mediators of systemic inflam-mation. This data emphasises the central role of immune response in patients both with infection and severe sepsis, with a persistent abnormality of immune response in patients with severe sepsis. We propose a practical technique to quantify this immune response.
There is a physiologic basis for the cytokines in this model, identified from prior pilot studies by this group, given that these cytokines regulate the immune response to infection. Both IL2 and IL7 regulate T-cell homeostasis, with IL2 produced in an autocrine manner upon T-cell activation [6]. IL7, produced by antigen-presenting cells induces na¨ıve and memory T cells to differentiate into effector T cells. In this study it was notable that decreased IL7 gene expression characterised severe sepsis rather than infection. Both IL23 and IL27 are produced by antigen-presenting cells and regulate the interaction between innate and adaptive immunity. Specifically, IL23 acts primarily upon memory T cells, inducing differentiation to an effector phenotype [12]. In contrast IL27, with multiple potentially antagonist actions, induces T-cell IL10 production [13].
IFN𝛾 and TNF𝛼 production by PBMCs is of piv-otal importance in generating an appropriate bactericidal response to infection [8]. IFN𝛾induces HLA-DR expression by antigen-presenting cells, and this may be an important mechanism by which it reduces mortality in sepsis [14– 16]. In this study it was notable that decreased IFN𝛾 gene expression characterised severe sepsis rather than infection. IL10, a prototypic anti-inflammatory cytokine, is produced by a wide range of leukocytes in response to both infectious and noninfectious stimuli [17]. IL10 has significant immune suppressant effects [18–20].
CD3+ CD127+ lymphocytes, a population consisting of na¨ıve and memory T cells, were decreased in patients with severe sepsis. CD127 is the IL7𝛼 receptor and is expressed by na¨ıve and memory T cells: IL7 mediates expansion of na¨ıve and memory T cells by binding to CD127. As cell surface expression of CD127 decreases after binding with IL7, thereby limiting the effect of IL7, effector T cells are CD127−. Thus the decrease in IFN𝛾in patients with severe sepsis was not associated with any alteration in effector or memory T cells. Immune suppression in sepsis and a decrease in inducible lymphocyte IFN𝛾gene production may alternatively be related to T-cell apoptosis, expression of inhibitory signalling molecules, and the exaggerated effects of regulatory T cells or a decrease in T-cell repertoire [21–25]. The pattern of cytokine gene expression in patients with severe sepsis is not reactive, as patients with infection exhibited similar pattern of dysregulated gene expression. Furthermore in thoracic surgery patients, a similar pattern of perioperative change in cytokine gene expression was observed to precede the onset of infection at a time when markers of systemic inflammation remained unchanged [4, 5]. Lastly innate familial patterns of leukocyte TNF𝛼 and IL10 production have been linked with risk for mortality in meningococcal disease [26].
The cytokines analysed in this study are immune regula-tors and effecregula-tors rather than mediaregula-tors of systemic inflam-mation, which accounts for the apparent lack of association
between severity of organ failure and cytokine gene expres-sion.
In the preliminary screening studies by this group, only blood levels of IL6 correlated with severity of organ failure, and hence IL6 was assayed as an index of inflammation [9]. In this and other studies, the severity of multiple organ failure was related to serum IL6 levels [27, 28]. IL6 is produced predominantly by hepatocytes and endothelial cells rather than peripheral blood lymphocytes and plays a pivotal role generating the organ damage of systemic inflammation [29– 34]. While Goldie et al. reported that IL6 levels are greater in septic patients who succumb to their illness, the current study was too small to examine this association [35].
Studies examining serum levels of cytokines in patients with severe sepsis have shown inconsistent results [35– 38]. Furthermore, serum cytokines emanate from many cell groups and thus reflect a global rather than cell-specific host response. In contrast, gene expression assays quantifying cellular mRNA expression from peripheral blood leukocytes allow sensitive and specific measurement of the functional state of specific immune cells and have already shown promise in the differentiation of patients at high and low risk for severe sepsis in the postoperative period [39]. Absolute quantitative RT-PCR or qPCR utilises internal standards of known concentrations with each PCR run enables faithful comparison of results of gene expression assays between patients [40,41].
Microarray studies of leukocyte gene expression in septic patients have identified anomalous expression of immune-related genes in septic patients, without any discernable transition from proinflammatory to counter inflammatory response [42]. These studies examined gene expression in signalling pathways rather than effector cytokines, often in heterogenous cell lines from whole blood samples, using microarray technology rather than RT-PCR, and thus did not observe the same robust link between sepsis and cytokine gene expression.
5. Conclusion
We characterised immune responses in patients with severe sepsis using molecular profiling with standard molecular biological techniques. Severe sepsis and infection in humans are strongly associated with an abnormal immune response. Severe sepsis in humans should be considered to represent a disorder of both immunity and inflammation. This approach may be important in future studies of severe sepsis.
Appendices
A. Methods
A.1. Real Time PCR. Approximately 20 mL of blood was
buffy coat isolation was performed using density gradient centrifugation. Supernatant from the dextran step was aspi-rated and diluted 1 : 1 with phosphate buffered saline (Sigma). 25 mL of the buffered supernatant was carefully layered over 15 mL of Ficoll (Lymphoprep, Axis-Shield, Dundee, Scotland) in a 50 mL conical tube (Sarstedt). Tubes were centrifuged at 400×g for 23 minutes with brake off. The cellular interface layer between the serum and Ficoll containing the mononu-clear cell fraction was carefully aspirated. Cells were washed twice with phosphate buffered saline (PBS) (Sigma) and lysed prior to storage using a kit lysis buffer (RLT buffer, Qiagen, West Sussex, UK). Lysates were stored at−80∘until required. Primer/probes for TNF𝛼, IL2, IL7, IL10, and IL23 were obtained as precustomised mixes from Applied Biosystems (ABI, Warrington, UK). Custom primers and probes for INF𝛾, IL27, and 𝛽-actin were designed using the publicly available sequences and synthesised by ABI. Standards of known concentration of plasmid incorporating the target sequence for the qPCR assay were gifted by P. Stordeur or cloned de novo and validated using the PCR assay for the target of interest.
Total RNA was extracted using the RNEasy Mini kit, (Qiagen, West Sussex, UK). Genomic DNA was eliminated by on column DNAse digestion followed by elution of the RNA in RNAse-free water. RNA quality and concentration were determined spectrophotometrically (Nanodrop 8000, Thermo Scientific, DE, USA). cDNA for each sample was synthesised from 500 ng total RNA using a mastermix pre-pared per reaction as follows: first strand reaction buffer (5X) 6𝜇L, dithiothreitol (DTT) 0.1 M 3𝜇L, murine Moloney lymphotropic virus (mMLV) reverse transcriptase 1.25𝜇L (all Invitrogen no. 28028-013), dimethyl sulfoxide 4.5𝜇L (Sigma), deoxynucleotide triphosphates (dNTPs) (Promega no. U1420), RNase inhibitor (RNasin no. N2511, Promega), and random hexamers 2𝜇L (Invitrogen). The final reaction volume was made up to 30𝜇L with RNase-free water and incubated at 37∘C for 1 hour on a thermal cycler.
Absolute quantification of gene expression was deter-mined using TaqMan Gene expression assays performed on an ABI Prism 7000 or ABI 7900 HT (Applied Biosystems). Samples were run in duplicate or triplicate. Levels of gene expression were determined by reference to standard curves of known concentrations of copy numbers of the sequence of interest in addition to a reference gene (𝛽-actin) performed with each run. Results were expressed as copy numbers of target mRNA per 107 𝛽-actin mRNA copy numbers.
A.2. Interleukin 6. Blood was also collected in a clot
activat-ing serum tube and centrifuged at 1200 rpm for 10 minutes at room temperature. Serum supernatant was aspirated and stored in microcentrifuge tubes at−80∘C. First thaw samples were used for protein determination. Interleukin-6 protein measurement was determined by ELISA (Quantikine, RnD Systems, Minneapolis, MN, USA). The volume of serum for the ELISA was 100 uL done on a standard 96 well plate.
A.3. Flow Cytometry. The following fluorochrome-labelled
antibodies, CD3 PeCF594, CCR7 PeCy7, CD45RA V450 (BD Biosciences), CD14VioGreen (Miltenyi Biotec, Surrey, UK),
CD16 eFluor450, CD127 eFluor780 (eBiosciences, Hatfield, UK), and CD56FITC (Immunotools, Friesoythe, Germany), were added to 12 × 75 mm polypropylene tubes. 100 uL whole blood was added and the mixture incubated at room temperature in the dark for 15 minutes. Samples were then lysed (FACS Lyse, BD Biosciences) and washed with phos-phate buffered saline supplemented with 1% bovine serum albumin and 0.01% sodium azide. Cells were subsequently fixed in 500𝜇L of 1% paraformaldehyde (Sigma-Aldrich) in PBS solution. Analysis was performed on a Beckman Coul-ter Cyan ADP CytomeCoul-ter. Spectral overlap compensation was performed using single colour fluorochrome controls combined with anti-immunoglobulin compensation parti-cles or negative control (BD CompBeads, BD Biosciences). T cells, NK cells, and monocytes were defined as CD3+, CD16+CD56+, and CD14+/CD16+populations, respectively. Memory T cells were further defined as CD45RA+, central versus effector subtype, respectively, as CCR7−or CCR7+, and differentiated versus na¨ıve/memory, respectively, as CD127− or CD127+. Results are expressed as % positive of gated population.
B. Additional Data
See Supplementary Tables 4, 5, and 6 available online at http://dx.doi.org/10.1155/2013/164246.
Abbreviations
ICU: Intensive care unit
PBL: Peripheral blood leukocyte IFN𝛾: Interferon gamma
TNF𝛼: Tumour necrosis factor alpha IL: Interleukin
mRNA: Messenger RNA
mMLV: Murine moloney lymphotrophic virus
cDNA: Complimentary DNA
qRT-PCR: Quantitate real time polymerase chain reaction
ELISA: Enzyme-linked immunosorbent assay
ROC: Receiver operating characteristic.
Conflict of Interests
The authors Robert Grealy, Mary White, Ross McManus, Dermot Kelleher, and Thomas Ryan have applied for a patent of a process linking gene expression and sepsis.
Authors’ Contribution
Acknowledgments
This project was supported by a Proof of Concept Grant from Enterprise Ireland, the National Development Plan of the Irish Government, and the Health Research Board of Ireland. R. Grealy is funded under the Health Research Board of Ireland Research Training Fellowship for Healthcare Professionals programme.
References
[1] J. L. Vincent, Y. Sakr, C. L. Sprung et al., “Sepsis in European intensive care units: results of the SOAP study,”Critical Care
Medicine, vol. 34, no. 2, pp. 344–353, 2006.
[2] M. J. O’Dwyer, A. K. Mankan, P. Stordeur et al., “The occurrence of severe sepsis and septic shock are related to distinct patterns of cytokine gene expression,”Shock, vol. 26, no. 6, pp. 544–550, 2006.
[3] M. J. O’Dwyer, A. K. Mankan, M. White et al., “The human response to infection is associated with distinct patterns of interleukin 23 and interleukin 27 expression,”Intensive Care
Medicine, vol. 34, no. 4, pp. 683–691, 2008.
[4] M. White, I. Martin-Loeches, M. W. Lawless et al., “Hospital-acquired pneumonia after lung resection surgery is associated with characteristic cytokine gene expression,”Chest, vol. 139, no. 3, pp. 626–632, 2011.
[5] M. White, V. Mahon, R. Grealy et al., “Post-operative infec-tion and sepsis in humans is associated with deficient gene expression of gammac cytokines and their apoptosis mediators,”
Critical Care, vol. 15, no. 3, article R158, 2011.
[6] A. L. Kinter, E. J. Godbout, J. P. McNally et al., “The com-mon𝛾-chain cytokines IL-2, IL-7, IL-15, and IL-21 induce the expression of programmed death-1 and its ligands,”Journal of
Immunology, vol. 181, no. 10, pp. 6738–6746, 2008.
[7] C. L. Langrish, B. S. McKenzie, N. J. Wilson, R. de Waal Malefyt, R. A. Kastelein, and D. J. Cua, “IL-12 and IL-23: master regulators of innate and adaptive immunity,”Immunological
Reviews, vol. 202, pp. 96–105, 2004.
[8] U. Boehm, T. Klamp, M. Groot, and J. C. Howard, “Cellular responses to interferon-𝛾,”Annual Review of Immunology, vol. 15, pp. 749–795, 1997.
[9] M. White, M. W. Lawless, M. J. O’Dwyer et al., “Transforming growth factor 𝛽-1 and interleukin-17 gene transcription in peripheral blood mononuclear cells and the human response to infection,”Cytokine, vol. 50, no. 3, pp. 322–327, 2010.
[10] J. R. le Gall, S. Lemeshow, and F. Saulnier, “A new Simplified Acute Physiology Score (SAPS II) based on a European/North American multicenter study,” The Journal of the American
Medical Association, vol. 270, no. 24, pp. 2957–2963, 1993.
[11] J. L. Vincent, R. Moreno, J. Takala et al., “The SOFA (Sepsis-related Organ Failure Assessment) score to describe organ dysfunction/failure. On behalf of the Working Group on Sepsis-Related Problems of the European Society of Intensive Care Medicine,”Intensive Care Medicine, vol. 22, no. 7, pp. 707–710, 1996.
[12] Z. Li, F. Wu, S. R. Brant, and J. H. Kwon, “IL-23 receptor regulation by Let-7f in human CD4+memory T cells,”Journal
of Immunology, vol. 186, no. 11, pp. 6182–6190, 2011.
[13] J. S. Stumhofer, J. S. Silver, A. Laurence et al., “Interleukins 27 and 6 induce STAT3-mediated T cell production of interleukin
10,”Nature Immunology, vol. 8, no. 12, pp. 1363–1371, 2007.
[14] H. C. Polk Jr., W. G. Cheadle, D. H. Livingston et al., “A randomized prospective clinical trial to determine the efficacy of interferon-𝛾in severely injured patients,”American Journal
of Surgery, vol. 163, no. 2, pp. 191–196, 1992.
[15] G. Nakos, V. D. Malamou-Mitsi, A. Lachana et al., “Immu-noparalysis in patients with severe trauma and the effect of inhaled interferon-𝛾,”Critical Care Medicine, vol. 30, no. 7, pp. 1488–1494, 2002.
[16] W. D. D¨ocke, F. Randow, U. Syrbe et al., “Monocyte deactivation in septic patients: restoration by IFN-𝛾 treatment,” Nature
Medicine, vol. 3, no. 6, pp. 678–681, 1997.
[17] E. Duggan, E. Caraher, K. Gately et al., “Tumor necrosis factor-𝛼and interleukin-10 gene expression in peripheral blood mononuclear cells after cardiac surgery,”Critical Care Medicine, vol. 34, no. 8, pp. 2134–2139, 2006.
[18] T. Fumeaux and J. Pugin, “Role of interleukin-10 in the intracel-lular sequestration of human leukocyte antigen-DR in mono-cytes during septic shock,”American Journal of Respiratory and
Critical Care Medicine, vol. 166, no. 11, pp. 1475–1482, 2002.
[19] A. Kumar, S. Zanotti, G. Bunnell et al., “Interleukin-10 blunts the human inflammatory response to lipopolysaccharide without affecting the cardiovascular response,”Critical Care Medicine, vol. 33, no. 2, pp. 331–340, 2005.
[20] W. Ouyang, S. Rutz, N. K. Crellin, P. A. Valdez, and S. G. Hymowitz, “Regulation and functions of the IL-10 family of cytokines in inflammation and disease,” Annual Review of
Immunology, vol. 29, pp. 71–109, 2011.
[21] R. S. Hotchkiss, K. W. Tinsley, P. E. Swanson et al., “Sepsis-induced apoptosis causes progressive profound depletion of B and CD4+T lymphocytes in humans,”Journal of Immunology, vol. 166, no. 11, pp. 6952–6963, 2001.
[22] J. S. Boomer, K. To, K. C. Chang et al., “Immunosuppression in patients who die of sepsis and multiple organ failure,”The
Journal of the American Medical Association, vol. 306, no. 23,
pp. 2594–2605, 2011.
[23] F. Venet, C. S. Chung, H. Kherouf et al., “Increased circulating regulatory T cells (CD4+CD25+CD127−) contribute to lympho-cyte anergy in septic shock patients,”Intensive Care Medicine, vol. 35, no. 4, pp. 678–686, 2009.
[24] F. Venet, C. S. Chung, G. Monneret et al., “Regulatory T cell populations in sepsis and trauma,”Journal of Leukocyte Biology, vol. 83, no. 3, pp. 523–535, 2008.
[25] F. Venet, O. Filipe-Santos, A. Lepape et al., “Decreased T-cell repertoire diversity in sepsis: a preliminary study,”Critical Care
Medicine, vol. 41, no. 1, pp. 111–119, 2013.
[26] R. G. J. Westendorp, J. A. M. Langermans, T. W. J. Huizinga et al., “Genetic influence on cytokine production and fatal meningococcal disease,”The Lancet, vol. 349, no. 9046, pp. 170– 173, 1997.
[27] E. Watanabe, H. Hirasawa, S. Oda, K. Matsuda, M. Hatano, and T. Tokuhisa, “Extremely high interleukin-6 blood levels and outcome in the critically ill are associated with tumor necrosis factor- and interleukin-1-related gene polymorphisms,”Critical
Care Medicine, vol. 33, no. 1, pp. 89–97, 2005.
[28] P. Fraunberger, Y. Wang, E. Holler et al., “Prognostic value of interleukin 6, procalcitonin, and C-reactive protein levels in intensive care unit patients during first increase of fever,”Shock, vol. 26, no. 1, pp. 10–12, 2006.
[30] B. Gasz, L. Lenard, B. Racz et al., “Effect of caidiopulmonary bypass on cytokine network and myocardial cytokine produc-tion,”Clinical Cardiology, vol. 29, no. 7, pp. 311–315, 2006. [31] M. Sander, C. von Heymann, V. von Dossow et al., “Increased
interleukin-6 after cardiac surgery predicts infection,”
Anesthe-sia and AnalgeAnesthe-sia, vol. 102, no. 6, pp. 1623–1629, 2006.
[32] N. C. Riedemann, T. A. Neff, R. F. Guo et al., “Protective effects of IL-6 blockade in sepsis are linked to reduced C5a receptor expression,”Journal of Immunology, vol. 170, no. 1, pp. 503–507, 2003.
[33] N. C. Riedemann, R. F. Guo, T. J. Hollmann et al., “Regulatory role of C5a in LPS-induced IL-6 production by neutrophils during sepsis,”The FASEB Journal, vol. 18, no. 2, pp. 370–372, 2004.
[34] K. J. Hartemink and A. B. J. Groeneveld, “The hemodynamics of human septic shock relate to circulating innate immunity factors,”Immunological Investigations, vol. 39, no. 8, pp. 849– 862, 2010.
[35] A. S. Goldie, K. C. H. Fearon, J. A. Ross et al., “Natural cytokine antagonists and endogenous antiendotoxin core antibodies in sepsis syndrome. The Sepsis Intervention Group,”The Journal
of the American Medical Association, vol. 274, no. 2, pp. 172–177,
1995.
[36] J. T. van Dissel, P. van Langevelde, R. G. J. Westendorp, K. Kwappenberg, and M. Fr¨olich, “Anti-inflammatory cytokine profile and mortality in febrile patients,”The Lancet, vol. 351, no. 9107, pp. 950–953, 1998.
[37] P. Damas, J. L. Canivet, D. de Groote et al., “Sepsis and serum cytokine concentrations,”Critical Care Medicine, vol. 25, no. 3, pp. 405–412, 1997.
[38] C. A. Gogos, E. Drosou, H. P. Bassaris, and A. Skoutelis, “Pro- versus anti-inflammatory cytokine profile in patients with severe sepsis: a marker for prognosis and future therapeutic options,”Journal of Infectious Diseases, vol. 181, no. 1, pp. 176– 180, 2000.
[39] C. Hinrichs, K. Kotsch, S. Buchwald et al., “Perioperative gene expression analysis for prediction of postoperative sepsis,”
Clinical Chemistry, vol. 56, no. 4, pp. 613–622, 2010.
[40] P. Stordeur, L. F. Poulin, L. Craciun et al., “Cytokine mRNA quantification by real-time PCR,” Journal of Immunological
Methods, vol. 259, no. 1-2, pp. 55–64, 2002.
[41] P. Stordeur, L. Zhou, B. Byl et al., “Immune monitoring in whole blood using real-time PCR,”Journal of Immunological Methods, vol. 276, no. 1-2, pp. 69–77, 2003.
[42] B. M. Tang, S. J. Huang, and A. S. McLean, “Genome-wide transcription profiling of human sepsis: a systematic review,”
Submit your manuscripts at
http://www.hindawi.com
Stem Cells
International
Hindawi Publishing Corporationhttp://www.hindawi.com Volume 2014
Hindawi Publishing Corporation
http://www.hindawi.com Volume 2014
INFLAMMATION
Hindawi Publishing Corporation
http://www.hindawi.com Volume 2014
Behavioural
Neurology
Endocrinology
International Journal of Hindawi Publishing Corporationhttp://www.hindawi.com Volume 2014
Hindawi Publishing Corporation
http://www.hindawi.com Volume 2014
Disease Markers
Hindawi Publishing Corporation
http://www.hindawi.com Volume 2014
BioMed
Research International
Oncology
Journal ofHindawi Publishing Corporation
http://www.hindawi.com Volume 2014
Hindawi Publishing Corporation
http://www.hindawi.com Volume 2014 Oxidative Medicine and Cellular Longevity Hindawi Publishing Corporation
http://www.hindawi.com Volume 2014
PPAR Research
The Scientific
World Journal
Hindawi Publishing Corporation
http://www.hindawi.com Volume 2014
Immunology Research
Hindawi Publishing Corporation
http://www.hindawi.com Volume 2014
Journal of
Obesity
Journal ofHindawi Publishing Corporation
http://www.hindawi.com Volume 2014
Hindawi Publishing Corporation
http://www.hindawi.com Volume 2014 Computational and Mathematical Methods in Medicine
Ophthalmology
Journal ofHindawi Publishing Corporation
http://www.hindawi.com Volume 2014
Diabetes Research
Journal ofHindawi Publishing Corporation
http://www.hindawi.com Volume 2014
Hindawi Publishing Corporation
http://www.hindawi.com Volume 2014
Research and Treatment
AIDS
Hindawi Publishing Corporation
http://www.hindawi.com Volume 2014
Gastroenterology Research and Practice
Hindawi Publishing Corporation
http://www.hindawi.com Volume 2014
Parkinson’s
Disease
Evidence-Based Complementary and Alternative Medicine
Volume 2014 Hindawi Publishing Corporation
![Local Democracy, Economic Development and Construction Bill [HL]](data:image/gif;base64,R0lGODlhAQABAIAAAP///wAAACH5BAEAAAAALAAAAAABAAEAAAICRAEAOw==)