Sieving
/
Screening
J. Skopp, School of Natural Resource Sciences, University of Nabraska, Lincoln, NE, USA Copyright^ 2000 Academic Press
Introduction
Sieving is one of the oldest and most commonly used method of sorting materials. Yet, when improperly carried out, sieving can provide misleading informa-tion or biased separainforma-tion. Sieving has widespread application to industries as diverse as mining, phar-maceutical production and agriculture. The goal is typically to control or measure the particle size distri-bution. Sieving may be a direct part of a production process, a quality control procedure or a sample char-acterization. Regardless of the purpose, an under-standing of sieving is necessary to optimize and accurately use this technique.
Sieving has the clear advantage of being a simple, readily understood and relatively inexpensive method. This method also has the ability to provide reproducible results. This has tended to boost conR -dence in the method, even where it is not warranted. Some of this conRdence is a result of ignorance as to the actual errors involved in a given sieving operation or with a particular set of sieves. While these errors can be described and measured, the difRculty of doing so largely detracts from the attractiveness of the method. Thus, most people rely on standard proced-ures and the reproducibility of the method to reassure themselves as to the quality of the data obtained.
Overview of Sieving Process
Sieving was the earliest means of particle size frac-tionation. Basically, the process of sieving is that of placing the particles to be fractionated on a pattern of openings or holes. The individual openings are refer-red to as the aperture. Small particles may fall through or the sieve retains the larger particles. Separ-ation requires agitSepar-ation and time. A variety of mecha-nisms exist to provide agitation either to the sieve or to the particles to be fractionated. Typically, com-mercial equipment varies in the manner in which agitation is created or the Suid used to support the particles. Either air or water may be used to support the particles as they sort on the sieve. Dry sieving has a lower practical limit of 50m, while wet sieving can separate smaller particle sizes when using special sieves or small volumes of particles.
We brieSy examine three applications of sieving processes before continuing in more detail with a de-scription of the sieving process, the time dependence of sieving and lastly sources of error in sieving.
Applications of Sieving
A single sieve may provide a straightforward
classi-Rcation (or gradation) of particles where a clear thre-shold is desired. Crushing operations typically seek to ensure that all particles are below such a threshold and sieves provide a convenient means of doing so. However, in some operations it is equally important to remove particles less than a given size. TheRrst case is referred to as scalping (removing oversize particles) while the second case is referred to as re-moval ofRnes. Sometimes it is desirable to do both. Thus, it can be useful to employ a set (or nest) of sieves varying in aperture size. Unsorted particles are applied to the topmost sieve and agitation begun. As the particles sort, smaller ones pass through from upper sieves to lower ones. This cascade of particle sorting continues as the smallest particles only gradually make their way past the smallest sieve.
A nest of sieves with a sufRcient variation in aper-ture sizes may be used to construct a particle size distribution. Such distribution may in turn be used to describe the behaviour of the material under study. A particle size distribution obtained in this way should recognize that the errors associated with the top sieve (the coarsest fraction) may be different from the errors associated with the bottom sieve (theRnest fraction). This occurs in part due to differing oppor-tunity times for the particles to pass through the sieve that they are ultimately retained upon.
A third application of sieving is the use of sieving curves to develop a morphological characterization of the material being screened. Sieving curves represent the time dependence of the sieving process and are discussed in more detail in a later section. The goal is to infer particle shape or other morphological fea-tures (e.g. agglomeration) from the speed with which sieving proceeds. Unfortunately, these techniques are still in the developmental stages.
Description of the Sieving Process
Sieve Construction
Sieves are typically constructed in one of two ways:
Figure 1 How particle shape influences the efficiency of sieving by delaying passage through the sieve.
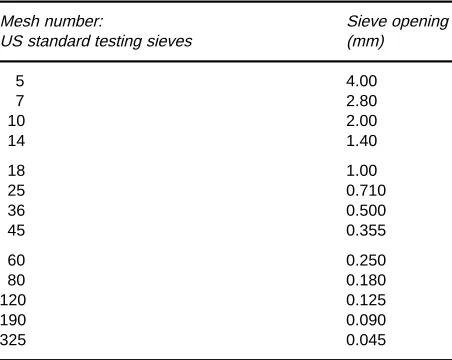
Table 1 Sieve mesh equivalent sizes: US standard testing sieves designated for wire cloth at some principal ISO sizes
Mesh number: Sieve opening
US standard testing sieves (mm)
5 4.00
7 2.80
10 2.00
14 1.40
18 1.00
25 0.710
36 0.500
45 0.355
60 0.250
80 0.180
120 0.125
190 0.090
325 0.045
results in square apertures. The diameter of the wire controls the size of the aperture and per cent of the total area that is open. Second, openings or circular holes are created by perforating a plate orSat disc. The number of perforations controls the amount of open area in this sieve. These two methods result in openings that differ in shape and in their ability to pass particles. Thus, it is important to specify which kind has been used to obtain a particular set of data.
Sieves are available in standard sizes (Table 1) from a number of companies. Sieve openings are given in a mesh number or nominal diameter of the opening. Surprisingly, no standard sieve is readily available for the 50m cut-off between the sand and silt separates (as deRned in some systems of particle nomenclature). Consequently, sieving cannot distin-guish this class boundary directly using standard sieves. However, such boundaries (or other speciRc sizes) can be estimated by determining the particle size distribution with a nest of sieves that bracket the desired size.
Industry standards have focused on maintaining consistency in the manufacture of sieves. This allows the comparison of sieving operations provided the materials and conditions of the sieving are also com-parable. The focus of many practitioners of sieving has been on standard procedures to maintain repro-ducibility and consistency.
Sieve Agitation
Particles placed on a sieve may not sort or pass through the openings unless some form of agitation is used. Typically, a large mass of soil placed on a sieve
will allow particles to bridge, thus restricting their passage through the openings. Agitation breaks the bridges, shufSes the particles and provides an oppor-tunity for particles to present themselves to an open-ing.
An undersize particle may still fail to pass through a sieve. Figure 1 illustrates how identically shaped particles may approach the aperture at different angles. Some angles may allow passage of the particle while others may restrict passage. Agitation increases the number of times that a particle approaches the aperture and the velocity of approach and alters the orientation of the particle as it approaches the aper-ture. TheRrst two factors depend on shaking intensity and competition among particles. The third factor depends on the shape of the particle and the shape of the sieve opening. These factors inSuence not only the speed with which fractionation occurs, but the reten-tion of speciRc particles.
Alternative commercial instruments attempt to agitate the particles in different ways. Vibration is commonly used, either as a jarring action or an oscil-latory motion. This motion may have a large or small amplitude and may be restricted to horizontal or vertical motion. The efRciency of separation usually increases as vibration amplitude increases, but it may reach a maximum. EfRciency declines as the increased agitation merely serves to suspend particles without giving them an opportunity to pass through an aper-ture.
Figure 2 Example of three sieving curves modelled with the equationP"100%[1!exp(!ktn)],n"0.8. Dashed line,k"0.025;
dotted line,k"0.050; continuous line,k"0.10.
a vertical orientation as airSow lifts the particles and attempts to pass through the sieve. Particles retained on the sieve would need to be mechanically removed. Such a manipulation could be maintained in opera-tion continuously.
Sieved Materials
The particle inSuences the time and efRciency of siev-ing. Issues relate to the sample’s mass, particle size distribution, particle density, particle shape, friabil-ity, the tendency to aggregate and electrostatic prop-erties. SpeciRc procedures have been developed for particular materials.
Obtaining a representative sample or subsample for seive analysis is a key step; this is a particular issue where nonuniformity is extreme or segregation of the sample may occur. It may sometimes be necessary to settle for reproducible sampling with the goal of making comparisons on a relative basis.
Sample mass inSuences the efRciency of sieving and the time needed for a sieving operation. At high loadings, blinding of the sieve may be more important as well as increased breakdown of friable samples.
Particle size distribution has several effects on the efRciency of sieving. These effects, if they exist, may depend on the choice of sieves. Particles which are slightly oversize may lodge in the sieve, blocking the aperture from participating in the sieving process. This ‘blinding’ of the sieve reduces the overall efR -ciency of sieving or increases the time needed to achieve separation.
Sample friability can also inSuence separation. Friability is the tendency of particles to break apart. The process of agitation and sieving may change the particle size distribution for friable samples. Longer sieving times or larger amplitude agitation increase these effects. Ultimately, the goal of the sieving opera-tion must be compared to the effect of sieving on the underlying size distribution.
Time Dependence of Sieving
Sieving Curves
The mass passing through the sieve can be observed by collecting this material on a balance or strain gauge. This can be done manually or the sensor can be connected to a computer and the progress of siev-ing continuously monitored as a function of time. The graph of mass remaining on the sieve or the mass that has passed the sieve is referred to as a sieving curve
(Figure 2). The graph shown in Figure 2 shows the
mass passing through the sieve as a function of time. Note that complete separation may never be achieved.
Sieving Equations
function. The rate at which material passes through the sieve for short times is nearly constant and can be expressed by a power function model given as:
M"atb
where M"cumulative mass of the material passed at sieving time t(grams),t"sieving time (seconds), b"a constant nearly equal to 1 and a"sieving rate constant, with units of g s\1b. This model has had
some practical utility but its validity in describing data, even for short times, is questionable and de-pends on how the data are truncated.
One mechanistic model starts by assuming that the probability of particle passage at time t is directly proportional to the mass of material on the sieve. Thus, the mass of material remaining (Mt) at sieving
timetis described in differential form by:
dMt
dt "!k(Mt!Mr)
whereMt"total mass of the material remaining on
the sieve at timet(grams),Mr"material mass which does not pass the sieve (i.e. the sieve residue after inRnite sieving time) (gram) and k"passage prob-ability of the material with a given size at timet, or passage rate factor (s\1).
This model assumes that, after a time,k becomes independent of time and particle size. This occurs when the smallest particles have passed through the sieve and those left on the sieve are of a size close to the sieve opening. However, the sieving constant (k) is not guaranteed to be constant. For example, it may change with the depth of material on the sieve and hence change as M changes. Thus, one difRculty in using the above equation lies in describ-ing how kchanges with experimental conditions or time.
Integrating the above equation (setting Mr"0) with the application of initial conditions yields:
M"M0(1!e\kt)
where M"cumulative mass of material passed at sieving time t(grams) andM0"cumulative mass of the material that would pass at inRnite sieving time (grams). Note that M#Mt"M0. The rate constant can be determined empirically or deduced from physical principles. In the latter casekis deRned as:
k"A[1!2R(1!fs)/D]2
where A is a constant depending on the sieve and sieving conditions,Ris a radius of the particle,Dis the sieve opening andfsis a grouping of factors that describe particle shape. Tests of this model have not been extensive. It should work best for longer times. An alternative or modiRed proportional model has been used with some success over a wide range of sieving times. This model starts by assuming that the constantkin the differential equation above is a func-tion of time,k"kH/tm. Then the differential equation
can be written as:
dMt
dt "!
!kH(Mt!Mr)
tm
wherekH"passage probability of the material with a given size at timet, or passage rate factor, (s\n) and
n"1!mwheremis a constant.
Upon solving this equation forMand substituting 1!nform, the resulting model is:
M"M0(1!e\kHtn
)
This model appears to describe both the initial and long time sieving behaviour. It is empirical in nature, so its coefRcients need to be related to particle mor-phology or other sample characteristics.
Sources of Error
The Sample
The major concern with sieving operations is the efRciency and time of each sieving step. This becomes particularly important when we use a nest of sieves to perform several separations simultaneously. The use of words such as effective or nominal diameters with sieves is in recognition of the imperfect separation that may occur. What is less readily recognized is that the sample may contribute to imperfect separation.
Placement of a soil sample on a sieve does not result in instantaneous separation. Several factors inSuence the time to achieve aRxed level of segregation. These factors include sample size, shaking intensity, particle shape, particle size and hole geometry. No one set of sieving times applies for all conditions, but for many soils with small samples (&100 g) a waiting time of about 3}5 min for coarse fractions and 10 min for
The single most important factor changing the efR -ciency of sieving is the initial sample mass. It is faster and more efRcient to split a large sample into several smaller ones. A useful rule of thumb is to keep the depth of material on the sieve to less than 1 cm. A better rule is to run a test sieving curve. In general, this will show that as the sieve opening decreases smaller masses are needed. For 8 in (20 cm) diameter sieves these typically range from 200 to 30 g for sieve openings varying from 2 mm to 45m.
Particle shape also inSuences the efRciency of siev-ing. Rougher surfaces with elongated shapes are ex-pected to require longer sieving times than smooth surfaces with a more spherical shape. It may be pos-sible to use equations like the one presented earlier to predict the sieving rate constant. However, the in-verse problem of determining the particle shape from sieving curves appears to be ambiguous.
Sieve Construction and Cleaning
The manufacture of sieves is subject to error. This error takes the form of a variation in aperture open-ing within a sieve as well as from sieve to sieve. This error also varies with the size of the opening, with the coarser sieves generally being more consistent. It is expected that for theRner sieves (less than 100m), this error could approach 10%. Thus, all sieve open-ings represent nominal diameters. The determination of the diameter of material that passes a particular sieve must be determined by calibration, as discussed in the next section.
Sieve cleaning represents one means of ensuring the reproducibility of a sieve. This typically involves use of a brush with the coarser sieves. Finer sieves may require reverseSushing with water or use of an ultrasonic cleaning bath. Ultimately, sieves must be inspected at periodic intervals to make sure that the mesh has not been distorted or damaged in use.
Calibration
A sieve calibration is used to establish the size of separation achieved by a particular sieve. This in-volves the use of standard materials and microscopic examination of the material passing through the sieve. The material is placed on the sieve and sieving proceeds until the mass passing appears unchanged. The material which has passed is examined under a microscope to determine the size of particles. This
information is used to Rnd an average equivalent volume diameter which represents the effective size of the sieve.
Conclusion
Sieving is a valuable and widely used tool for both sorting and particle size determination. It is a relative-ly inexpensive procedure that, with the use of stan-dard methods, can provide reproducible results. The use of sieves for novel materials requires the deter-mination of sieving curves under a variety of condi-tions such as loading. These curves are used to opti-mize the conditions for efRcient sieving. Even where only slight variations in the material to be analysed exist, it may be desirable to determine the appropriate sieving conditions rather than relying on standard methods.
See also: II /Particle Size Separation: Hydrocyclones for Particle Size Separation.
Further Reading
Allen T (1990)Particle Size Measurement, 4th edn. Powder Technology Series. London: Chapman and Hall. ASTM Committee E-29 on Particle Size Measurement
(1985) Manual on Test Sieving Methods. ASTM Special Technical Publication 447B. Philadelphia, PA: ASTM.
Beddow JK (1981) Particulate Science and Technology. New York, NY: Chemical Publishing.
Beddow JK (1984) Particle Characterization in Techno-logy. I. Applications and Microanalysis. Boca Raton, FL: CRC Press.
Beddow JK (1984)Particle Characterization in Technology.
II.Morphological Analysis. Boca Raton, FL: CRC Press. Fayer ME and Otten L (eds) (1984)Handbook of Powder Science and Technology. New York: Van Nostrand Reinhold.
Herdan G and Smith ML (1953)Small Particle Statistics;an Account of Statistical Methods for the Investigation of Finely Divided Materials. Amsterdam: Elsevier. Irani RR and Clayton FC (1963)Particle Size
Measure-ment,Interpretation and Application. New York, NY: Wiley.
Lauer O (1966)Grain Size Measurements on Commercial Powders;A Guide for Experts,Worked out in Alpine’s Experimental Station. Augsberg: Alpine.
![Figure 2Example of three sieving curves modelled with the equation P"100% [1!exp(!kt n)], n"0.8](https://thumb-us.123doks.com/thumbv2/123dok_us/948208.607924/3.568.132.434.460.683/figure-example-sieving-curves-modelled-equation-p-exp.webp)
