Targeting Repeat Sequences with DNA-Binding
Small Molecules
Thesis by John Richard Chevillet
In Partial Fulfillment of the Requirements for the Degree of
Master of Science
California Institute of Technology Pasadena, California
Recognition of repeat sequences in DNA would have applications in molecular biology. One ofthe most biologically interesting repeat sequences is the telomeric repeat which composes the ends of eukaryotic chromosomes; in vertebrates 5' -TTAGGG-3'. This sequence has been used as a model to study how DNA-binding polyamide molecules composed of pyrrole (Py) and imidazole (lm) residues bind to repeating sequences. DNase I footprinting shows that the polyamide-fluorophore conjugate IrnImImPy-y-PyPy((CH2)3N,N' ,N' 'trimethylbis (hexamethylene)triamine
-OregonGreen488) PyPy-~-Me can bind the sequence 5'-AGGGTT-3'
K. =
1.8x10⁸ M-1• Quantitative fluorescence titrations with varying patterns of telomeric repeat suggest that the molecule can tolerate another polyamide binding contiguously, but not two.Truncation of the tail of the conjugate to yield the molecule
IrnIrnImPy-y-Py IrnIrnImPy-y-Py( (CH2)3N ,N' ,N' 'trimethy Ibis (hexamethy lene )triamine-OregonGreen488) Py Py-Me allows the compound to bind three contiguous sites, suggesting that steric polyamide-polyamide interactions control binding in this manner.
Abstract
Table of Contents
List of Figures and Tables
I. Introduction
n
.
Background and Significancem.
Project AimsTable of Contents
IV. Project Design and Implementation
Experimental
References
111.
iv.
v-vi.
1
3 4
5 34
Figure 1: Watson-Crick base pairs Figure 2: Polyamide pairing Rules
Figure 3: Polyamide design motifs
Figure 4: Ball and stick models of repeat binding Figure 5: Synthesis of Compound 1
Figure 6: Synthesis of Compound 2
Figure 7: Plasmid pJCOl design
Figure 8: DNase footprint of Compound 3
Figure 9: Synthesis of Compound 6
Figure 10: DNase footprint of Compound 6
Figure 11: Fluorescence titration helices
Figure 12: Synthesis of Compound 9
Figure 13: Fluorescence spectrum of Compound 6
Figure 14: Fluorescence titration of Compound 6
Figure 15: Linear region of Compound 6 fluorescence titration
Figure 16: Synthesis of Compound 13
Figure 17: Binding isotherms for 13 on pICOl
v.
3
6
7
8
9
10
11
14
16
17
19
20
21
21
24
Figure 18: DNase footprint of Compound 13 26 Figure 19: MPE footprints of Compounds 6 and 13 27 Figure 20: Fluorescence titration helices with H5 28
Figure 21: Fluorescence image of 96-well plates 29
Figure 22: Fluorescence titration of Compound 6 30
Figure 23: Fluorescence titration of Compound 13 30 Figure 24: Linear region of Compound 6 fluorescence titration 31 Figure 25: Linear region of Compound 13 fluorescence titration 31
Table 1: Least squares regression analysis of Compound 6 titration 22 Table 2: Least squares regression analysis of Compound 6 titration with H5 32 Table 3: Least squares regression analysis of Compound 13 titration 32
I. Introduction
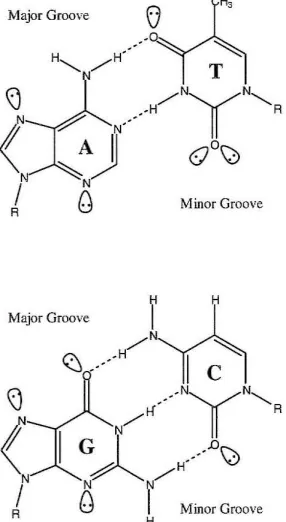
The biologically most relevant form of DNA is B-DNA, which displays a wide,
shallow major groove and a deep, narrow minor groove. 1 Sequence specific recognition
of duplex DNA by other molecules is governed by the H-bonding patterns that they can
form with the bases. The major groove has conventionally been thought to be a better
candidate for specific recognition as it is more accessible and presents a characteristic
H-bond pattern for all four Watson-Crick base pairs (Figure 1).2 However, collaborative
studies in the Dervan group illustrated it is possible to recognize all four base pairs in the
minor groove via a polyamide molecule composed of pyrrole (Py), imidazole (1m), and
hydroxypyrrole amino acids (Figure 2).3
H H
Major Groove
I
~/N ~ ~ ••••• H
I
C(-I{():"'"
N~~~/
/
G
I Minor Groove [image:6.558.68.211.398.659.2]R H
Figure 1: Watson-Crick base pairs sbowing major and minor groove H-bonding patterns
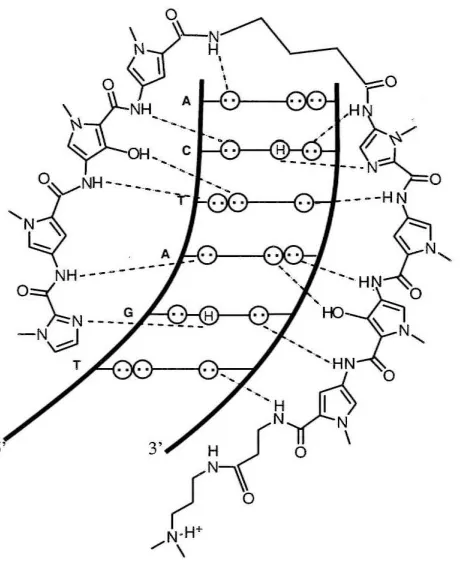
DNA binding polyamide molecules have been
shown to be cell permeable and have high affinity and
specificity for DNA (comparable to DNA binding
proteins).4-8 The residues pair side by side in the minor
groove; an Im-Py pairing specifies for
G-e
,
while a Py-lmpairing is specific for
e-G.
A Py-Py pairing is degeneratefor A-T and T-A. This degeneracy can be removed by
substitution of a hydroxypyrrole residue.3
•9 An Hp-Py pair
2
design of polyamides is limited to five contiguous rings, as an increase in this number of
residues does not affect binding affinity and decreases specificity.1O This limitation is
overcome by the insertion of a flexible aliphatic linker, ~-alanine. This substitution adds
conformational flexibility and ~-~ pairings in the minor groove have been found specify
The ability to sequence specifically recognize DNA by artificial small molecules
gives rise to many potential applications in molecular biology and medicine.
Investigation in this area has been ongoing. In collaborative studies, hairpin polyamides
have been shown to inhibit RNA Polymerase II transcription.14 In addition, conjugate
molecules utilizing a polyamide as a DNA recognition domain, a linker moiety, and a
Pyllm
targets
e-G
Hp/Py
targets
T-A
Py/Hp
targets
A-T
ImlPy
targets
G-e
Figure 2: Schematic representation of the polyamide ImPyHpPy-y-ImPyHpPy-~-Dp recognizing 5'
-TGATCA-3'
II. Project Background and Significance
Recognition and detection of repeat sequences in DNA would have applications in chromosome painting and genomic analysis. One of the most biologically interesting repeat sequences is the telomeric repeat which composes the termini of eukaryotic chromosomes.16 In
vertebrates, it follows the hexameric pattern 5'-TTAGGG-3'.17 The
[image:8.558.75.306.52.336.2]4
approximately 15kb in germline cells, but is variable in somatic cells and decreases with
each cell division,18,2o-22 but not necessarily with chronological age in a mechanism
referred to as the "mitotic clock, ,m The telomeres shorten until they trigger a p53
dependent check point arrest,24 causing the cell to enter a non-dividing state known as
senescence. This state is thought to prevent the ends of the chromosomes from being
recognized as double strand breaks, leading to repair by fusion, genomic instability, and apoptosis.25
Senescence has been implicated in aging and its associated pathologies,26-28
Rapidly dividing cancer cells escape this state by activation of telomerase, the enzyme
responsible for telomere synthesis (normally inactive in somatic cells) and thus
immortalize.29,3o Thus, a probe of telomere length would have significant applications in
studies of cancer and aging,3!
III. Project Aims
The goals of this project are:
1. To design and synthesize polyamides that bind repeating DNA
sequences,
IV. Project Design and Implementation
The telomeric repeat will serve as the experimental model to study how
poly ami des bind repeating sequences. Toward satisfaction of Project Aim 1, two
polyamide motifs have been designed to target the telomeric repeat (Figure 3). The first
employs the formation of a side-by-side heterodimer couple targeting Ilbp of the repeat:
5'-AGGGTTAGGGT-3'. This will be achieved through the pairing rule complimentary
polyamides IrnImIrnPy-~-PyImIrnIm-~-Dp (1) and PyPyPyPy-~-PyPyPyPy-~-Dp (2)
(Dp: dimethylaminopropylamine). The second targets the six base-pair sequence 5'-A
GGGTT-3' by way of the eight-ring hairpin polyamide ImIrnImPy-y-PyPyPyPy-~-Dp (3)
(y: y-aminobutyric acid) that has been previously shown to bind 5'-AGGGAA-3' with a
K.
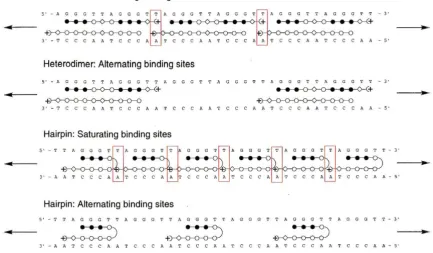
of 3.7x10⁸M-1 and to have good specificity over mismatch sequences.32Hypothesized modes of binding for these polyamides (PAs) are illustrated in
Figure 4. It is proposed that each design will adopt a preferred binding state, either
saturating the available binding sites or by binding alternating sites. The mode of binding
will be dependent upon polyamide-polyamide interactions and polyamide-DNA
6
[image:11.558.72.493.66.316.2]PyPyPpPy-j3-PyPyPyPy-j3-Dp (2)
Figure 3: Heterodimeric polyamide couple ImImImPy-~-PylmImIm-~-Dp, PyPyPyPy-~-PyPyPyPy-~.Dp
and the hairpin ImlmImPy-y-PyPyPyPy-~-Dp
Examples of PA-PA interactions include the potential cation-cation repulsion in the case
of the heterodimer (which may be negated by phosphate contacts) as well as tail-tail
steric interactions, and the possible steric clash of the y-aminobutyric turn residue of one
hairpin with the Dp tail of the following hairpin. PA-DNA interactions include the
distortion of the helix by polyamide binding which may be beneficial or detrimental to a
subsequent binding event.
Following synthesis and characterization for DNA binding affinity, experiments
are performed on polyamide-fluorophore conjugates to study their mode of binding
Heterodimer: Saturating binding sites
S' - A G G G T T A G G G T - 3'
~+
+~
3' - T e e C A 11 T e e C 11 - 5'
Heterodimer: Altemating binding sites
5' - A G G G T T 11 G G G T T A G G G T T A G G G T T A G G G T T A G G G T T - ).
~+
+~
3' - T e e C A A T e C C 11 A T e C C A A T e C C A A T e C C A A T e C C A A - 5'
Hairpin: Saturating binding sites
S' - T T A G G G T r-;-A G G G T r . r G G G Tr ; r A G G G Tr : r A G G 0 T ~ T
•
G G G T T - 3'~ [l 1)- I)r
1
1
J
"
A T C C C • A T C C C A
•
T C C C A A T C C C A • T C C C A~ T C C C A' - ' - ' - '
-3' - A A - 5'
Hairpin: Alternating binding sites
5' - T T A G G G T T ]I. G G G T T A G G G T T A G G G T T A G G G T T 11 G G G T T - 3'
+~
+~
+
~
3' - A A T e C C 11 A T e C C A 11 T e e C A A T e C C A A T e C C A A T e C C A A - 5'
..
..
..
[image:12.559.68.501.60.312.2]..
Figure 4: Ball and stick models of proposed binding modes for heterodimer and hairpin polyamides. Filled circles represent pyrroles, hollow circles imidazoles, diamonds ~-alanine, and arcs and plus signs
represent dimethylamino-propylamine. Red boxes highlight possibl~ polyamide-polyamide interactions.
Results and Discussion
Monomer and Polyamide Synthesis
Boc-protected Py and 1m amino acids were prepared as described previously. 33
Polyamides were prepared by manual solid-phase stepwise synthesis (Figs. 5 and 6) and purified by reverse-phase HPLC. The heterodimeric pair ImImImPy-~-PylmImlm-~-Dp
and PyPyPyPy-~-PyPyPyPy-~-Dp has not yet been further analyzed. ImlmlmPy-y
o
BOC,~---..IlO~"III; .. ;R.E.S.' ...
i, ii, iii
iv-xiii
8
I 0
I O N , J1 0
I 0 £N, J1 £ ir
'N---..IlO~
I O N , J1 ~ ir 'N N H/N~
fir
'N N H Io ) J
0 U N - " -N HI O N
U
N ---..IlN HI
0
£N, J1frN
H
H
N, J1 ~ ir 'N-"-N H
( rr
'N N HN H
xiv
I 0 0
I 0 (NrN---..IlN--- N /'
I 0 (N, J1 J-~ H H \
I O N , JI J-ir 'N
~
f'ir 'N N HI 0 ~I 0 0 ~ /; N-"-N H
I O N , JI ~ f, N---..IlN H
I O N , J1 £ir 'N H H
N, JJ
f'
ir 'N N H [image:13.558.78.496.78.555.2](
f
'~-"-N H1
Figure 5: Sythetic outline for ImlmlmPy~Pylmlmlm~Dp, (i) BO%TFAlDCM/O.5M PhSH; (ii) BoclmlmCOOH,
iv-xvii
xviii
Figure 6: Sytheti
80%TFAlDCM" c outline for PyP P
80%TFAIDC : (Iv)BocPyOBt, DI:/PYbPYPYPYPYbD " 0
('i)SocP'OB~'6~')BOOPyO",
OlEA N:P, (,)BO%lF,:;6~~"
mWCM, (ii)BooP~~i~OOPyOB;' Ol~
,
~:;(t)BO%
iF':;'::;'
(Soc"AI.,HB\,:,!,B~~::)BI
,
DIEA, ::'M":;~''('
,
NMP, "ii', NMP, (,,;;;)
dim"h,,'
.mlO",,,,,'.m,",
",'
BO%TFMlCM,
;"::;,,,),m"h"",";""
'~"')SocPyO"
,
DIEA NM NMP, (.) 80%TF:;~C
P, (") BO%lFNDC:pJC01
BamH I Hind III
5' - GATCCGGTGTCATTTAGGGTTTACGCGGACTCGCGGATTAGGGTTAGGGTTAGGGTTCAGCTA 3'
3' - GCCACAGTa~~TCCCAAATGCGCCTGAGCGCCTAP_TCCCAATCCCAATCCCAAGTCGATTeGA - 5'
single match site triple match s~e
Figure 7: Oligonucleotide insert into pUC19 to create plasmid pJCOl showing single and triple binding sites
Quantitative DNase I Footprintillg Titratiolls
10
To evaluate equilibrium binding affinity for the designed match site and discern the ability of the polyamide to bind match sites in a contiguous repeating sequence (project Aim 1), plasmid pJCOl was constructed containing a single match site for (3) and three
[image:15.558.69.502.51.372.2]~ ~
c c
0 Q) ,.... 0
....
(/) [image:16.558.72.424.46.586.2]0 [3] 0
... rn ,....
c
o
z
u<C<DO
5 ' 3'
I
g c
a t
A T
C G
C G
C G
-
T AA T
A T
} -
C GC G
,
C GT A
A T
5 ' 3' A T
I
c
Gt a C G
a t C G
}
A A T T T a A tC G a t
C G I I
c
G 3 ' 5 'T A 32p
'~ a t
~ ."'ai.:'-' ~
...
-a t
I I
3' 5'
32 P
Figure 8: DNaseI footprinting gel of 3 on 3' 32p labeled pJCOl. Control lane represents and intact fragment. A and G represent sequencing lanes for these bases. D represents DNase control lane, no polyamide. Other lanes
12
bound the match site with a
K.
of 7.2x10⁸M·l (Figure 8). A footprint was observed over the whole triple site region. An average quantitative analysis over the triple site yielded aK.
=
9.2x10⁸ M·l indicating that the polyamides could bind that area with comparableaffmity but unknown mode of binding.
Design and Preparation of Fluorescent Conjugate
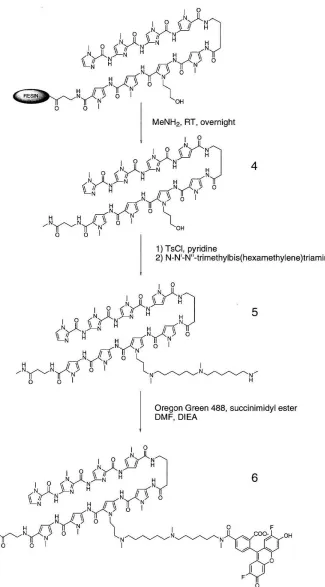
To maintain binding affinity (as it is usually reduced upon conjugation of a polyamide to another molecule), a rational redesign of the molecule was implemented. Exchanging the positions of the Dp tail and a pyrrole N-methyl group has been shown to yield a lO-fold increase in binding affinity with no loss of specificity,35 thus the cationic charge was relocated to the third pyrrole residue. The dye chosen was commercially available Oregon Green 488 (Molecular Probes), which has an excitation/emission spectrum almost identical to fluorescein, but higher photostability. The linker design reflects the need for a tertiary amine on the alkyl pyrrole residue, a nucleophile for dye conjugation, and for the finished conjugate to have a net cationic charge, aiding in solubility.
resulted in ImImImPy-y-PyPy((CH2)30H)PyPy-p-Me (4). The crude material was
extracted, lyophilized, and activated by toluenesulfonyl chloride in pyridine.
Precipitation by ether and nucleophilic displacement by N ,N' ,N"
-trimethylbis(hexamethylene)triamine at 37°C gave the free-amine compound (5), purified
by HPLC. Reaction in dimethylformamide/diisopropylethylamine with the succinimidyl
ester of Oregon Green 488 resulted in 6, subsequently purified by HPLC.
Quantitative DNase I Footprinting Titrations of Fluorescent Conjugate
DNase I footprinting studies were performed with 6 as above (Figure 10). The
conjugate bound the match sequence with a
K.
= 1.8x10⁸M·\ averaged over the triple sitewith
K.
=
2.2x10⁸M·), and bound the match site proximal to the 5' 32p label within thetriple site Ka
=
2.2x10⁸M·) (others not reliably quantifiable due to 3' shift in footprint as
an artifact of DN ase cleavage). Unlike 3, the footprint of this molecule in the triple match
region showed cleavage bands in the center site. This evidence contradicts binding in a
saturation mode.
Fluorescence Titration Experiment
It was discovered that various designs of polyamide-dye conjugates exhibited
fluorescence when in the presence of match DNA, but were quenched over an order of
magnitude when alone in solution.36 The fluorescence was found to be dependent on
~
0v~~
I
O,""0N
N J-N H H
~"
1
~r~
Hy(fN" I I 'N N 1 ~ 0
~N H Hy(f1 N
N 0 I
H g( N
N')('~/ 0 \
~~~g(O~
~~~ ')('~/ ~
o 0 I
MeNH2 , RT, overnight
~
0V~J
I 0 (0N
N Y-N H H
~"
1
~r~
H-!}N
(71 'N N r 1 0
N H
~g(O~
H g( ')('~/
H Hy(f1 N')('~I/ 0 ~
/N~N 0
l
II N OH
o 0 I
1) TsCI, pyridine
4
2) N,N'-N"-lrimethylbis(hexamethylene)triamine
Oregon Green 488, succinimidyl ester DMF, DIEA
~
0V~~
I 0
~"0N
6
N_ Jl Y-N H H
~"
1
~r '~H-!}
N
f
II 'N N r 1 0"-N H ~ g( 0 ~
H g( ')('~/
H Hy(f1 Nr('( 0 \ I 0
/N~N 0
l
NII N N~~N
o 0 I I I
o
Figure 9: Synthesis of fluorescent conjugate (6)
[image:19.558.136.461.79.666.2]mismatch DNA was correspondingly lower. Investigation is proceeding into the mechanism of
this phenomenon.
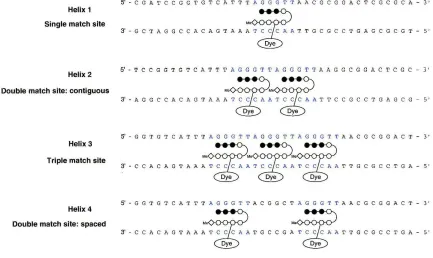
This discovery presented the opportunity to determine mode of binding by
fluorescence increase. A series of DNA helices were designed containing varying
degrees and patterns of match sites (Figure 11). Helix 1 (HI) contained a single match
site, Helix 2 (H2) a contiguous double, Helix 3 (H3) a contiguous triple, and Helix 4
(H4) two match sites separated by six base pairs that constituted a double mismatch. It
was hypothesized that titrating a given helix into a fixed concentration of polyamide
conjugate would result in an increase in fluorescence that would indicate mode of binding
by rate of fluorescence increase over the titration. Titrating HI into a fixed concentration
of polyamide-dye conjugate (PA-dye) was expected to result in a linear increase of
fluorescence until the concentration of HI was equal to that of the PA-dye. The PA-dye
could then be considered titrated and there would be maximal fluorescence. Beyond this
point, no increase in fluorescence should occur. Fluorescence of the P A-dye when
titrated with H2 was expected to be dependent on how the P A bound the contiguous
double site. If the sites could be saturated (two PAs bound) fluorescence should increase
over the titration at double the rate of HI and reach maximal fluorescence when the
16
5' 3'
g
a t
>. T
>. T C G
C G
C G
,
.,
A T
A T
C G
C G
C G
.
,
A>. T
5' 3' >. T
C G
C G
C G
T A
A
T
T-{
G
-c
C G
.-C G
3' 5'
"p T A
3' 5'
"p
..
..
[image:21.558.109.457.52.604.2]-
-
...
...
...
Figure 10: DNaseI footprinting gel of 6 on 5' 32p labeled pJC01. Control lane represents and intact fragment.,
A and G represent sequencing lanes for these bases. D represents DNase control lane, no polyamide. Other
Helix 1 Single match site
Helix 2 Double match site: contiguous
Helix 3
Triple match site
Helix 4
Double match site: spaced
S - eGA T e e G G T GTe A T T T AG G G T T A A C G eGG ACT C G C G C A - 3'
M'il
3' - GeT A G Gee A C A G T A A ATe C C A A T T G C Gee T GAG C G C G T - 5'
Dye
S -Tee G G T GTe A T T TAG G G T TAG G G T T A A G G eGG ACT C G C - 3'
3' • A G Gee A C A G T A A
~
:
'~
A
T Tee Gee T GAG C G - 5'' TC £A! TC £A!
5' - G G T GTe A T T T AG G G T TAG G G T TAG G G T T A A C G eGG ACT - 3'
M
-;
~M'~M'i?
3' - C CAe A G T A A ATe C C A ATe C C A ATe C C A A T T G C Gee T G A - 5'
Dye Dye Dye
5' - G G T GTe A T T T AG G G T T A eGG eT A G G G T T A A C G eGG ACT - 3'
M'i? M'i?
3' - C CAe A G T A A ATe C C A A T Gee GA T C C C A A T T G C Gee T G A - 5'
[image:22.558.69.502.54.312.2]Dye Dye
Figure 11: Schematic of quantitative fluorescence experiment. Ball and stick polyamides are shown as
they would bind by saturation.
the data should resemble that of HI as one polyamide binds the contiguous double site.
In the case of H3, data for saturation should show a fluorescence increase over the
titration at three times the rate of HI and maximal fluorescence when [DNA]
=
1I3[PA-dye]. If the helix is bound by alternation, the data should reflect two polyamides binding.
H4 was designed as a control comparison and to determine if PA-DNA
interactions could effect a PA binding 6bp away (as there should be no PA-PA
interactions). If both sites were occupied, then the data should indicate two PAs binding.
18
An additional P A was designed utilizing a cysteine linker and fluorescein coupled
by maleimide conjugation to imitate the structure of molecules that had shown this effect.
9 was prepared by stepwise solid phase synthesis incorporating a pthalimide protected
arnino-pyrrole in place of the previous Py((CH2)30H) residue (Figure 12). Cleavage from the solid support by methyl amine gave the deprotected, methyl tail polyamide 7.
Subsequent reaction with Boc-Cys-Trt-OBt in DMFIDIEA and linker deprotection with
trifluoroacetic acid and triethylsilane results in the amine/thiol polyamide 8, which was
purified by HPLC. Reaction of the thiol with fluorescein 5-maleimide in the presence of
sodium bicarbonate and an reducing agent yielded 9, purified by HPLC. However, this
molecule displayed poor solubility and thus was not further characterized for its DNA
~
0~~
J
I 0
(0N
N ...L-N H H
I
Jl
i0~
yffN
(~ Nil
N H Hyff1 N
'N N ~ r I ON 0 I
H
n
NNf('~/ 0 \
~~~no~ ~n
...
f('r;.s/NPth
o 0 I
~
0~~J
I 0
~0N
N Jl)'-N H H 7
~
Jl
iir'~HyffN
( II 'N N r 1 0
N H ~
n
0 ~H
n
f('~/H Hy(fl Ny'V
I '0 \
/N~N 0
II N NH2
o 0 I
1 )BOCCysTrt, DCC, HOBt
2) TFA I Et3SiH
~
0if~~
I 0
(0N
N ...LN H H
~.
Jl
ir~
Hy(fN
( II 'N N r I o
~
N H HyQI N
N 0 I
H
n
NH H nNf('( 0 \
/N~Nf('~/ 0 NH
o 0 I ~
o : SH
NH2
Fluorescein-maleimide, NaHC03, H20, DMSO
~
0~~
J
I 0
(0N
N )'-N H H
I
Jl
i0~
y(fN
(~ Nil
N
'NH HyQl N
N ~ r I oN 0 I
H
n
NNf('~/ 0 \
~ ~
n
0 ~ 0"~f('~/ NH ~
o 0 I ~ N
[image:24.558.128.432.41.633.2]o . S I NH:;+ 0
Figure 12: Synthesis of fluorescent conjugate 9
8
9
o
5000
""\
~? 4500 4000 ~3500 ~ -S3000 ~1
\
\
'a 2500
~ .!! 2000 1500
\
1000 500 a 500\
~,,
510Fluorescence Emission Spectrum
.Ao ....
"'~
.
"" , 1:1 polyamide-DNA
,,/
..
.
~
,~
29,6xitlCraase
,,-
,
~,
"-
.
.
...
'...
.~
:~
V
pOlyamlQe a'ione520 530 540 550 560
[image:25.558.70.487.88.357.2]'W aye length (nm)
Figure 13: Fluorescence spectrum of compound 6 alone in aqueous solution and in the presence of
equimolar match DNA
20
The previous conjugate (6) exhibited a 29.6-fold increase in fluorescence in the
1:1 molar presence of single match site DNA as compared to free in solution (Figure 14)
and it was selected for use in the titration experiment.
A 96-well plate assay was developed where the concentration of polyamide
conjugate was held constant and titrated against increasing concentration of helix. Buffer
conditions and equilibration times were identical to footprinting experiments. The
•
.
E'.:I , '.:I
•
•
e '.:I .... '.:INormalized Change in Fluorescence .s. [DNA]/[PA]
1.2
1.1
•
"
.
.
,
.
••
'"
.
..
•
.
D .•
0 .•
,,~ I! .+
•
~ ;'.
"r'y ~
+.
..
'" ,,, ,,.~
•
•
+ 0.7 0 .••
.
~
--.
•
0.5
,.
•
OA ..."...
0.3
...
0.2
+
0.1 .1'
•
0
o 0.1 0.2 0.3 0.4 0.5 0.6 0.7 O.B 0.9 1 1.1 1.2 1.3 1.4 1.5 1.6 1.7 1.8 1.9 2 2.1 2.2 2.3 2.4
(ONA)JIPA]
0.9
0.8
0.7
0 .•
0.5
OA
0.3
0.2
0.1
[image:26.558.115.470.80.302.2]o
Figure 14: Quantitative fluorescence titration for compound 6
linear Region. of fluorescence Titration.
I
. /...
.
"
I
i
//
•
+,,/,
,/
",-/+
, , "f'!
,~/ ,~
:
.
..
/
..
./"-/(
I
/
/
}
.
.
// /
I
,,
/'
.j
"'
.
I• Helix 1
• Helix 2
Helix 3"
X Helix 4 - Linear (Helix 1)
- linear (Helix 2) LiMar (Helix 3)
- linear (Helix 4)
/ ".,+
V
yr '" .o 0.1 0.2 0.3 0.4 0.5 0 .• 0.7 0.8 0.9
(DNA Heolix]l[PA]
Figure 15: Linear regions of quantitative fluorescence titrations on
[image:26.558.117.505.416.657.2]22
Helix polyamide/helix [Helix]/[PA] at max. fluorescence
(extrapolated from linear trend)
1 1.02 0.98
2 2.11 0.460
3 2.25 0.436
[image:27.558.65.517.86.256.2]4 2.17 0.456
Table 1: Least squares regression analysis of quantitative fluorescence titration. Reported numbers are
the average of two experiments.
system, and the individual well images quantified for fluorescent intensity. The results of
the experiments are shown in Figures 14 and 15.values listed in Table 1. The data for HI
supports the predicted 1 PA:1 Helix binding mode for this duplex. Polyamide/helix
=
l.02, very close to the expected value of 1.00. Extrapolation of the trend to maximal
fluorescence increase yields a value of 0.98 DNAlPA, also very close to the predicted
value of l.00.
H2 yielded results comparable to H3 and H4. Polyamidelhelix for H2-H4 were
2.11, 2.25, and 2.17 respectively, and extrapolation of the linear portion of the data shows
DNAIPA values of 0.460, 0.436, and 0.456, each approximating the expected result of
mode of binding by alternation, as the H2 data should have more closely resembled the
HI data and not H3 and H4 if this were the case.
Instead the data suggest that it is possible to bind two contiguous polyamides if no
other match sites are available, but alternation is preferred when more sites are available.
It is hypothesized that this is the result of the ability of the conjugate to tolerate one
proximal polyamide binding (as in the case of H2) but not two (as in the case of H3).
Conclusions
The methyl tail polyamide 6 binds the match sequence 5'-AGGGTT-3' with
K"
=
1.8x10⁸M-1• The manner that it binds contiguous repeats of this sequence is dependent
on their presentation. Two contiguous match sites are bound by two polyamides,
saturating the available sites. Three contiguous match sites are bound by two polyamides
occupying either contiguous or alternating sites.
Conjugate Re-design
As 6 was not able to saturate the triple binding site, molecular design was
reconsidered. It was hypothesized that omission of the ~-alanine residue in the polyamide
tail would relieve steric interference between two polyamides attempting to bind in a
contiguous manner. Polyamide 10 (Fig. 16) was synthesized in a stepwise manner using
Figure 16: Synthesis of truncated tail conjugate 13
10
11
1) TsCI, pyridine, OOC
2) N-N'-N"-trimethylbis(hexamethylene)triamine,
DMF,37"C
Oregon Green-SE, DIEA, DMF
Single Sit" First in Tripi" Sit" Tripie Sit" Av"ril~
Figure 17: DNA binding isotherms for polyamide conjugate 13 on pJC01
amine, the C-tenninal methyl-amide molecule 11 was obtained. Conjugation was then
performed as before, yielding 13.
Quantitative DNase I Footprillting Titrations of Fluorescent Conjugate 13
DNase I footprinting was performed with 13 as before. (Fig. IS). The conjugate
bound the match sequence with Ka = S.7xl07
M-\ the first site in the triple match with Ka
=
1.2x10⁸M-1
and averaged over the triple match site with Ka
=
l.lx108M-1
•
MPE Footprinting of Fluorescent Conjugate 13
To obtain a highly resolved footprint of both conjugates, MPE studies were
performed with 4nM-4~M conjugate equilibrium concentrations (Fig. 19). The short-tail
conjugate showed a footprint over the entire triple site region at the highest concentration
performed, the same concentration at which it gave a total footprint over the single site.
The p-alanine containing conjugate was unable to completely protect the triple site at
26
::. c:
'"
o [13]
3' 5'
9
•
:
~
A
G C
G C " .
G C
a Me t
)
i}--{
:
~
:
G C
3' S' G C".
G C
a
a Met
:
n;
~
~
~ G C
5' 3' G C " .
"p
G C
-
...
I
a Met
5' 3'
[image:31.562.123.487.144.591.2]"p
3' 5'
g
a
T
ijs
'
T A
G C
G C ~
G C
a Me t
T
~
ijs
'
~-
--{
a Me t
T
Tffi
AG C
G C ~
G C
5'
"'p
~e t
a
3'
3' 5'
a t
:
ffi
~
-{
T A
G C
G C ~
G C
I Met
a
a
5' 3'
[image:32.559.132.462.178.648.2]" p
Helix 1 Single match site
Helix 2
Double match site: contiguous
Helix 3
Triple match site
Helix 4
Double match sHe: spaced
5'· eGA Tee G G T G 'I" CAT T T AG G G T T A A C G e GG:'. C -T C G C G C A - 3'
3' • GeT ,. G Gee ,. C A G T A A
~A
~T~Aj ' T G C Gee T GAG C G C G T • 5'5'· Te e G G T GTe A 'I' '1' TAG G G T TAG G G T T A A G G eGG ACT C G C - 3'
3'· A G Gee A C A G T A A
:~2
TC£A.;'I"Ci£~} T Tee Gee T GAG C G - 5'5'· G G T GTe A T T TA G G G T TAG G G T T;'. G G G T -1' A A C G eGG AC T - 3'
3' • C C A e A G , A , • •
2~~
,.
T
CifbA;'
. T
Cifb;'·
A
T
(jjI)""]'
T T G C Gee T G A - 5'5' • G G T GTe :.. T T T ;.. G G G T T A e GG C T;'. G G G T T A 1-. C G eGG ACT - 3'
3'· C CAe A G T A ,.
2
~T
Cifb
A
;
.
T Gee G2
~T
Cit"
~ T T G C Gee T G A - 5'28
Helix 5
Triple match sHe: spaced
5' - G G T GTe A T T T " G G G T T A eGG e T A G G G T T A eGG e TA G G G T T A. A C G eGG AC T - 3'
[image:33.558.75.443.51.320.2]3' - C CAe A G T A A
~A
;T~Al T Gee G~A
1,.T~Ai T GeeG~.
"T~Ai T T G C Gee T G A - 5'Figure 20: Helices for new series of titrations including spaced triple match H5.
evidence supports the saturation mode of binding for the short-tail compound (13) and
contradicts it for the long tail compound (6).
Fluorescence Titration Experiment with Both Conjugates
The fluorescent titration of both compounds was performed as before with the
addition of a new helix (Fig. 20). U5 contained three binding sites separated by six
base-pairs each. This design should completely remove steric effects between polyarnides
binding 3: I with the helix and would allow for the observation of the fluorescence
[Helix](IlM)
5 2.5 1.5 1 0.88 0.75 0.65 0.5 0.4 0.3 0.2 0.1
H1 • • • • • • • • • •
H2
eeeeeeeee
e
e
H 3 . , • • • • • • • • • • •
H4 • • • • • • • • • • •
HS • • • , • • • • • • • • •
Compound 6 (1 j..LM)
[Helix](j..LM)
5 2.5 1.5 1 0.88 0.75 0.65 0.5 0.4 0.3 0.2 0.1
H1 • • ' • • • • • • •
H2 • • • , • • • • • • • •
H3 • • , • • • • • • • • • •
H4 • • • • • • • • • • •
HS • • • • • • • • • • • •
[image:34.558.120.447.51.439.2]Compound 13 (1 j..LM)
Figure 21: Fluorescence intensity image of 96-well plate titrations
Conjugate 6 yielded results similar to the first series of titrations for Hl-4. A least
squares regression analysis of the linear portion of the normalized data resulted in the
values for polyamide per helix in Table 2. HS showed a value of 2.74 polyamides per
helix, approximating the theoretical value of 3.00.
The titration data for 13 did not maintain linearity as far as the data for 6. This
1.2
x
· 'lK x
•
•
lK
•
*
I" 0.2•
o O.OOE+OO • • • • 1.2t 0.8
=
1
~_O.6.!
..
JI:
x ;t:.c x i"
JI: 1i •
,"""
.
..
•
•
•
*
*
1.00HOO
Normalized Titration Results for Compound 6
x !i
!
2.00E+OO 3.00£+00
[DNA)/[PAI
4.00£+00
/I<
[image:35.558.77.466.81.324.2]5.00£+00 6.00£+00
Figure 22: Quantitative fluorescence titration for compound 6
Normalized Titration Results for Compound 13
•
JI:~
i
lKX X
JI:
•
..x
x . X
•
*
•
X.
)(••
•
.
'
.
i
~O.4
..
•
z
..
•
x _
..
0.2
-
.
-•
o
0.00£+00 5.00E-01 1.00£+00 1.50E+00 2.00£+00 2.50E+00 3.00E+00 3.50E+00 4.00£+00 4.50£+00 5.00E+OO
[image:35.558.77.473.417.667.2][DNAIIIPA)
Figure 23: Quantitative fluorescence titration for compound 13
linear Region of Compound 6 Titration
0.9~---,
o 0.05 0.1 0.15 0.2 0.25 0.3
[image:36.558.77.472.84.321.2](DIIA)I(PA)
Figure 24: Linear region of quantitative fluorescence
titration for compound 6
linear Region of Compound 13 Titration
0.35
0.6~---~---
__ --,
o 0.02 0.04
0.06
0.08 0.1 0.12 0.14 0.16 0.18 [image:36.558.67.469.409.655.2](DIIA)I(PA)
Figure 25: Linear region of quantitative fluorescence titration for compound 13
0.2
• HI
• H2
H3
X H4
'" H5
- linear (HI)
- Linear (H2)
- linear (H4)
linear (H3) - linear (H5)
• HI
• H2
H3 )( H4
'" H5
- Linear (HI)
- linear (H2) Linear (H3)
- Linear (HS)
32
Helix [Helix]/[PA] at maximum polyamides per helix
fluorescence
1 0.990 l.01
2 0.565 l.82
3 0.435 2.35
4 0.510 l.96
5 0.379 2.74
Table 2: Least squares regression analysis of quantitative fluorescence titration on compound 6.
Numbers are the average of three experiments.
Helix [Helix]/[PA] at maximum polyamides per helix
fluorescence
1 1.39 0.76
2 0.641 l.65
3 0.352 2.84
4 0.704 1.53
5 0.410 2.52
Table 3: Least squares regression analysis of quantitative fluorescence titration on compound 13. N umbers are the average of three experiments.
polyamide per helix values. HI yielded a polyamide/helix value of 0.76, approximating
the theoretical value of l.00. H2 and H4 yielded comparable results to each other, 1.65
[image:37.558.61.507.65.273.2] [image:37.558.59.505.324.535.2]values of 2.84 and 2.52 respectively, approximating the theoretical value of 3.00. The
observation that H2 and 04 follow similar trends and that H3 and H5 follow similar
trends provides evidence that 13 can bind the repeat sequence contiguously.
Conclusions
The ~-methyl tail compound (6) binds the match sequence 5'-AGGGTT-3' with
Ka
=
1.8x10⁸M-1
• The truncated methyl tail compound (13) binds the match site
5'-GGGTT-3' with Ka =- 8.7x10⁷
M-1
• MPE footprinting illustrates that 6 is unable to bind
contiguously three adjacent match sites at the highest concentration tested, but the
short-tail conjugate 13 protects all three sites from cleavage. Fluorescence titration data
compliment this result and evidence that 13 can bind three 5'-TTAGGG-3' sites
contiguously.
Discussion
The data suggest that in the model case of 5'-(TTAGGGk3', a steric clash or
other localized polyamide-polyamide interaction occurs when the sequence is targeted
using a ~-methyl tail eight ring hairpin polyamide. This prevents the molecule from
consistently binding the three contiguous sites, as evidenced by MPE footprinting and
fluorescence titrations. Omission of the ~-alanine residue to form 13 appears to relieve
34
Experimental
Materials
Boc-protected monomers were prepared as described previously.33
Dicyclohexylcarbodiimide (DCC), Hydroxybenzo-triazole (HOBt) and were purchased
from Peptides International. N,N-diisopropylethylamine (DIEA), N,N
-dimethylformamide (DMF), dimethylaminopropylamine, N,N' ,N"
-trimethylbis(hexamethylene)triamine, pyridine, dimethylsulfoxide (DMSO),
triethylsilane, and toluenesulfonyl chloride were from Aldrich. Trifluoroacetic acid
(TFA) was from Halocarbon. UV-spectra were measured on a Beckman-Coulter DU
-7400. MALDI-TOF was performed at the Protein and Peptide Microanalytical Facility at
Caltech. Analytical HPLC was performed on a Beckman Gold system using a Rainin
C18, Microsorb MV, 51lm, 300x4.6mm reversed phase column with a 0.1 % w/v
TFAIacetonitrile gradient. Preparatory HPLC was performed on a Beckman HPLC with a
Waters DeltaPak 25xlOOmm, 100llm C18 column with a 0.1 % w/v TFAIacetonitrile
gradient. Water was obtained from a Millipore MilliQ system, 0.21lm filtered.
Synthesis of Polyamides and Conjugates
ImlmImPy-p-Pylmlmlm-p-Dp (1) ImImImPy-~-PyImImIm-~ -Pam resin was
sample of the resin was treated with neat (dimethylamino)-propylamine (1.5mL) and heated (3rC, 18 hours). The reaction mixture was then filtered diluted to 8mL with 0.1 % w/v trifluoroacetic acid, and purified by reversed phase HPLC. ImImIrnPy-p-PylmImIm-p-Dp was recovered as a white powder upon lyophilization of the appropriate
fractions (4.0mg, 5.0% recovery). ESI-MS[M+Ht calc. 1212.5 for CS3H66N250JO+found 1212.6.
PyPyPyPy-~-PyPyPyPy-~-Dp (2) PyPyPyPy-P-PyPyPyPy-p-Pam resin was synthesized
in a stepwise fashion by Boc-protected manual solid phase protocOIS.33 A sample of the resin was treated with neat dimethylaminopropylamine (2mL) and heated (37°C, 18 hours). The reaction mixture was then filtered diluted to 8mL with 0.1 % w/v trifluoroacetic acid, and purified by reversed phase HPLC. PyPyPyPy-P-PyPyPyPy-P-Dp was recovered as a white powder upon lyophilization of the appropriate fractions (l4.5mg, 6.3% recovery). ESI-MS[M+Ht calc. for C59HnN190jQ+ 1206.6 found 1206.7.
ImlmlmPy-'Y-PyPy((CH2)30H)PyPy-~-Me (4) ImImImPy-y-PyPy((CH2)30H)Py-p-Pam
36
CH3CN:1M NH40H, filtered to remove resin, flash-frozen and lyophilized. Crude
material was used without further purification. (42.6mg, 47.9% crude yield).
ESI-MS[M+Ht calc. for C59H75NnOll+ 1267.6 found 1267.S.
ImlmImPy-,,(-PyPy((CH2)3N,N',N"-trimethylbis(hexamethylene)triamine)PyPy-~
Me (5) ImlmlrnPy-y-PyPy(CH2)30H)PyPy-~-Me (33.6Ilmol crude from above) was
dissolved in 1mL anhydrous pyridine and cooled to O°C. Tolulenesulfonyl chloride
(l44mg) was dissolved in 600llL anhydrous pyridine and cooled to O°C. The tosyl
chloride solution was then added to polyamide solution with vigorous mixing. Reaction
allowed to proceed for 1 hour at O°C, completion indicated by analytical HPLC. Product
precipitated by addition of ether, solution decanted, washed in triplicate, and solids dried
in vacuo. Product was divided into four aliquots, each dissolved in 300llL pyridine. To
each was added SOOIlL N,N' ,N" -trimethylbis(hexamethylene)triamine and 100llL
anhydrous dimethylforrnarnide. Reactions were shaken at 37°C for 2 hours, monitored by
analytical HPLC. Upon completion, product was precipitated as before, dried in vacuo,
dissolved in 2% w/v trifluoroacetic acid and purified by HPLC. (2.Smg, 4.S% recovery).
ESI-MS[M+Ht calc. for C7oH9~2401O+ 143S.S found 1436.0.
ImImImPy -,,(-PyPy( (CH2)3N ,N' ,N' , -trimethylbis(hexamethylene
)triamine-OregonGreen488) PyPy-~ -Me (6) IrnIrnIrnPy-y-PyPy((CH2)3N,N',N"
anhydrous dimethylforrnamide. Oregon-Green 488-succinimidyl ester (2.9Ilmol) was
dissolved in 170llL dimethylforrnamide and added to the polyamide solution with 200llL
diisopropylethylamine. Mixture was allowed to react overnight at room temperature.
Product precipitated by ether addition, washed, and dried in vacuo. Product dissolved in
a minimum amount of acetonitrile, diluted to 4mL with 0.1 % w/v trifluoroacetic acid and
purified by HPLC. (0.54mg, 14.1% recovery). MALDI-TOF-MS[M+Ht calc. for
(7) I m I m ImP Y
-
r
-PyPy((CH2)3NPthalimide)PyPy-~-Pam resin was synthesized in a stepwise fashion by
Boc-protected manual solid phase protocols.33 A sample of resin was placed in a Parr
-bomb apparatus cooled in dry ice/isopropanol. Approximately 60mL of condensed
methylamine was added, the bomb sealed and allowed to stand at room-temperature
overnight with occasional swirling. The bomb was then opened, methylamine allowed to
evaporate. Residue dissolved in 1:1 CH3CN:IM NH40H, filtered to remove resin, flash
-frozen and lyophilized. Crude material was used without further purification. (117.2mg,
66.3% crude yield). MALDI-TOF-MS[M+Ht calc. for C5sH66N2201O+ 1195.5 found
1195.6.
ImlmlmPy-'Y-PyPy((CH2hNH-Cys)PyPy-~ • Me
( 8 )
ImImImPy-y38
BocCysTrt (0.142mg) was activated with DCC (60mg) and HOBt (42mg) for 25 minutes,
then added to the polyamide solution through a disposable polypropylene fIlter. Mixture
was shaken at room temperature for four hours. DMF was removed in vacuo. Compound
was deprotected with ImL trifluoroacetic acid and 200mL triethylsilane for 10 minutes. Mixture was fIltered, diluted to 8mL with 0.1 % w/v trifluoroacetic acid, and purified by HPLC. (2.8mg, 6.1% recovery). MALDI-TOF-MS[M+Ht calc. for C58H72N23011S+
1298.6 found 1298.7.
ImlmImPY-'Y-PyPy((CH2hNH-Cys-Fluorescein-5')PyPy-~ -Me (9)
ImImlrnPy-'Y-PyPy((CH2)3NH-CyS)PyPy-~-Me (1. 141lmol) was dissolved In 1271lL of
dimethylsulfoxide. 100mM sodium bicarbonate (475IlL) was added. Tris(carboxyethyl)phosphine (TCEP, 12.7mg) was dissolved in 100mM sodium bicarbonate (l80IlL), and 12.71lL of the resulting solution added to the polyamide solution. Fluorescein-5'-maleimide (7.9mg) was dissolved in 100llL dimethylsulfoxide
and 91lL of the resulting solution added to the reaction mixture. Mixture shaken
overnight. Diluted to 5mL with 0.1 % w/v trifluoroacetic acid, purified by HPLC.
(0.35mg, 16.8% recovery). MALDI-TOF-MS[M+Ht calc. for C82H85N24018S+ 1725.6
found 1725.8.
ImImImPY-'Y-PyPy((CH2)30H)PyPy-Me (11) ImImlrnPy-y-PyPy((CH2)PH)Py-Oxime
protocols.3? A sample of resin was placed in a Parr-bomb apparatus cooled in dry
ice/isopropanol. Approximately 60mL of condensed methylamine was added, the bomb
sealed and allowed to stand at room-temperature overnight with occasional swirling. The
bomb was then opened, methylamine allowed to evaporate. Residue dissolved in 1:1
CH3CN:IM NH40H, filtered to remove resin, flash-frozen and lyophilized. Crude
material was used without further purification. (33.4mg, 28% crude yield).
ESI-MS[M+Ht calc. for C52H61N20010+ 1125.5 found 1125.7.
ImlmImPy -"(-PyPy( (CH2)3N ,N' ,N" -trimethylbis(hexamethylene )triamine )PyPy -Me
(12) ImImImPy-y-PyPy(CH2)30H)PyPy-Me was treated as 4. (l.3mg, 2.3% recovery).
MALDI-MS[M+Ht calc. for C67H94N2309+ 1364.8 found 1365.0.
ImlmImPy -"(-Py Py( (CH2)3N ,N' ,N" -trimethy Ibis(hexamethylene
)triamine-OregonGreen488)PyPy-Me (13) ImImlmPy -,,(-PyPy«CH2)3N,N' ,N" -trimethyl
bis(hexamethylene)triamine)PyPy-Me (0.97J.lmol) was treated as 5. (0.6mg, 36.2%
recovery). MALDI-MS[M-t calc. for CS9H102N23014" 1754.8 found 1754.9.
DNA Reagents and Materials Enzymes were purchased from Boehringer-Mannheirn
and used with their supplied buffers. 32p Cf.- and "(-labeled nucleotides were purchased
from Amersham. Calf thymus DNA (sonicated, deproteinized) and DNaseI (7500UlrnL,
40
water, and O.SM EDTA were purchased from US Biochemicals. XGal and IPTG were
from ICN Biomedicals. Ampicillin trihydrate was acquired from Sigma. Ethanol (abs.)
was purchased from Equistar. Calcium chloride, potassium chloride, and magnesium
chloride were from Fluka. Formamide and pre-mixed tris-borate-EDTA (Gel Mate) were
from Gibco. Bromophenol blue was from Acros. All reagents were used without further
purification.
Construction of Plasmid DNA The plasmid JCOl was constructed by hybridization of
the inserts S' -GATCCGGTGTCATTT AGGGTTTACGCGGACTCGCGGATT
AGGGTTAGGGTTAGGGTTCAGCTA-3' and S'-AGCTTAGCTGAACCCTAA
CCCT AACCCTAATCCGCGAGTCCGCGT AAACCCT AAATGACACCG-3' . The
hybridized insert was ligated into linear pUC19 BamHIIHindIlI plasmid using T4 DNA
ligase. The resulting constuct was transfected into JM109 competent cells from Promega.
Ampicillin-resistant white colonies were selected from 2SmL Luria-Bertani (LB) medium
agar plates (containing SOllg/mL ampicillin and treated with XGAL and IPTG). Plasmid purification was performed with Qiagen Midi-Prep purification kits. Dideoxy sequencing
was used to verify the presence of the insert. The concentration of the resulting plasmid
Preparation of 3' and 5' End Labeled Fragements
End labelled fragments used in DNase I quantitative footprinting titrations were
prepared according to previous methods.34
Quantitative DNase I Footprinting Titrations34
All reactions were carried out in a volume of 400 ilL. No carrier DNA was used
in these reactions until after DNase I cleavage. A polyamide stock solution (or water for
reference and intact lanes) was added to an assay buffer where the final concentrations were lOmM Tris'HCI buffer (pH 7.0), lOmM KCI, 10mM MgCI2 , 5mM CaCI2, and
25kcpm of 32p radiolabeled DNA. The solutions were allowed to equilibrate for 12-18
hours at 22°C. Cleavage was initiated by addition of 10IlL of DNase I stock solution
(diluted with ImM DTT to give a stock concentration of l.13U/rnL) and allowed to proceed for 7 minutes at 22°C. The reactions were stopped by adding 50llL of a solution
containing 2.25M NaCI, 150mM EDTA, 0.6 mg/rnL glycogen, and 30 11M base pair calf
thymus DNA, and then ethanol precipitated (2.1 volumes). The cleavage products were
washed with 75% ethanol, resuspended in 1611L RNase free water, lyophilized to dryness,
and then resuspended in 100mM tris-borate-EDTAl80% formamide loading buffer (with
bromophenol blue as a dye), denatured at 90°C for 10 minutes and loaded onto a pre-run
42
gels were then dried in vacuo at 80°C and exposed to a storage phosphor screen
(Molecular Dynamics).
Quantitation and Data Analysis of Footprinting Titrations34
Data from the footprint titration gels were obtained using a Molecular Dynamics
Typhoon imaging system followed by quantitation using Image Quant software
(Molecular Dynamics). Background-corrected volume integration of rectangles
encompassing the footprint sites and a reference site at which DNase I reactivity was
invariant across the titration generated values for the site intensities (lsi'e) and the
reference intensity (l,ef). The apparent fractional occupancy (8app) of the sites were
calculated using the equation:
8app
=
1-Isiu!Iref
lsi te °/Ire/
(1)
where IsiteO and I,efo are at the site and reference intensities, respectively, from a control
lane to which no polyamide was added. The ([L]to" 8app) data points were fit to a general
Hill equation (eq. 2) by minimizing the difference between 8app and 8fit:
(2)
where [L]to' is the total polyamide concentration,
K.
is the equilibrium associationconstant, and 8min and 8max are the experimentally determined site saturation values when
least-squares fitting procedure (using Ka1eidagraph software) with K,., 8mi ", and 8max as
the adjustable parameters and a fixed value for n. The binding isotherms were
normalized using the following equation:
8app - 8m in
8max - 8min
(3)
Reported association constants are the average value obtained from at least three
independent footprinting experiments.
96-W ell Plate Titration Assays
Oligonucleotides were obtained from the Caltech Oligonucleotide Synthesis
Facility and used without further purification. Complementary strands were annealed in
lxTE (Tris-EDTA, Aldrich) buffer. All equilibrations were carried out in a volume of
140llL with buffer conditions and equilibration times identical to those used in
footprinting experiments. Plates were imaged on a Molecular Dynamics Typhoon
imaging system and images quantified using Image Quant software. Reported data are the
average of two experiments in the case of the first series on compound 6, three
References
1. Watson, J. D.; Crick, F. H. C. Nature 1953,171,737-738.
2. Branden,
c.;
Tooze, 1 Introduction to Protein Structure (Garland, New York),1991,83.
3. Kielkopf, C. L.; White, S.; Szewczyk, J.W.; Turner, J. M.; Baird, E.E.; Dervan,
P.B.; Rees, D.
c.;
Science 1998,282,111-115.4. Trauger, J.W.; Baird, E.E.; Dervan,P.B. Nature 1996, 382, 559-561.
44
5. Swalley, S.E.; Baird, E.E.; Dervan,P.B. 1. Am. Chern. Soc. 1997, 119,6953-6961.
6. Turner, 1M.; Baird, E.E.; Dervan,P.B. 1. Am. Chem. Soc. 1997, 119,7636-7644.
7. Trauger, J.W.; Baird, E.E.; Dervan,P.B. Angew. Chem. Int., Ed. Engl. 1998,37,
1421-1423.
8. Turner, J.M.; Swalley, S.E.; Baird, E.E.; Dervan,P.B. 1. Am. Chem. Soc. 1998,
120, 6219-6226.
9. Urbach, A.R.; Szewczyk, J.W.; White, S.; Turner, 1 M.; Baird, E.E.; Dervan,P.B.
1. Am. Chem. Soc. 1999, 121, 11621-11629.
10. Kelly, J.J.; Baird, E.E.; Dervan,P.B. Proc. Natl. Acad. Sci. U. S. A. 1996,93,
6981-6985
11. Trauger, 1W.; Baird, E.E.; Mrksich, M.; Dervan,P.B. 1. Am. Chem. Soc. 1996,
118,6160.
13. Trauger, I.W.; Baird, E.E.; Dervan,P.B. 1. Am. Chem. Soc. 1998, 120,3534.
14. Dickinson, L. A.; Gulizia, R 1; Trauger, I.W.; Baird, E.E.; Mosier, D.E.;
Gottesfeld, I.M.; Dervan,P.B. Proc. Natl. Acad. Sci. U. S. A. 1998,95, 12
890-12895.
15. Mapp, AK.; Ansari, AZ; Ptashne, M.; Dervan,P.B. Proc. Natl. Acad. Sci. U. S.
A. 2000, 97, 3930-3935.
16. Blackburn, E.H. Cell 1994, 77,621-623.
17. Moyzis, R K.; Buckinham, I.M.; Cram, L.S.; Dani, M.; Wu, I.R Proc. Natl.
A cad. Sci. U. S. A. 1988, 85, 6622-6626.
18. Muniyappa, K.; Kironmai, K.M Crit. Rev. Biochem. Mol. Biol.1998, 33, 2
97-336.
19. Zakian, Y.A Annu. Rev. Genet. 1996, 30, 141-172.
20. Allsopp, R.C.; Vaziri, H.; Harley, C.B. Proc. Natl. Acad. Sci. U. S. A. 1992,89,
10114-10118.
21. Vaziri, H.; Schachter, F.; Uchida, I.; Wei, L.; Harley,
c.B.
Am. 1. Hum. Genet.1993,52,661-667.
22. Vaziri, H.; Dragowska, W.; Allsopp, RC.; Landsorp, P.M. Proc. Natl. Acad. Sci.
u.
S. A. 1994,91,9857-9860.23. Harley, C.B.; Vaziri, H.; Counter, C.M.; Allsopp, RC. Exp. Gerontal. 1992,27,
46
24. Shay, J.W.; Wright, W.E. Science 2001, 291, 839-840.
25. Shay, J.W. Exp. Cell Res. 1991, 196,33-39.
26. Bodnar, A.G.; Ouellette, M.; Frolkis, M.; Holt, S.E., Shay, lW., Wright, W.E.
Science 1998, 279, 349-352.
27. Hayflick, L.; Moorhead, P.S. Exp. Cell Res. 1961, 25, 585. 28. Campisi, J.; Cell 1996, 84,497.
29. Wright, W.E.; Shay, J.W. Exp. Gerontal. 1992,27,383-389.
30. Kim, N.W. et al. Science 1994, 266, 2011-2015.
31. Poon, S.S.; Martens, D.M.; Ward, RK.; Landsorp, P.M. CytometlY 1999, 36, 267
-278.
32. Swalley, S.E., Baird, E.E.; Dervan, P.E. J. Am. Chern. Soc. 1996, 118, 8198-8206.
33. Baird, E.E.; Dervan, P.B. J. Am. Chern. Soc. 1996, 118,6141. 34. Trauger, J.W.; Dervan, P.B.; in press
35. Bremmer, R.B., Wurtz, N.R; Dervan, P.E. in press
36. Rucker, V.c., Melander, c.; Foister, S.; Dervan, P.B. manuscript in preparation
37. Belitsky, J.M.; Nguyen, D.H.; Wurtz, N.R ; Dervan, P.E. manuscript in
prepartion