Multiple Sclerosis with Magnetization Transfer
Rahul C. Mehta, G. Bruce Pike, and Dieter R. Enzmann
PURPOSE: To determine whether magnetization transfer imaging can improve visibility of contrast enhancement of multiple sclerosis plaques. METHODS: Fifty-nine enhancing and 63 nonenhanc-ing lesions in 10 patients with multiple sclerosis were evaluated to calculate contrast-to-noise ratios on conventional T1-weighted and T1-weighted magnetization transfer images. The signal intensity of the lesion and the background (white matter) were measured on precontrast T1-weighted and T1-weighted magnetization transfer images (800/20/1 [repetition time/echo time/excitations]) and on postcontrast T1-weighted and T1-weighted magnetization transfer images. Mean contrast-to-noise ratios was calculated for all lesions. RESULTS: The contrast-contrast-to-noise ratio was signifi-cantly higher for enhancing and nonenhancing lesions on T1-weighted magnetization transfer images than on conventional T1-weighted images. For enhancing lesions, the contrast-to-noise ratio was significantly higher on postcontrast T1-weighted magnetization transfer images, 3262 compared with 2162 on conventional T1-weighted images. Fifty of the 59 enhancing lesions were seen on both the T1-weighted and the T1-weighted magnetization transfer images. Nine enhancing lesions were seen only on the postcontrast T1-weighted magnetization transfer images. In addition, of 63 nonenhancing lesions seen on proton-density, T2-weighted, and T1-weighted magnetization transfer images, 16 were not seen on the conventional T1-weighted images. Seven of the 63 nonenhancing lesions and 7 of the 59 enhancing lesions had high signal intensity on the precon-trast T1-weighted magnetization transfer images suggestive of lipid signal, a finding not seen on the conventional precontrast T1-weighted images. CONCLUSION: Magnetization transfer improves the visibility of enhancing multiple sclerosis lesions, because they have a higher contrast-to-noise ratio than conventional postcontrast T1-weighted images. High signal intensity on both nonen-hancing and ennonen-hancing lesions noted only on precontrast T1-weighted magnetization transfer suggests a lipid signal was unmasked. If magnetization transfer is used in multiple sclerosis patients, a precontrast magnetization transfer image is necessary.
Index terms: Sclerosis, multiple; Magnetic resonance, contrast enhancement; Magnetic resonance, magnetization transfer
AJNR Am J Neuroradiol16:1771–1778, October 1995
Multiple sclerosis (MS) is a complex disease with a relapsing and remitting course. Often the extent of the disease seen on magnetic reso-nance (MR) examination is more dramatic than the clinical symptoms suggest. This indicates
that not all plaques seen on MR images contrib-ute to clinical symptoms, and not all are active (1, 2). The sensitivity of MR for white matter abnormalities has made it the imaging modality of choice for MS. With MR, one can assess the number, size, and location of MS lesions. MR can characterize lesions with T1-weighted, T2-weighted, and now with magnetization transfer relaxation parameters. An underlying assump-tion is that acute lesions represent potentially reversible disease, whereas chronic lesions (de-myelinated) do not. Differentiating these le-sions, therefore, has clinical importance in as-sessing various treatment modalities. On
long-Received October 26, 1994; accepted after revision April 19, 1995. From the Department of Radiology, Stanford (Calif) University School of Medicine.
Address reprint requests to Dieter R. Enzmann, MD, Department of Radiology, S047, Stanford University School of Medicine, Stanford, CA 94305-5105.
AJNR 16:1771–1778, Oct 1995 0195-6108/95/1609 –1771 qAmerican Society of Neuroradiology
repetition-time/long-echo-time pulse se-quences, both active and nonactive lesions of MS have a hyperintense signal. In vitro relax-ation studies indicate an increase in T1 and T2 relaxation times as plaques age (3), but there is no simple correlation between relaxation times and lesion activity. Thus relaxation times do not allow clear distinction between acute and chronic MS lesions (4, 5). New white matter lesions may not be significantly demyelinated and thus may be poorly seen on T1-weighted images but appear as high signal intensity on the T2-weighted images. In addition, lesions may exhibit contrast enhancement and not be visible on T2-weighted images. At present, this highly sensitive technique lacks the specificity to characterize the stage of the disease process, but the combination of multiple parameters may offer the opportunity to separate inflam-mation and edema from demyelination to as-sess disease burden.
Contrast enhancement is an important crite-ria for acuteness and inflammatory activity. The use of gadopentetate dimeglumine allows the differentiation of inflammatory and presumably active from nonactive lesions by revealing dis-ruption of the blood-brain barrier. In MS, the breakdown of the blood-brain barrier is a local-ized phenomenon and can occur in active plaques or at the periphery of chronic reacti-vated plaques. Plaques are not homogenous in their stage of disease. The information gained with gadolinium enhancement is thus useful in gauging the activity of MS (1, 2). The ability to distinguish active from nonactive plaques could help in understanding the natural course of the disease and assessing the effect of treatment. Efforts to improve the detection of contrast-enhancing lesions and their differentiation from background white matter on MR imaging have recently led to magnetization transfer imaging (6).
Magnetization transfer imaging has been shown to improve the contrast-to-noise ratios in contrast-enhancing lesions and MS plaques (7–10). We prospectively studied the effect of magnetization transfer on precontrast and post-contrast T1-weighted with magnetization trans-fer images in MS patients to determine whether magnetization transfer imaging can improve the visibility of MS plaques as measured quantita-tively with contrast-to-noise ratios.
Materials and Methods
The study population consisted of 10 patients (4 men, 6 women; age range, 25 to 65 years; average age, 40.2 years) with definite MS diagnosed clinically (Poser criteria) (11) with supporting laboratory data. MR imaging was performed on a 1.5-T unit. The protocol for imaging pa-tients with MS was as follows: (a) sagittal T1-weighted (800/20/1 [repetition time/echo time/excitations]); 5-mm sections with 2.5-mm intersection spacing); (b) axial con-ventional proton-density and T2-weighted (2000/30,80/2; 4-mm sections with 1.0-mm intersection spacing); (c) ax-ial precontrast T1-weighted, with and without magnetiza-tion transfer (800/20/1; 5-mm secmagnetiza-tions with 1.0-mm in-tersection spacing); and (d) axial postcontrast T1-weighted with and without magnetization transfer (800/ 20/1; 5-mm sections with 1.0-mm intersection spacing). The precontrast and postcontrast T1-weighted magnetiza-tion transfer sequences were incorporated into this imag-ing protocol for all patients suspected of havimag-ing MS since September 1991. All patients signed a written consent form allowing the additional magnetization transfer se-quence. Gadopentetate dimeglumine was used at a dose of 0.1 mmol/kg. The postcontrast weighted and T1-weighted magnetization transfer imaging was done in ran-dom order. Each of the postcontrast sequences T1-weighted and T1-T1-weighted magnetization transfer is 3 minutes 35 seconds. Thus, a total of approximately 8 to 9 minutes elapsed between infusion of contrast and comple-tion of all postcontrast T1-weighted axial sequences. The patient population was a subset of 29 patients undergoing longitudinal MR examinations since early 1991 (12, 13). These 10 patients had both contrast-enhancing and non-enhancing lesions on conventional weighted and T1-weighted magnetization transfer scans. A total of 20 MR examinations yielded 59 enhancing lesions and 63 nonen-hancing lesions. The selection criteria for lesions was con-trast enhancement on either T1-weighted or T1-weighted magnetization transfer images, where enhancement was defined as a signal intensity increase between precontrast and postcontrast images. Three to 4 enhancing lesions per MR scan were randomly selected. A similar number of nonenhancing lesions (comparable in size and location) also were selected if they were discrete lesions identified on the T2-weighted (echo time, 80) images and showed no change in signal intensity between precontrast and postcontrast images.
Magnetization transfer was performed with an on-reso-nance, 081-2-1 binomial pulse (190,2180,190) to sat-urate the restricted hydrogen protons (Hr) pool (14, 15).
This pulse has a broad passband with no significant satu-ration of free hydrogen protons (Hf) and is reasonably
insensitive to the B0inhomogeneities. After testing a
vari-ety of binomial pulses, the 1-2-1 pulse was found to be the best compromise between Hrsaturation and Hfbandwidth.
repetition times (800/20/1) (15). The specific absorption rate was well below the Food and Drug Administration limits; average specific absorption rate was 0.04 W/kg, and peak specific absorption rate was 2.53 W/kg for any gram of cranial tissue. Contrast enhancement was quan-titatively assessed using contrast-to-noise ratio. The con-trast-to-noise ratios were calculated using the following formula:
Contrast-to-noise ratio 5 Signallesion2Signalbackground Noisebackground
Regular and irregular regions of interest measuring be-tween 0.5 mm2and 25 mm2outlining the area of contrast
enhancement were drawn to measure mean signal inten-sity. The identical region of interest was used for T1-weighted images with and without magnetization transfer and for precontrast and postcontrast images. Lesions were divided into enhancing and nonenhancing groups. Their signal intensities were measured on precontrast and post-contrast T1-weighted and T1-weighted magnetization transfer images. Contrast enhancement was measured as an increase in signal intensity on contrast-enhanced im-ages over the precontrast imim-ages for both T1-weighted and T1-weighted magnetization transfer sequences. Non-enhancing lesions were those having a high signal abnor-mality on proton-density and T2-weighted sequences but no increase in signal intensity on contrast-enhanced im-ages over the precontrast imim-ages on both T1-weighted and T1-weighted magnetization transfer sequences. Adja-cent normal white matter was used as background to cal-culate the above two ratios. The signal intensity of the caudate nucleus also was measured to compare it with the signal intensity of the contrast-enhancing lesions. (Of all the normal gray matter structures in the brain, the caudate nucleus had the highest signal intensity.) Noise back-ground was measured as the signal intensity of air (in a region not contaminated by the phase-encode artifact) and divided by the square root of pi (16). Tests for statis-tical significance (two-tailedttest) were applied.
Results
Enhancing Lesions
The average contrast-to-noise ratio of all the contrast-enhancing lesions (Figs 1 and 2) on postcontrast T1-weighted magnetization trans-fer images was 32 62 (mean6standard error of the mean), significantly greater than on the conventional postcontrast T1-weighted images with a average contrast-to-noise ratio of 2162 (P,.001). The average contrast-to-noise ratio of the enhancing lesions on the precontrast im-ages was 16 6 1 and 4 6 1 for T1-weighted magnetization transfer and T1-weighted se-quences, respectively (P , .001) (Table). The
addition of magnetization transfer therefore in-creased contrast-to-noise ratio on both precon-trast and postconprecon-trast images. There was an overall decrease in the mean signal intensity of the enhancing lesions of approximately 12% to 16% on magnetization transfer images com-pared with the conventional T1-weighted im-ages. The increase in the contrast-to-noise ratio was primarily attributable to a large decrease of 34% 62% in signal intensity of the background (white matter) on magnetization transfer im-ages. Fifty of the 59 contrast-enhancing lesions were seen on both the weighted and T1-weighted magnetization transfer images. How-ever, in 9 lesions contrast enhancement was visible only on postcontrast T1-weighted mag-netization transfer images, not on T1-weighted images.
Nonenhancing Lesions
For nonenhancing lesions (Figs 1 and 2), the contrast-to-noise ratios were not significantly different on precontrast and postcontrast im-ages for both the T1-weighted and T1-weighted magnetization transfer sequences. The con-trast-to-noise ratio was significantly higher (P,
.0001) for nonenhancing lesions on the T1-weighted magnetization transfer than on the conventional T1-weighted images. The magne-tization transfer effect without gadopentetate dimeglumine was significant. The nonenhanc-ing lesions did not differ from the enhancnonenhanc-ing lesions in contrast-to-noise ratio on either the conventional or T1-weighted magnetization transfer precontrast images (Table).
High Signal Lesions
Discussion
An important pathologic feature of an active MS plaque is the presence of perivenous inflam-matory changes associated with local blood-brain barrier breakdown. Previous studies have used gadopentetate dimeglumine as evidence of the disruption of normal blood-brain barrier
[image:4.612.55.558.100.591.2]and hence active lesions (1, 2, 17, 18). These lesions may or may not be clinically symptom-atic. The observation of perivenous inflamma-tion in chronic reactivated lesions of MS sug-gests that vascular events and demyelination may occur independently. Studies also indicate that demyelination does not always follow the
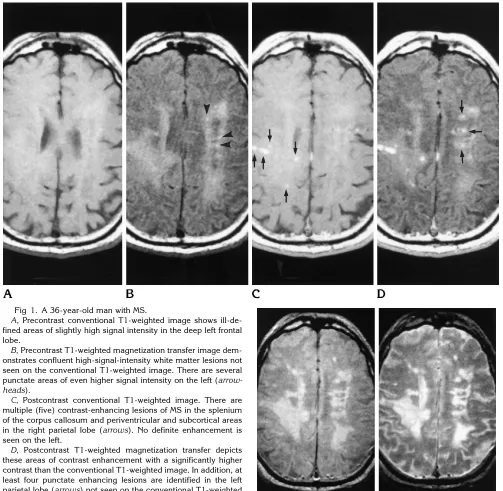
Fig 1. A 36-year-old man with MS.
A, Precontrast conventional T1-weighted image shows ill-de-fined areas of slightly high signal intensity in the deep left frontal lobe.
B, Precontrast T1-weighted magnetization transfer image dem-onstrates confluent high-signal-intensity white matter lesions not seen on the conventional T1-weighted image. There are several punctate areas of even higher signal intensity on the left (arrow-heads).
C, Postcontrast conventional T1-weighted image. There are multiple (five) contrast-enhancing lesions of MS in the splenium of the corpus callosum and periventricular and subcortical areas in the right parietal lobe (arrows). No definite enhancement is seen on the left.
D, Postcontrast T1-weighted magnetization transfer depicts these areas of contrast enhancement with a significantly higher contrast than the conventional T1-weighted image. In addition, at least four punctate enhancing lesions are identified in the left parietal lobe (arrows) not seen on the conventional T1-weighted image.
E, Axial proton density–weighted andF, axial T2-weighted
breakdown of the blood-brain barrier (19, 20). The temporal sequence of the inflammatory processes and demyelination still is a topic of considerable interest. Nevertheless, the pres-ence of contrast enhancement in an MS plaque is currently taken as a sign of disease activity, and therefore its detection is important in as-sessing acute disease burden. If contrast en-hancement is to be used as a measure of acute inflammatory change and thus of potentially
[image:5.612.57.555.98.596.2]re-versible disease, then an accurate measure of it will be necessary to assess treatment protocols. The use of gadopentetate dimeglumine in com-bination with magnetization transfer on T1-weighted images increases the contrast-to-noise ratios of enhancing lesions, improving their detectability and providing a more accu-rate measure of inflammatory disease burden. Magnetization transfer saturation can be achieved by using either an on-resonance or an
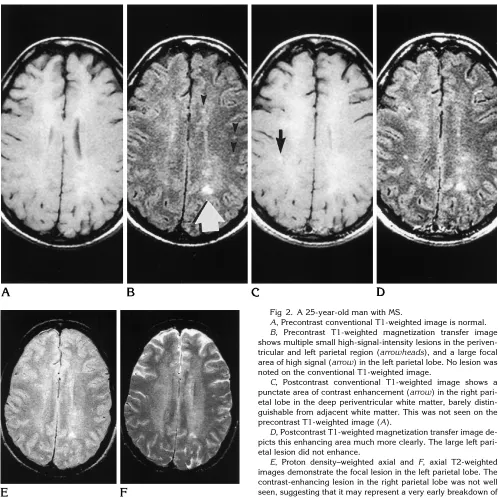
Fig 2. A 25-year-old man with MS.
A, Precontrast conventional T1-weighted image is normal. B, Precontrast T1-weighted magnetization transfer image shows multiple small high-signal-intensity lesions in the periven-tricular and left parietal region (arrowheads), and a large focal area of high signal (arrow) in the left parietal lobe. No lesion was noted on the conventional T1-weighted image.
C, Postcontrast conventional T1-weighted image shows a punctate area of contrast enhancement (arrow) in the right pari-etal lobe in the deep periventricular white matter, barely distin-guishable from adjacent white matter. This was not seen on the precontrast T1-weighted image (A).
D, Postcontrast T1-weighted magnetization transfer image de-picts this enhancing area much more clearly. The large left pari-etal lesion did not enhance.
off-resonance pulse. The main advantages of the on-resonance saturation pulse is that it is shorter, and therefore more sections can be ob-tained within a given time. Also, it is insensitive to B0 inhomogeneities, and the power deposi-tion is less (15).
The aim of our study was twofold: (a) to de-termine whether contrast-to-noise ratio mea-sure of lesion detection was improved by the combined use of gadopentetate dimeglumine and magnetization transfer; and (b) to compare signal intensities of enhancing and nonenhanc-ing lesions on precontrast T1-weighted magne-tization transfer images. The results show that contrast-enhancing MS lesions had a signifi-cantly higher contrast-to-noise ratio on post-contrast T1-weighted magnetization transfer images than on conventional T1-weighted im-ages. In addition, magnetization transfer alone, as seen on the precontrast T1-weighted magne-tization transfer images, increases the contrast measures of MS plaques and also shows lesions not seen on the conventional T1-weighted im-age. Lesion visibility was similar to that on the T2-weighted images. Thus the magnetization transfer technique itself contributes to the in-creased contrast of MS plaques in addition to the gadopentetate dimeglumine itself; this dif-fers from the results with contrast-to-noise ratio tumors, infections, and infarctions (21). By def-inition, the nonenhancing lesions of MS did not have a measurable or visible increase in con-trast-to-noise ratio after gadopentetate dime-glumine administration. The signal intensity of nonenhancing lesions often was greater than the intensity of the caudate nucleus, our internal standard to detect contrast enhancement (21). Therefore, no normal brain structure could be consistently used as an internal standard to de-termine contrast enhancement of MS lesions. The clinical importance of this finding is that in MS patients, precontrast T1-weighted magneti-zation transfer images need to be made to de-tect abnormal areas of contrast enhancement on T1-weighted magnetization transfer images. The MS lesions in this study did not include
end-stage, cystic plaques with very low signal on T1-weighted images. They are not difficult to detect, and the use of magnetization transfer might actually decrease the contrast-to-noise ratio of these lesions, although they still would be easily detected. Magnetization transfer adds information about subtle, nearly isointense le-sions on T1-weighted images and contrast en-hancement in plaques.
One interesting imaging finding in this study was the presence of high-signal-intensity le-sions on the precontrast T1-weighted magneti-zation transfer images (Fig 2). This high signal throughout the lesion was not apparent on the conventional T1-weighted image and often was of the same magnitude as contrast enhance-ment but was seen on the precontrast T1-weighted magnetization transfer images. A pe-ripheral rim of hyperintensity on T1-weighted images has been described by Nesbit et al (22). In their study, all four lesions with peripheral rims of hyperintensity showed marked to mod-erate infiltration with lipid-laden macrophages. Other theories include the presence of free rad-icals (23). The hyperintensity on T1-weighted magnetization transfer images in our study was present throughout the plaque, not a rim of hy-perintensity. This high signal is felt to represent lipid signal. This may be the imaging correlate of the spatially localized proton spectroscopy– identifiable lipid. These areas may represent ac-tive demyelination and possible reversible brain damage. Their assessment would be important in assessing treatment protocols and the natural course of MS.
To understand the possible source of this in-creased signal, a brief review of the structure of the myelin and the effect of magnetization transfer saturation on different chemical states is useful. White matter is composed of myelin sheaths, microglial cells, axons, and capillaries (24). The structure of myelin is represented by a fluid mosaic, which consists of a lipid bilayer with embedded macromolecular proteins (25). The major lipids in myelin are cholesterol and glycerophospholipids. They do not result in a
Contrast-to-noise ratio of MS lesions without and with magnetization transfer
T1-Weighted
Precontrast T1-Weighted Postcontrast
T1-Weighted Magnetization Transfer Precontrast
T1-Weighted Magnetization Transfer Postcontrast
Nonenhancing 0.661.6 0.362.0 14.062.0 15.061.0
high signal lipid peak on MR images or spec-troscopy in intact myelin. In MS, the most spe-cific and characteristic change is demyelina-tion. With myelin breakdown, there is a moderate increase in the concentration of free lipids and lysosomal enzymes in the macromo-lecular environment of these lesions (26). Fat (lipid) signal is poorly suppressed by magneti-zation transfer, as has been noted in several studies in which calculated magnetization trans-fer ratios were fewer than 5% (9). These hydro-phobic lipids, containing medium- and long-chain triglycerides, have T2 values similar to many other biological tissues and do not have any significant direct interaction with free water; therefore they are not considered macromole-cules similar to those saturated by the magne-tization transfer pulse. The degradation of the myelin in the demyelinating diseases would re-sult in increased concentration of lipids, which would be unaffected by the magnetization trans-fer saturation (27–30). Thus they would appear of higher signal intensity than the suppressed signal of white matter on magnetization transfer images.
Lipid as the cause of this high signal is further supported by the results of MR spectroscopy. MR proton spectroscopy performed in 14 pa-tients with clinically definite MS has shown prominent resonances in the 0.5 to 2.0 ppm region, which were presumed to originate from lipids and other breakdown products of myelin. These findings also were detected in nonen-hancing plaques (7 of 21) (31). In spectro-scopic studies, there has been no magnetization transfer between H(r) and fat; therefore, the lip-ids would not be expected to lose signal with magnetization transfer (32). It is therefore rea-sonable to conclude that the increased signal seen on the precontrast T1-weighted magneti-zation transfer images in enhancing and nonen-hancing plaques may represent lipid-break-down products of myelin and is the imaging equivalent of the lipid signal seen with MR spec-troscopy.
This imaging finding does pose an interesting question with regard to the definition of disease activity. The presence of lipid suggests active demyelination, which apparently can occur in the absence of contrast enhancement, a pre-sumed marker for active inflammation. There-fore, contrast enhancement may be an incom-plete indicator of disease activity if that concept
is to encompass active tissue damage caused by demyelination.
References
1. Grossman RI, Gonzalez-Scarano F, Atlas SW, Galetta S, Silber-berg DH. Multiple sclerosis: gadolinium enhancement in MR im-aging.Radiology1986;161:721–725
2. Gonzalez-Scarano F, Grossman RI, Galetta S, Atlas SW, Silber-berg DH. Multiple sclerosis disease activity correlates with gado-linium-enhanced MRI.Ann Neurol1987;21:300 –306
3. Sappey-Marinier D. High resolution NMR spectroscopy of cerebral white matter in multiple sclerosis.Magn Reson Med1990;15:229 – 239
4. Larsson HBW, Frederiksen J, Kjaer L, Henriksen O, Olesen J. In-vivo determination of T1 and T2 in the brain of patients with severe but stable multiple sclerosis.Magn Reson Med1988;7: 43–55
5. Larsson HBW, Frederiksen J, Petersen J, et al. Assessment of demyelination, edema, and gliosis by in-vivo determination of T1 and T2 in the brain of patients with acute attack of multiple sclerosis.Magn Reson Med1989;11:337–348
6. Wolff SD, Balaban RS. Magnetization transfer contrast (MTC) and tissue water proton relaxation in vivo.Magn Res Med 1989;10: 135–144
7. Elster AD, King JC, Mathews VP, Hamilton CA. Cranial tissues: appearance at gadolinium-enhanced and nonenhanced MR imag-ing with magnetization transfer contrast. Radiology 1994;190: 541–546
8. Finelli DA, Hurst GC, Gullapali RP, Bellon CM. Improved contrast of enhancing brain lesions on post-gadolinium T1-weighted spin-echo images with use of magnetization transfer.Radiology1994; 190:553–559
9. Mathews VP, King JC, Elster AD, Hamilton CA. Cerebral Infarc-tions: effects of dose and magnetization transfer contrast at gado-linium enhanced MR imaging.Radiology1994;190:547–552 10. Boorstein JM, Wong KT, Grossman RI, Bollinger L, McGowam JC.
Metastatic lesions of the brain: imaging with magnetization trans-fer.Radiology1994;191:799 – 803
11. Poser CM, Paty DW, Scheinberg L, et al. New diagnostic criteria for multiple sclerosis: guidelines for research protocols.Ann Neu-rol1983;13:227–231
12. Lindsey JW, Hodgkinson S, Mehta RC, et al. Phase I clinical trail of chimeric monoclonal anti CD4 antibody in multiple sclerosis. Neurology1994;44:413– 419
13. Lindsey JW, Hodgkinson S, Mehta RC, Mitchell D, Enzmann DR, Steinmann L. Repeated treatment with chimeric anti CD4 anti-body in multiple sclerosis.Ann Neurol1994;36:183–189 14. Hu BS, Conolly SM, Wright GA, Nishimura DG, Macovski A.
Pulsed saturation transfer contrast.Magn Reson Med 1992;26: 231–240
15. Pike GB, Glover GH, Hu BS, Enzmann DR. Pulsed magnetization transfer spin-echo imaging.J Magn Reson Imag1993;3:531–539 16. Bracewell R.The Fourier Transform and its Application. Vol 5.
New York, NY: McGraw-Hill; 1965:5– 67
17. Dousset V, Grossman RJ, Ramer KN, Schnall MD, Young LH, Gonzalez-Scarano F, et al. Experimental allergic encephalomy-elitis and multiple sclerosis: lesion characterization with magne-tization transfer imaging.Radiology1992;182:483– 491 18. Kuharik MA, Edwards MK, Farlow MR, Becker GJ, Azzarelli B,
19. Calder V, Owen S, Watson C, Feldmann M, Davison A. MS: a localized immune disease of the central nervous system.Immunol Today1989;10:99 –103
20. Grossman RI, Braffman BH, Brorson JR, Goldberg HI, Silberberg DH, Gonzalez-Scarano F. Multiple sclerosis: serial study of gado-linium-enhanced MR imaging.Radiology1988;169:117–122 21. Mehta RC, Pike GB, Haros SP, Enzmann DE. Central nervous
system tumor, infection and infarction: detection with gadolinium-enhanced magnetization transfer MR imaging.Radiology1995; 195:41– 46
22. Nesbit GM, Forbes GS, Scheithauer BW, Okazaki H, Rodriguez M. Multiple sclerosis: histologic and MR and/or CT correlation in 37 cases at biopsy and three cases at autopsy.Radiology1991;180: 467– 474
23. Powell T, Sussma JG, Davies-Jones GAB. MR imaging in acute multiple sclerosis: ringlike appearance in plaques suggesting the presence of paramagnetic free radicals.AJNR Am J Neuroradiol 1992;13:1544 –1546
24. Raine CS. Demyelinating diseases In: Davis RL, Robertson DM, eds. Textbook of Neuropathology. 2nd ed. Baltimore, Md: Williams and Wilkins; 1991:535–560
25. Morell P, Quarles RH, Norton WT. Formation, structure and bio-chemistry of myelin. In: Siegel G, Agranoff B, Albers RW, Mollinoff P, eds. Basic Neurochemistry. 4th ed. New York, NY: Raven; 1989:109 –136
26. Paty DW. Magnetic resonance imaging in demyelination. In: Kim SU, ed.Myelination and Demyelination: Implications for Multiple Sclerosis.New York, NY: Plenum; 1987:259 –272
27. Wolff SD, Eng J, Balaban RS. MTC: method of improving contrast in gradient recalled echo images.Radiology1991;179:133–137 28. Eng J, Ceckler TL, Balaban RS. Quantitative 1H magnetization
transfer in-vivo.J Magn Reson1991;17:304
29. Kurki TJI, Neimi PT, Lundbom N. Gadolinium enhanced magne-tization transfer contrast in intracranial tumors. J Magn Reson Imaging1992;2:401– 406
30. Tanttu R, Sepponen E, Lipton MJ, Kuusela T. Synergistic en-hancement of MRI with Gd-DTPA and magnetization transfer.J Comput Assist Tomogr1992;16:19 –24
31. Narayana PA, Wolinsky JS, Jackson EF, McCarthy M. Proton MR spectroscopy of gadolinium-enhanced multiple sclerosis plaques. J Magn Reson Imaging1992;2:263–270