Sex and Electroencephalographic
Synchronization after Photic Stimulation Predict
Signal Changes in the Visual Cortex on
Functional MR Images
Peter Hedera, Dee Wu, Steve Collins, Jonathan S. Lewin, David Miller, Alan J. Lerner, Susan Klein, and Robert P. Friedland
PURPOSE:We evaluated factors that influence MR signal changes during photic stimulation of the visual cortex. We also tested the hypothesis that functional MR imaging response corresponds to electroencephalographic (EEG) synchronization after photic stimulation.
METHODS: Thirty-eight healthy subjects, 20 men and 18 women, underwent photic stimu-lation of the visual cortex. They were studied with a 1.5-T MR unit, and photic stimustimu-lation was induced via 8-Hz LED goggles. Seven subjects with and seven without detectable functional MR imaging response to photic stimulation underwent further studies with 16-channel EEG after 2-to 30-Hz stroboscopic stimulation.
RESULTS:Thirteen men and 18 women had a significant increase in MR signal in the visual cortex; seven men showed no visual cortex activation during more than two repeated studies. Six of seven volunteers with increased functional MR imaging signal after photic stimulation also showed signs of EEG synchronization when an 8-Hz stroboscopic flash was used; six of seven subjects with no functional MR imaging lacked EEG synchronization at 8-Hz stimulation.
CONCLUSIONS:Men were more likely than women to have undetectable MR signal changes after photic stimulation. This finding should be considered when interpreting results of functional MR imaging studies. EEG with stroboscopic examination is a good predictor of functional MR imaging sensitivity to changes in regional cerebral blood flow induced by sensory stimulation.
Functional magnetic resonance (MR) imaging with its ability to show activated brain regions noninva-sively has become widely accepted as an effective tool in neuroimaging. Photic stimulation causes marked increase of MR signal in the occipital cortex, an area of the brain that has been studied extensively with functional MR imaging (1–8). Our group has also focused on the study of visual cortex activation using 1.5-T gradient-echo MR imaging (6, 9), and we have noticed that MR signal changes cannot be
detected in every healthy volunteer studied after photic stimulation.
Stroboscopic light has been widely used as an activa-tion method during electroencephalographic (EEG) tracing (10). Although both EEG and regional cere-bral blood flow (rCBF) have been linked to neuronal activity, their relationship remains uncertain; how-ever, changes in the brain’s metabolic activity have shown close correlation with changes in electrophys-iological activity (11).
Functional MR imaging has significant potential for routine clinical use, and an understanding of MR signal variability under physiological conditions has become increasingly important. The goal of this study was to evaluate factors that influence MR signal changes during photic stimulation of the visual cortex. We also tested the hypothesis that functional MR imaging response corresponds to EEG synchroniza-tion after photic stimulasynchroniza-tion.
Methods
Thirty-eight healthy subjects who gave informed consent were included in the study. The group consisted of 20 men and Received May 9, 1997; accepted after revision October 6.
Supported in part by National Institutes of Health grant AG 08012–05 and Philip Morris USA.
From the Departments of Neurology (Laboratory of Neurogeri-atrics) (P.H., A.J.L., R.P.F.), Radiology (D.W., J.S.L., D.M.), Neu-rology (S.C.), and Psychology (S.K.) Case Western Reserve Uni-versity/University Hospitals of Cleveland (Ohio); and the Department of Medicine, Division of Neurology, St Luke’s Medical Center, Cleveland (A.J.L.).
Address reprint requests to Robert P. Friedland, MD, Depart-ment of Neurology, Case Western Reserve University, 11100 Eu-clid Ave, Cleveland, OH 44106. E-mail: [email protected]
©American Society of Neuroradiology
18 women with an average age of 2666 years (range, 19 to 38 years; average age of men, 2765 years; average age of women, 2564 years). The subjects were studied at 1.5 T with a 5-inch circular surface coil. Anatomic images of the occipital cortex were collected in a sagittal plane using a T1-weighted three-dimensional radio frequency spoiled fast low-angle shot (FLASH) sequence with TR/TE of 17/6, a flip angle of 20°, a field of view of 256 mm, a matrix size of 192 3256, and 64 partitions, leading to contiguous 2-mm-thick sections. Func-tional MR images were obtained with a susceptibility-sensitized two-dimensional FLASH sequence. The sequence included first-order flow compensation in section-select and readout directions, a low bandwidth of 98 Hz per pixel to increase the signal-to-noise ratio, TR/TE of 67/40, a flip angle of 25°, a field of view of 256 mm, and a matrix size of 1283128 (12).
Every subject underwent binocular photic stimulation of the primary visual cortex with LED goggles (Grass Instruments, Quincy, Mass); the stimulus was a flashlight at a frequency of 8 Hz (13). The plane of the calcarine fissure was covered by a 4-mm section. Before photic stimulation we collected five rest-ing images in complete darkness with the subjects’ eyes closed. The subjects were then exposed to a stroboscopic light for 49 seconds, during which five functional images were collected. Preliminary assessment of visual cortex activation was made by subtracting the activated images from the resting images. When signal changes were detected on the subtracted images, the same cycle was repeated. If activation was reproduced, the subjects were included in studies of visual (6, 9, 14) or motor (12, 15) cortex activation and of cerebrovascular reactivity (16). All subjects with positive signal increases were involved in at least one more study protocol that entailed photic stimulation of the visual cortex.
Subjects who showed no signs of signal changes at the level of the calcarine fissure after the first photic stimulation and in whom the subtraction images revealed no significant move-ment were studied further. The whole occipital cortex was screened with 4-mm sections parallel to the calcarine fissure and the position was shifted 2 mm between each study. When this did not yield signal changes, the section angle was modified by 5°; the whole cycle was repeated until we detected MR signal induced by photic stimulation or until the whole occipital cor-tex was covered from 180° to 90°. The possibility of gross head movement was evaluated by judging the degree of overlap of the subtracted images. The mean pixel intensity of activated images was subtracted from the mean pixel intensity of preac-tivated images. Movement artifacts were evidenced by in-creased or dein-creased signal creating complete or partial rings along the margins of the brain, ventricles, or skull (17). When gross head movement was detected, we repeated the scout scan of the occipital lobe in the parallel orientation and the whole protocol was restarted. Subjects without detectable response to photic stimulation were restudied in at least two more sessions, each at least 1 week apart. For three nonresponders, we made three more unsuccessful attempts to detect activation of the visual cortex. We decided to reduce the number of repeat studies to two in the rest of the nonresponders because of the consistent findings in first three volunteers. The protocol for identifying MR signal was unchanged.
All seven subjects without inducible MR signal increase and seven randomly chosen age-matched subjects with inducible MR signal increases underwent routine 16-channel EEG ex-amination. This also included photic stimulation with strobo-scopic light stimulation at 2, 5, 8, 10, 12, 15, and 20 Hz during longitudinal bipolar montage tracing; photic stimulation lasted 10 seconds, with a resting interval between frequencies of 20 seconds. Part of the photic stimulation was performed with LED goggles at a frequency of 8 Hz. EEG and MR imaging were performed within a 1-week period.
EEG recordings were interpreted by one of the investiga-tors, who was blinded to the results of the functional MR imaging studies. A driving response was present when a
time-locked synchronous activity over parietooccipital regions was detected; we also required that EEG frequency be either equal to or harmonic with flash frequency.
Fox and Raichle (13) reported maximum change of rCBF with 8-Hz photic stimulation; the second peak was seen with a 15-Hz stimulus. Three subjects from each group (nonre-sponders and re(nonre-sponders) were also stimulated with flashing light at the frequency of 15 Hz to determine whether a change in frequency influences detectability of MR response. These subjects were selected because they had synchronous EEG activity during photic stimulation with a 15-Hz stroboscopic light.
MR images were processed using a SunSparc station 2 (Sun Microsystems, Mountain View, Calif). Accepted images with-out gross head movements (see above) were corrected by a motion registration algorithm for possible rotational and trans-lational motion within the imaging plane (17). A region of interest including the visual cortex and excluding the cerebral venous sinuses was drawn for each subject. Student’sttest was applied on a pixel-by-pixel basis on the original activated im-ages. The standard deviation used for thettest was determined from variation of the baseline signal. Pixels with signal changes at the level of significance (a5.01 and higher) were consid-ered activated by photic stimulation. Moreover, a minimum of seven contiguous pixels was required for confirmation of the visual cortex activation (18).
Activation of the visual cortex was first dichotomized as absent or present and in this way subjects were considered to be responders or nonresponders. The average percentage value of signal changes from the baseline was calculated from all acti-vated pixels in responders; pixels corresponding to cerebral venous sinuses were excluded. Both groups were compared using Fisher’s Exact Test and Student’s ttest. Subjects with EEG studies were also divided into two subgroups: those with and those without a driving response at different flashing fre-quencies. We also analyzed the relationship between EEG synchronization and MR activation by Fisher’s Exact Test.
Results
Photic stimulation induced a significant MR signal increase in 31 of 38 subjects (13/20 men and 18/18 women; average age, 2866 years) (Fig 1). Of the 31
FIG 1. Overlay of activated areas of the visual cortex on
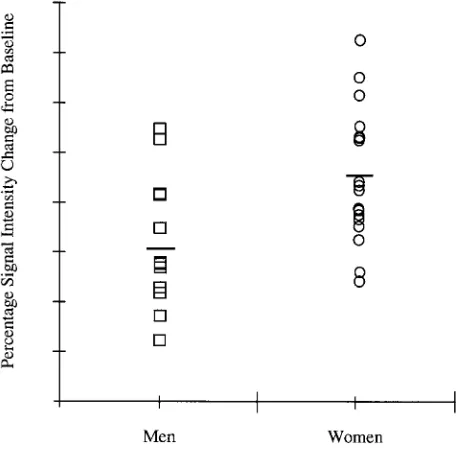
responders, 20 underwent two more studies with vi-sual cortex stimulation and 11 had three more studies; successful activation was detected during all repeated sessions. Visual cortex activation was absent in seven volunteers. Lack of activation remained consistent, as at least two repeated attempts failed to yield signal changes that met the criteria for a statistically signif-icant response. Four subjects had a total of three studies and three underwent four unsuccessful at-tempts to detect activation of the visual cortex. Thus, every subject had a consistent (absent or present) response to repeated visual stimulation with the same protocol. All nonresponders were men (average age, 2963 years); all female volunteers displayed an MR signal increase. Both subgroups differed significantly in their gender composition (P # .01). The average percentage of signal change was 3.1161.35% in the group of male volunteers (we did not include seven nonresponders in this statistical analysis) and 4.646 1.86% in female subjects (P#.01) (Fig 2).
All seven nonresponders together with seven ran-domly chosen responders (three men and four wom-en; average age, 28 6 3 years) underwent EEG ex-amination with photic stimulation. The Table summarizes the EEG findings. All subjects had a normal wakeful EEG with posterior alpha rhythm; no focal slowing or epileptiform activity was detected. A driving response was detected at least at one fre-quency of stroboscopic light in every subject. There was no statistically significant difference in the aver-age number of frequency ranges that induced a driv-ing response between the two groups (2.4361.72 in the nonresponders and 3.43 6 1.40 in the respond-ers). Six volunteers with detectable visual cortex acti-vation with an 8-Hz flashing light also had signs of synchronization of the posterior rhythm at the same frequency of the stroboscopic flash; only one subject
from the subgroup of nonresponders had a driving response at 8-Hz photic stimulation (P# .05).
Most commonly, we detected a driving response during EEG recording with 12- and 15-Hz strobo-scopic light stimulation. Both of these frequencies induced a driving response in 11 of 14 volunteers (five nonresponders and six responders for each fre-quency) (see Table). Three subjects from each sub-group also underwent one functional MR imaging study with 15-Hz photic stimulation; they were chosen after they had signs of EEG synchronization at 15 Hz. None of the nonresponders at 8 Hz had a detectable MR signal change after stimulation at 15 Hz. Stimu-lation at higher frequencies confirmed a consistency in reproducibility of visual cortex activation in the group of responders. Moreover, all three subjects had a similar trend in signal intensity changes after stim-ulation at both frequencies: the 15-Hz stroboscopic light always induced a lower response as compared with the 8-Hz light (3.5660.71%, 6.1961.22%, and 4.4362.10% at 8-Hz stimulation, and 1.8161.13%, 3.87 62.31%, and 2.896 1.67% at 15 Hz).
Discussion
The consistent absence of detectable MR signal in 35% of male subjects in contrast to 0% in the female subjects is one of the principal findings of this study. Studies with positron emission tomography (PET) have shown that exposure to bright light causes in-creased rCBF in all subjects with normal vision (19, 20). Moreover, photic stimulation appears to be in-dependent of the subject’s motivational state. We detected signal changes even in subjects who had their eyes closed during photic stimulation (P. Hedera et al, unpublished observation, 1993). Furthermore, unmotivated subjects tend to produce significant head movements. We closely inspected the degree of overlap between baseline and stimulation images af-ter subtraction, discarding all studies with a ring of
[image:3.587.304.533.95.286.2]FIG 2. Percentage of signal change in the primary visual cortex in all studied subjects.Horizontal lineindicates average signal change (3.11% in the group of men and 4.64% in the women).
TABLE 1: Frequencies of Intermittent Light Stimulation that In-duced Electroencephalographic Synchronization in Occipitoparietal Areas
Subject Sex/Age,y ResponseMR Rhythm, HzAlpha Response, HzDriving
1 M/31 No 10 12, 15 2 M/29 No 10 12, 15, 20 3 M/30 No 10 12 4 M/24 No 9 2, 5, 8, 10,
15, 20 5 M/26 No 11 10, 15 6 M/27 No 11 12 7 M/33 No 10 12, 15 8 M/27 Yes 11 8, 10, 12, 15 9 M/29 Yes 10 8, 12, 15 10 M/30 Yes 12 8, 10, 12 11 F/33 Yes 11 8, 10, 15 12 F/27 Yes 11 12, 15 13 F/23 Yes 10 2, 5, 8, 12,
[image:3.587.56.284.486.711.2]signal changes at tissue boundaries, which were indic-ative of significant head movement (17). Therefore, it is unlikely that the absence of signal in the male volunteers was simply the result of technical artifacts due to head movements or poor motivation. More likely, the lack of signal increase after photic stimu-lation was caused by small rCBF increases that were below the detectability threshold of the 1.5-T field strength of functional MR imaging. The average per-centage of signal increase to photic stimulation was also higher in women. Although women generally have higher values of resting rCBF, including occipi-tal rCBF (21–23), functional MR imaging is relatively independent of the absolute values of rCBF. Func-tional MR imaging can mainly assess the difference in fractional blood oxygenation, which reflects the rela-tive increase of deoxyhemoglobin, between acrela-tive and resting states (1, 2). Even though gender differences are least prominent after activation of the primary cortices (21, 22), our results suggest that women may have slightly higher increases of occipital rCBF dur-ing processdur-ing of simple visual stimuli.
One study compared functional MR imaging re-sponse to photic stimulation in similar groups of eight men and women and found higher signal changes in male subjects (24). Average activation in men was 5.061.4% (average for our group of male volunteers was 3.1161.35%); average activation in women was 3.16 1.4% (average for our group of female volun-teers was 4.64 6 1.86%). Levin and coworkers used the same mode of photic stimulation; however, in contrast to our method, they used echo-planar imag-ing at a field strength of 1.5 T. The reason for the differences in results between that study and ours is unclear, although differences in imaging techniques may be partially responsible. Further studies are needed to confirm gender differences in activation of the primary visual cortex. Nevertheless, the existence of different thresholds in detectability of MR signal between men and women must be taken into consid-eration in any clinical interpretation of studies ob-tained with 1.5-T gradient-echo functional MR imaging. The other principal finding of this study is the association between EEG synchronization of back-ground activity with an 8-Hz flashing light and detect-ability of MR signal changes induced by the same frequency of stimulation. Although any relationship between scalp EEG (ie, a summation of excitatory and inhibitory postsynaptic potentials) and rCBF re-mains speculative, both parameters reflect brain me-tabolism, and several studies have reported a connec-tion between them (25). Hyperventilaconnec-tion resulting in hypocapnia is known to cause generalized EEG slow-ing in healthy subjects, and lower values of rCBF have been demonstrated during decreased arterial carbon dioxide tension (26–28), suggesting that slowing of EEG frequencies may be a result of reduced rCBF. Coupling of EEG and rCBF has also been demon-strated in focal epilepsy during ictal and interictal periods (29–31), and changes of occipital rCBF pos-itively correlate with occipitoparietal synchronization on EEG recordings (32). Our results showing a
pos-itive correlation between EEG synchronization and detectability of signal changes on functional MR im-ages after photic stimulation at 8 Hz suggest that an increase of rCBF in the visual cortex is lower when the same frequency of stroboscopic light does not induce occipitoparietal synchronization on EEGs. However, studies of three nonresponders who had signs of a driving response on EEG with 15-Hz photic stimulation did not yield a positive MR signal after the same frequency was used for visual cortex activa-tion. Fox and Raichle (13) have shown that changes of occipital rCBF varied with the stimulation fre-quency and that the maximum change was observed at 7.8 Hz, with the second highest increase present at 15 Hz of intermittent light stimulation. We also found a tendency toward lower MR signal increase with 15-Hz stimulation as compared with 8-Hz stimulation in our responders, consistent with previous studies using PET (13) and functional MR imaging (2). The absence of detectable MR signal in men with EEG synchronization at 15 Hz may be due to an insuffi-cient increase of rCBF, which is below the detection threshold of the 1.5-T magnetic field. Use of a stron-ger magnetic field will be necessary to confirm whether stimulation with 15 Hz induces greater signal changes when it coincides with EEG synchronization.
Conclusion
Our results, despite two limitations (ie, qualitative estimation of rCBF changes only and inability to obtain EEG recordings during the MR study), sug-gest that intermittent light stimulation causes a greater increase of rCBF in the visual cortex when it is associated with occipitoparietal EEG synchroniza-tion. EEG with stroboscopic examination is a good predictor of functional MR imaging sensitivity to rCBF changes induced by sensory stimulation. We also found that detectability of MR response in men was significantly lower than that in women. The pos-sibility of a higher threshold for detection of brain activation in men must be taken into account when interpreting functional MR images obtained at a field strength of 1.5 T.
References
1. Ogawa S, Tank DW, Menon R, et al.Intrinsic signal changes accompanying sensory stimulation: functional brain mapping with magnetic resonance imaging.Proc Natl Acad Sci U S A1992;89: 5951–5955
2. Kwong KK, Belliveau JW, Chestler DA, et al.Dynamic magnetic resonance imaging of human brain activity during primary sensory stimulation.Proc Natl Acad Sci U S A1992;89:5675–5679 3. Frahm J, Bruhn H, Merboldt K-D, Ha¨nicke W. Dynamic MR
imaging of human brain oxygenation during rest and photic stim-ulation.J Magn Reson Imaging1992;2:501–505
4. Schneider W, Noll DC, Cohen JD.Functional topographic map-ping of the cortical ribbon in human vision with conventional scanners.Nature1993;365:150–153
5. Le Bihan D, Turner R, Zeffiro TA, Cuenod CA, Jezzard P, Bon-nerot V.Activation of human primary visual cortex during visual recall: a magnetic resonance imaging study.Proc Natl Acad Sci U S A1993;90:11802–11805
sensitized magnetic resonance imaging. Neurology1994;44:1992– 1926
7. Sereno MI, Dale AM, Reppas JB, et al.Borders of multiple visual areas in humans revealed by functional magnetic resonance imag-ing.Science1995;268:889–893
8. Tootell RB, Reppas JB, Kwong KK, et al.Functional analysis of human MT and related visual cortical areas using magnetic reso-nance imaging.J Neurosci1995;15:3215–3230
9. Hedera P, Wu D, Lewin JS, Miller D, Lerner AJ, Friedland RP. Temporal patterns of uncoupling between oxidative metabolism and regional cerebral blood flow demonstrated by functional mag-netic resonance imaging.Invest Radiol1995;30:625–633 10. Coull BM, Pedley TA. Intermittent photic stimulation: clinical
usefulness of non-convulsive response. Electroencephalogr Clin Neurophysiol1978;44:353–363
11. Paulson OB, Sharrbough FW. Physiologic and pathophysiologic relationship between the electroencephalogram and the regional cerebral blood flow.Acta Neurol Scand1974;50:194–220 12. Lai S, Hopkins AL, Haacke EM, et al.Identification of vascular
structures as a major source of signal contrast in high resolution 2D and 3D functional activation imaging of the motor cortex at 1.5 T: preliminary results.Magn Reson Med1993;30:387–392 13. Fox PT, Raichle ME.Stimulus rate dependence of regional
cere-bral blood flow in human striate cortex, demonstrated by positron emission tomography.J Neurophysiol1984;51:1109– 1120 14. Hedera P, Lai S, Haacke EM, Hopkins AL Friedland RP,
Fried-man L.High-resolution GRE functional imaging of visual cortex. Presented at the annual meeting of the Radiological Society of North America, Chicago, Ill, September 1993
15. Haacke EM, Hopkins A, Lai S, et al.2D and 3D high resolution gradient echo functional imaging of the brain: venous contribu-tions to signal in motor cortex study.NMR Biomed1994;6:54–62 16. Hedera P, Lai S, Lewin JS, et al.Assessment of cerebral blood flow reserve using functional magnetic resonance imaging.J Magn Re-son Imaging1996;6:718–725
17. Lewin JS, Friedman L, Wu D, et al.Cortical localization of human sustained attention: detection with functional MR using a visual vigilance paradigm.J Comput Assist Tomogr1996;20:695–701 18. Wu D, Lewin JS.Nonparametric measures and data clustering for functional MR data.Presented at the annual meeting of the Society for Magnetic Resonance, San Francisco, Calif, August 1994 19. Fox PT, Mintun MA, Raichle ME, Miezin FM, Allman JM, Van
Essen DC.Mapping human visual cortex with positron emission
tomography.Nature1986;323:806–809
20. Fox PT, Miezin FM, Allman JM, Van Essen DC, Raichle ME. Retinotopic organization of human visual cortex mapped with positron emission tomography.J Neurosci1987;7:913–922 21. Gur RC, Gur RE, Obrist WD, Skolnick BE, Reivich M.Age and
regional cerebral blood flow at rest and during cognitive activity.
Arch Gen Psychiatry1987;44:617–621
22. Gur RC, Gur RE, Obrist WD, et al.Sex and handedness differ-ences in cerebral blood flow during rest and cognitive activity.
Science1982;217:659–661
23. Esposito G, Weinberger DR, Van Horn JD, Ostrem JL, Berman KF.Do women have more active brains than men? a PET study during cognitive activation.Presented at the annual meeting of the Society Neuroscience, Washington, DC, November 1993 24. Levin JM, Ross MH, Mendelson JH, Mello NK, Cohen BM,
Ren-shaw PF.Gender differences in BOLD response to photic stimu-lation.Presented at the annual meeting of the Society for Magnetic Resonance, Nice, France, August 1995
25. Paulson OB, Sharrbough FW. Physiologic and pathophysiologic relationship between the electroencephalogram and the regional cerebral blood flow.Acta Neurol Scand1974;50:194–220 26. Olesen J, Paulson OB, Lassen NA.Regional cerebral blood flow in
man determined by the initial slope of the clearance of intra-arterially injected133Xe.Stroke1971;2:519–540
27. Greenberg J, Alavi A, Reivich M, Kuhl D, Uzzell B.Local cerebral blood volume response to carbon dioxide in man.Circ Res1978; 43:324–331
28. Ellingsen I, Hauge A, Nicolaysen G, Thoresen M, Walloe I. Changes in human cerebral blood flow due to step changes in PAO2
and PACO2.Acta Physiol Scand1987;129:157–163
29. Hougaard K, Oikawa T, Sveinsdottir E, Skonhoj E, Ingvar DH, Lassen A.Regional cerebral blood flow in focal cortical epilepsy.
Arch Neurol1976;33:527–535
30. Sakai F, Meyer JS, Naritomi H, Hsu MC.Regional cerebral blood flow and EEG in patients with epilepsy.Arch Neurol1978;35:648– 657
31. Valmier J, Touchon J, Baldy-Moulinier M.Interictal regional ce-rebral blood flow during non specific activation test in partial epilepsy.J Neurol Neurosurg Psychiatry1989;52:364–371
32. Naquet R, Menini C, Cepada C. Mechanism of appearance of paroxysmal responses induced by intermittent light stimulation. In: Akimoto H, Kazamatsuri H, Seino M, Ward AA, eds.Advances in Epileptology (XIIIth Symposium)1982;249–254