David M. Yousem1 Scott W. Atlas Herbert I. Goldberg Robert I. Grossman
Received June 6, 1990; revision requested Au-gust 1 !'i, 1990; revision received September 6, 1990; accepted September 7. 1990.
1
All authors: Department of Radiology. Neuro-radiology Section, Hospital of the University of Pennsylvania, 3400 Spruce St., Philadelphia. PA 19104. Address reprint requests to D. M. Yousem. 0195-6108/91/1202-0229
© American Society of Neuroradiology
Degenerative Narrowing of the
Cervical Spine Neural Foramina:
Evaluation with High-Resolution 30FT
Gradient-Echo MR Imaging
Conventional two-dimensional Fourier transform (20FT) MR evaluation of osteophytic disease of the cervical neural foramina is limited by section thickness, signal-to-noise problems, and CSF flow artifacts. We evaluated the role of thin-section, high-resolution, gradient-refocused three-dimensional Fourier transform (30FT) MR imaging in assessing degenerative foramina! narrowing in the cervical spine. Contiguous 1.S-mm axial 30FT gradient-recalled acquisition in the steady state MR images of 120 neural foramina at 60 disk levels were evaluated blindly and independently by three neuroradiologists. High-resolution axial CT was used as the gold standard in all patients. 30FT MR was found to agree with CT in the detection of neural foramina! narrowing and in the determination of the cause of the narrowing in approximately 76% of neural foramina. The accuracy for the assessment of neural foramina! narrowing on 30FT MR ranged from 73% to 82% when a S0-flip-angle, high-intensity CSF technique was used. When using the 30°-flip-angle, low-intensity CSF technique, the accuracy ranged from 66% to 86%. When the cause of narrowing was evaluated, the
so
and 30° studies agreed with CT in 70-92% and 48-88% of the levels, respectively. When lesions were missed on MR, it was usually because of osteophytic disease. The interobserver concordance of MR and CT interpretations was higher for detecting the presence of narrowing than its cause.This MR technique is a useful method in the evaluation of foramina! stenosis since contrast between disk, cord, osteophyte, and CSF is high without the need for intrathecal injections. The wide range of interpreter accuracy and interobserver correlation is attributed to a steep learning curve for evaluating the MR images.
AJNR 12:229-236, March/April1991; AJR 1S6: June 1991
While MR imaging has become a well-accepted method for evaluating spinal cord disease, its use in the cervical spine has been limited by its decreased effectiveness in evaluating bony degenerative disease. In patients with cervical radiculopathy, neural foramina! narrowing may be caused by degenerative osteo-phytes or laterally herniated disks. Bony osteophytic disease has not been depicted clearly by conventional two-dimensional Fourier transform (20FT) MR techniques. The 20FT images have been limited by section thickness, signal-to-noise (S/N) problems with thin sections, as well as artifacts emanating from CSF flow [1-4].
We evaluated the ability of thin (1.5 mm)-section, high-resolution three-dimen-sional Fourier transform (30FT) MR imaging with gradient refocusing to assess foramina! disease of the cervical spine. Techniques resulting in high-intensity CSF (i.e., low flip angle) and low-intensity CSF (i.e., high flip angle) were compared by using high-resolution CT as the gold standard.
230
YOUSEM ET AL. AJNR:12, March/April19913000
Tll-50, TE•IS
2000
0 diSCI
+ bone•
S I D 1:9'1
"
cord• 100040 60 80 100
1l£U
A
B
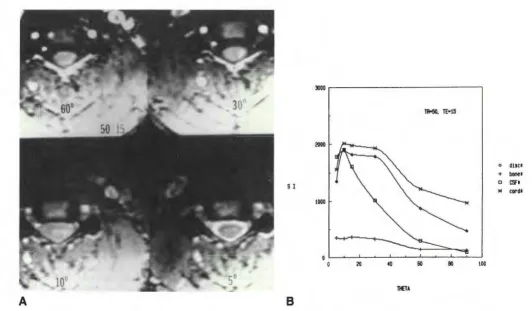
Fig. 1.-Evaluation of signal and contrast with a 30FT volume gradient-echo series, 50/15, with varying flip angles at the same anatomic level. Window width and level are kept constant to demonstrate effect of variations in flip angle.
A, CSF-bone contrast is very high and CSF-cord contrast is high with
s•
and 10• flip angles (bottom right and left, respectively); CSF is bright, but cord-CSF contrast at 10• is low. At 30° and 60° (top right and left, respectively), there is high cord-CSF-cord contrast owing to dark-intensity cord-CSF. Bone-cord-CSF distinction decreases atao•
and&o•.
Disk is high in intensity at all flip angles.B, Graph of signal intensity (51) vs
s•,
10•, 15°, 30°, 60°, and 90° flip angles shows maximum bone-cSF, bone-disk, and bone-cord contrast at 10°; however, disk, cord, and CSF are of similar intensity at this flip angle. Thes•
sequence, which distinguishes between cord, CSF, and disk while maintaining high bone contrast, is preferable. The 30° sequence shows the highest CSF-cord and CSF-disk contrast, while maintaining high signal to noise, which drops off for all flip angles after 30° owing to saturation effects. CSF-bone contrast decreases with high flip angles.Subjects and Methods
In order to determine the flip angle that would optimize contrast in the cervical spine, scans were obtained in a normal volunteer, varying the angle of nutation from 5° to 90° (Fig. 1A). The TR and TE were held constant at 50 and 15 msec, respectively (as were the receive and transmit attenuations), with gradient-moment nulling applied.
Signal intensities of a region of interest in the CSF, spinal cord, disk, and vertebral body were determined for each flip angle (Fig. 1 B). From this preliminary study, it was determined that a 5° flip angle produced high-intensity CSF, optimized CSF-bone contrast, and maintained CSF-cord differentiation. The 30° sequence generated low-intensity CSF and produced the greatest cord and CSF-disk contrast while maintaining high signal intensity in the cord and disk. These flip angles were selected for routine use on a 1.5-T General Electric Signa scanner. The minimum TE was selected, 11 msec for the 30° series and 15 msec for a flow-compensated 5° series; the TR was maintained at 50 msec. The TE of the 30° series was reduced to its minimum value to obtain the highest SJN and low-intensity CSF, and to minimize susceptibility artifacts. The TE of 15 msec for the 5° sequence was necessarily higher because gradient-moment nulling was added to obtain high-intensity CSF and to reduce CSF flow artifacts.
As part of the routine study of the cervical spine, we routinely obtain a sagittal 800/20-25/2 (TRJTEjexcitations) scan with 3-mm contiguous slices. These images often, but not always, include the
neural foramina if the patient is not very scoliotic and localization is not a problem. For the purposes of this study, which was to evaluate the foramina on axial MR images comparable to axial CT scans, we did not use these images as part of the assessment. The sagittal 800/25 and the two axial 30FT sequences described above make up the entire routine cervical spine protocol for degenerative disease at our institution.
Twenty-one patients referred to the neuroradiology section for evaluation of disk disease of the cervical spine underwent CT exam-ination as well as 30FT gradient-echo thin-section MR imaging using protocols determined from the normal volunteer study. One hundred twenty neural foramina were included in the cervical spine studies.
The MR and CT scans were reviewed independently and blindly by three senior members of the American Society of Neuroradiology with extensive CT and MR experience. The evaluators were not provided with the patients' clinical symptoms. CT and MR scans were interpreted separately and randomly.
The evaluators were provided with high-resolution axial CT images of the neural foramina, which included 41 postmyelography 1.5-mm thin section levels, two postmyelography 3.0-mm section levels, and 17 unenhanced 3-mm section levels with two neural foramina at each level (120 neural foramina). The MR evaluations consisted of two separate series that used the 30FT technique with gradient-recalled acquisition in the steady state, 1.5-mm contiguous sections, a 256
x
[image:2.613.37.569.67.378.2]gradient moment nulling, which generated high-intensity CSF. The second series used parameters of 50/11/30° without
gradient-mo-ment nulling, which generated low-intensity CSF. Although 64 slices
were obtained in the data set, only 60 1 .5-mm contiguous sections
were displayed because of aliasing artifacts.
All spinal levels that were evaluated by both CT and MR were included in this study. While MR scans routinely covered from C2-C3 to C7-T1 in a 60-slice series, the CT scans were selected on the basis of findings at myelography or by the request of the referring clinician. Thus, the CT levels determined which MR images were obtained for comparison. In this study, the reviewers evaluated four levels at C2-C3, seven levels at C3-C4, 12 levels at C4-C5, 16 levels at C5-C6, 17 levels at C6-C7, and four levels at C7-T1 (and two neural foramina at each level).
A
c
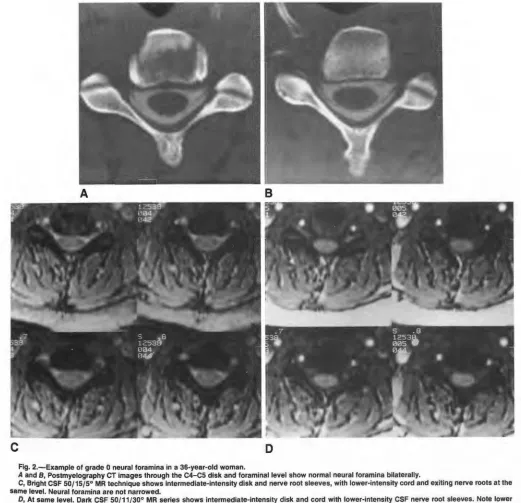
Fig. 2.-Example of grade 0 neural foramina in a 36-year-old woman.
The evaluation of each neural foramen consisted of a numeric score of 0 (within normal limits or minimally narrowed) or 1 (mod-erately to severely narrowed). When the images were uninterpretable, they were called indeterminate. The indeterminate label was used when scans were technically suboptimal for foramina! visualization (either owing to aliasing, motion degradation, or metallic artifact) or when the evaluators believed there was insufficient contrast between CSF and bone and disk to determine confidently whether the neural foramen was narrowed or not. MR and CT standards were provided for the two grades (0 and 1) in order to obtain a uniform grading scale and to avoid individual biases (Fig. 2). Each individual interpret-er's CT scans were evaluated in the same fashion. The CT interpre-tations were used as the gold standard with which to compare that evaluator's MR interpretations. Despite the fact that 1.5- and
3.0-B
D
A and 8, Postmyelography CT images through the C4-c5 disk and foraminallevel show normal neural foramina bilaterally.
C, Bright CSF 50/15/5° MR technique shows intermediate-intensity disk and nerve root sleeves, with lower-intensity cord and exiting nerve roots at the same level. Neural foramina are not narrowed.
[image:3.612.44.565.232.735.2]232
YOUSEM ET AL. AJNR:12, March/April1991mm-thick sections and postmyelography and unenhanced CT studies were used as the gold standard, the results of the MR correlation did not vary for each subtype of CT technique (see Results), so using this "nonuniform" gold standard was justifiable.
Thin-section CT was used as the gold standard for several reasons: (1) patients without significant foramina! narrowing do not undergo surgery; (2) patients often are treated conservatively for radiculop-athy; (3) from an anterior approach (the preferred operative technique at this institution for disk disease), the neural foramen cannot be
A
[image:4.612.42.569.188.667.2]c
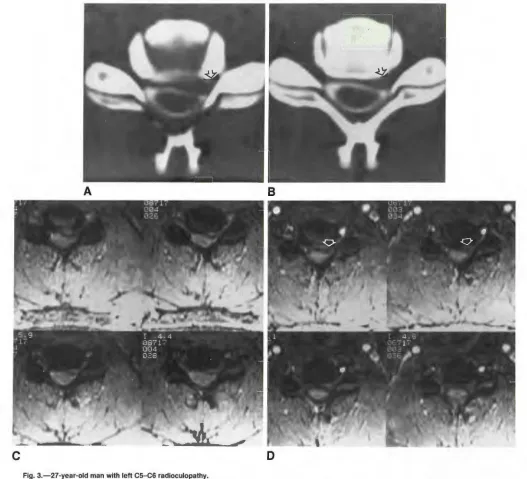
Fig. 3.-27-year-old man with left C5-C6 radioculopathy.
8
D
visualized directly, and histopathology cannot assess for the size of the neural foramen; (4) a surgical selection bias exists in favor of surgery in patients with disk herniation; and (5) determination of neural foramina! narrowing should be done preoperatively.
Each neural foramen, when scored as moderately or severely narrowed, was also assessed as to the cause of the narrowing on both CT and MR. The options for this part of the evaluation included bony narrowing, diskogenic narrowing, both bony and disk narrowing, or indeterminate or uninterpretable. The CT interpretations for the
A and 8, Postmyelogram CT scans through disk level (A) and at foramina (8) show left-sided, focally herniated disk (arrows) entering foramen. Two of
three evaluators diagnosed herniated disk only and one diagnosed herniated disk and bony osteophyte as the cause of foramina I narrowing (on the basis of "hypertrophied" left Luschka joint seen better on a higher section). All examiners believed the foramen was narrowed.
C, High-intensity CSF MR technique shows intermediate-intensity disk material with low-intensity rim extending to left neural foramen. Bony neural canal in lower left image is narrowed laterally. Interpretation by two evaluators was bony osteophyte and herniated disk causing foramina! narrowing, while one evaluator diagnosed herniated disk alone.
D, Low-intensity CSF images show disk herniation (arrows) to left side. Hypointensity posterior to disk was believed to represent CSF and therefore
cause of the neural foramina! narrowing were used as the proof of diagnosis for each independent observer's MR interpretation.
In order to evaluate interobserver concordance, the CT and MR grades of the neural foramina were compared for each level. If any one evaluator graded the narrowing as indeterminate on either CT or MR, the level was not included in the concordance figures for that observer. A similar analysis for interobserver concordance regarding the cause of narrowing was made. Again, levels labeled indeterminate
were removed from the analysis of the evaluator who labeled the neural foramen as indeterminate.
One evaluator graded the CT scans twice (in two separate ses-sions) to determine intraobserver variation with a "proved" method.
Results
On the basis of each evaluator's own interpretation of the CT scans, the accuracy for the assessment of neural foramina!
narrowing in 3DFT MR ranged from 73% to 82% with the
low-flip-angle, high-intensity CSF technique. When using the 30°-flip-angle, low-intensity CSF technique, the accuracy ranged from 66% to 86% (Table 1). No significant differences were noted in the CT-MR correlation values when 1.5- or 3-mm-thick CT images were interpreted. The average accuracy rate of the three evaluators when grading the MR images
(combining 5° and 30° data) vs the 3-mm-thick CT sections
was 74.2% and vs the 1.5-mm-thick CT slices was 77%. The 5° MR series did not detect narrowing that was evident on CT in 27 studies, while the 30° series did not detect CT-documented narrowing in 41 neural foramina. Of 17 cases in which narrowing was seen on CT to be caused by disk herniation, MR was interpreted as normal in one instance
(5.9%) on both the 5° and 30° series. In the 141 levels of
CT-documented bony narrowing, the 5° MR series was inter-preted as normal in 26 (18.4%) instances, while the 30° MR series was interpreted as normal in 40 (28.4%) instances
(Table 2). No case of CT-documented bone and disk narrow-ing (15 instances) was interpreted as normal on MR.
When the interpretations on 5° MR and CT disagreed, the evaluators were twice as likely to consider foramina! narrow-ing on the 5° series when there was none by CT than they were to interpret the 5° MR as normal when CT showed foramina! narrowing. Thus, the average false-positive (i.e., CT
negative, MR positive) rate for the three interpreters was
16.1% (15.3%, 11. 7%, and 20.8% for evaluators 1, 2, and 3,
respectively) for the 5° series. The average false-negative
(i.e., CT positive, MR negative) rate was 8.0% (11.1 %, 6.3%,
and 6.7% for evaluators 1, 2, and 3, respectively) for the 5°
TABLE 1: Identification on MR of the Presence and Cause of CT-Verified Narrowing of Neural Foramina
Presence of Narrowing
Cause of Narrowing (%)
Evaluator No. (%)
so Series 30° Series so Series 30° Series
1 74 66 70 48
2 82 86 73 76
3 73 78 92 88
Average 76 77 78 7S
!'lote:-Aithoug.h the variation in the evaluators' accuracy in interpreting the
30 senes was w1der than that of the so series, the two series had similar
average accuracies with CT as the proof of diagnosis.
TABLE 2: Analysis of Discrepancies Between MR and CT Interpretations of the Cause of Neural Foramina! Narrowing
MR Series/Interpretation
so Bony osteophyte Disk herniation Combination Normal 30° Bony osteophyte Disk herniation Combination Normal CT Diagnosis
Bony Disk
Osteophyte Herniation
(n = 141) (n = 17)
0 2
s 0
14 6
26 1
0 3
2 0
11 0
40 1
Combination (n = 1S)
4 1 0 0 10 2 0 0
Note.-lnterpretations of all three evaluators were combined· indeterminate
interpretations were excluded. The "combination" diagnosis w'as used when
both bony osteophytes and disk herniations were found.
TABLE 3: Number of Neural Foramina! Levels Uninterpretable on MR
MR Series
Evaluator No.
so 30°
1 3 11
2 7 29
3 0 s
Total 10 4S
Note.-AIIIevels were interpretable on CT. The high number of indeterminate
levels seen with the 30° technique was due to the lower contrast between
CSF and bone, w~ich caused decreased confidence in determining if bony
protrusion ex1sted 1n the neural foramen. Technical artifacts accounted for far fewer uninterpretable levels.
series. When the individual interpretations of the 30° series
and CT disagreed, the evaluators overcalled foramina!
nar-rowing with an average false-positive rate of 1 0.2% (9.1 %,
7.5%, and 13.3% for evaluators 1, 2, and 3, respectively).
The false-negative rate for the 30° series was 13.3% (24.5%,
6.5%, and 8.3% for evaluators 1, 2, and 3, respectively).
A marked difference was noted in the number of total
indeterminatejuninterpretable examinations. For the three
evaluators, no levels were deemed indeterminate on CT, 1 0
on the 5° series, and 45 on the 30° series (Table 3). This led
to false elevation of the accuracy of the 30° values since the
denominator for the ratios was lower with the 30° series (i.e.,
accuracy figures were calculated after omitting any case
where an indeterminate score was given).
When the cause of the narrowing was evaluated, the 5°
and 30° studies agreed with CT in 70-92% and 48-88% of
the levels, respectively (Table 1 and Figs. 3 and 4). The most
frequent disagreement occurred when narrowing on CT was
reported to be due to osteophyte, but MR was reported as showing both bony and disk disease (Table 2). Of 141
in-stances when an evaluator interpreted the CT scan as
show-ing osteophytic narrowshow-ing, the MR image was interpreted as
showing both bony and diskogenic narrowing in 14 instances
(9.9%) on the 5° series and in 11 instances (7.8%) with the 30° technique. The next most frequent error was when the
CT scan was interpreted as showing bone and disk
narrow-ing, but the MR image was interpreted as showing just bony
234 YOUSEM ET AL. AJNR:12, MarchfApril1991
lnterobserver concordance in evaluating the foramina on the 5° series ranged from 77% to 90% for the presence of narrowing and 49% to 69% for its cause (Table 4). With the 30° series, interobserver concordance ranged from 66% to 81% for the presence of narrowing and from 70% to 78% for its cause. The range of interobserver concordance on CT was
81-87% for the presence of foramina! narrowing and
80-94% for the cause of narrowing.
In order to assess the highest expected level of accuracy obtainable with any neuroimaging study for cervical foramina! narrowing, we tested intraobserver concordance on CT, a method widely regarded as a proven tool for this entity. The
c
intraobserver concordance for evaluating the CT scans was
85.5% for the presence of and 94% for the cause of narrowing
(interpreter 2).
Discussion
Initial MR studies evaluating the neural foramina were hin-dered by section thickness (=::4 mm) and interslice gap lim-itations [1-4]. This led to unfavorable comparisons with postmyelography CT in studies with surgical confirmation, particularly with regard to the evaluation of osteophytic neural foramina! stenosis [2-4]. MR interpretations with thick
sec-B
D
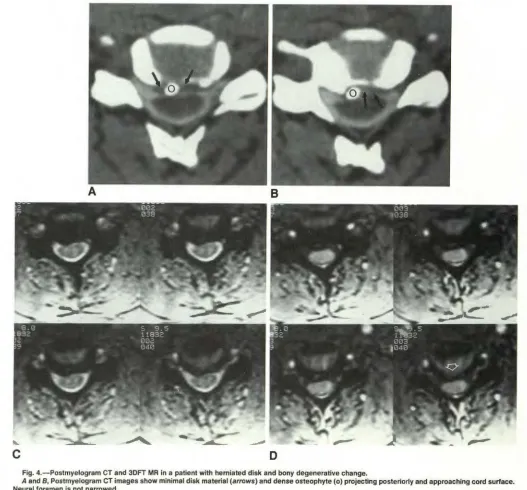
Fig. 4. -Postmyelogram CT and 30FT MR in a patient with herniated disk and bony degenerative change.
A and 8, Postmyelogram CT images show minimal disk material (arrows) and dense osteophyte (o) projecting posteriorly and approaching cord surface.
Neural foramen is not narrowed.
C, 30FT low-flip-angle images suggest mild right foraminal narrowing, predominantly due to osteophytic disease.
[image:6.612.41.568.229.719.2]TABLE 4: lnterobserver Concordance as to the Presence and
Cause of Neural Foramina! Narrowing on MR and CT Images
Finding/ MR(%) CT
Evaluator Nos. 5° Series 30° Series (%)
Presence of narrowing
1 and 2 77 71 87
1 and 3 82 66 81
2 and 3 90 81 84
Average 83 73 84
Cause of narrowing
1 and 2 49 70 82
1 and 3 63 74 80
2 and 3 69 78 94
Average 61 75 86
Note-lnterobserver concordance was better on CT interpretations than on MR interpretations. This difference was most striking in examinations of the cause of neural foramina! narrowing.
tions typically underreported foramina! stenosis. Accuracy as
to the cause of foramina! narrowing also has been reported
to be less with MR than CT. The explanations for the relative
inaccuracy of MR imaging included the variable presence of bone marrow within the osteophyte resulting in obscuration of spurs (being similar in intensity to disk material), osteo-phytes masking disk herniations, and volume averaging [2-4]. Because of these findings it is widely held that conventional spin-echo MR lacks specificity and sensitivity in evaluating bony foramina! disease. We sought to further explore this belief with the 3DFT pulse sequence.
With 3DFT gradient-echo imaging, an entire volume of
tissue is excited and data are collected from the entire slab. Scan times are reduced by limiting TR, thus limiting patient
motion artifacts, yet high SfN is maintained by obtaining data
from an entire imaging slab [5-7]. In order to spatially encode the information, a phase-encoding gradient is applied both along slice-selection (z) axis as well as the in-plane phase-encoding (y) axis [5, 6]. By using a relatively short TR, many thin section slices can be obtained contiguously while
main-taining a reasonable scan time. The benefits of 3DFT imaging
derive from the ability to obtain thin, contiguous sections (which do not suffer significantly from cross-talk and partial-volume effects). Thinner sections reduce problems with
vol-ume averaging and reduce magnetic susceptibility artifacts.
A distinguishing feature when compared with the
two-dimen-sional sequential mode relates to the improvement in SfN
when exciting a slab of tissue. Whereas in the 2DFT mode,
the S/N is independent of the number of locations scanned,
SfN in 3DFT increases as the square root of the number of slice encodings. Thus, the SfN is proportional to both the square root of the number of slices and the square root of the number of excitations. Therefore, for instance, by halving the number of excitations and doubling the number of slice
encodings, the S/N remains unchanged. This permits
in-creased coverage of pertinent anatomy without the penalty
of lengthened acquisition times. Unlike in two-dimensional
imaging, where slice thickness is essentially limited by the
available gradient power, slab partitioning into slices in
three-dimensional imaging is achieved by phase encoding. Current
imaging techniques allow slice thicknesses as thin as 0.7 mm,
but, in general, section thickness is limited solely by SfN in
3DFT scanning. Section thickness on conventional 2DFT MR
is limited by gradient strength. As with 2DFT imaging, SfN in
three-dimensional imaging scales proportional to voxel size,
so one sacrifices SfN to achieve very thin sections.
The advantage of reducing the TE to as short as possible
derives from the resulting reduction in susceptibility artifacts.
This is particularly important at bony interfaces in the cervical
spine. To a lesser degree, shorter TEs will contribute to
maintaining high S/N as relaxation occurs in this interval.
Applied to the cervical spine, 3DFT gradient-echo
tech-niques allow acquisition of 60 1.5-mm contiguous sections
from C2-C3 to C?-T1 in 6.5 min. The high
bone-CSF-nerve-root sleeve contrast when low-flip-angle (<1 0°) techniques
are used allows excellent visualization of foramina! anatomy
and disease (Fig. 1) [6, 7]. Typically, four to five 1.5-mm-thick
slices through the foramina are obtained to evaluate
narrow-ing or lateral disk herniations. Although surgical intervention
for bony neural foramina! disease often is not indicated, its detection is important to explain the patient's symptoms since
other more peripheral lesions can mimic nerve root
compres-sion. Additionally, when significant neural foramina! narrowing
is coupled with disk herniations, the surgical management
may be altered.
Because of the infrequency of surgical intervention for bony
narrowing of cervical neural foramina, this study relied on CT
as the gold standard for evaluating the foramina. When there
is no significant narrowing, it is impossible to get surgical
proof, a point we acknowledged when determining the
meth-odology for this study. Conservative, nonsurgical
manage-ment, possibly even with the use of steroids, is an alternative
to surgery in many cases. Even when surgery is performed,
an anterior approach may be preferred for disk disease, which limits the surgeon's ability to detect how narrowed the fora-men is and occasionally by what process. For these reasons, we used thin-section CT as our gold standard. In doing so,
however, we realized that no true comparison could be made
of the accuracy of MR and CT. We thus set CT's accuracy
at 100%, so MR could never be proved to be better than CT
in this study. Our intention was to see how well the two
techniques correlated with each other. We intentionally
stud-ied the neural foramina because evaluation of bony disease
is one of MR's weakest areas.
Our study demonstrates that interpretation of 3DFT
gra-dient-echo MR agrees with CT in the determination of neural
foramina! narrowing in over 75% of the cases with both the
5° and 30° flip angle series, when adequate studies are
available. Of the cases in which the evaluators failed to detect
abnormalities on MR that were seen by CT, 66 (97%) of 68
were because of bony encroachments. Therefore, the relative
MR was more likely to be interpreted as showing foramina! stenosis when none was present on CT than not to demon-strate stenosis when CT was interpreted as having shown it.
MR image interpretation concurred with that of CT as to the cause of the narrowing in 78% (5°) and 71% (30°) of the levels when both studies agreed they were narrowed. Most of the cases in which the interpretations of the causes of the narrowing differed between CT and MR consisted of in-stances where bone and disk were confused with bone alone (65%). In fact, one might wonder whether MR, with its supe-rior soft-tissue resolution, may be more accurate than CT in these cases. It is likely that remnants of hard disk herniations seen on MR may be present in some of the cases reported as bony osteophytes only on CT.
The interobserver concordance with MR was greater with the bright CSF technique (overall 83.0%) than the dark CSF series (73%) for the grading of narrowing. We believe that this is because of the lower contrast between the bony margins of the foramen and the CSF with the dark CSF 30° technique. The uncertainties of our interpreters regarding the foramina! margins in the presence of dark CSF is reflected in the very large number of indeterminate images with this technique (45 instances). One interpreter had a particularly difficult time distinguishing between bone and CSF in the lateral foramina and believed he could not confidently deter-mine if the foramen was narrowed or not. The mean CT interobserver concordance (84% for grading) was in the same range of values as the 5° bright CSF results (83%) and compares favorably with the intraobserver concordance of the CT reading (85.5%). Because the evaluator's accuracy for grading the narrowing on MR scans (84%) was nearly the same as his accuracy in interpreting the CT scans on different days (85.5%), the study suggests that the maximum accuracy that one could expect to obtain in grading narrowing is approximately 85%, regardless of the technique.
The average CT inter- and intraobserver concordance were 85% and 94%, respectively, for the cause of narrowing. The comparative MR values of 75% for the 30° technique and 61% for the 5° technique suggest that CT is more reproduc-ible in identifying the cause of narrowing. A steep learning curve may still exist in the MR technique, however, as evi-denced by the wide range of values among evaluators.
Hedberg et al. [8] studied the efficacy of gradient-echo MR in the evaluation of cervical radiculopathy in 1988. They used low flip angles and 5-mm contiguous sections. In 29 of 30 locations, surgery confirmed the MR findings: in only one case of a ventrolateral osteophyte did the patient's clinical symp-toms and surgical findings disagree with the MR impression. The MR-CT myelography correlation was 1 00% in 25 pa-tients. These results led the authors to conclude that "MR imaging is the initial procedure of choice for the evaluation of suspected cervical radiculopathy" [8]. The use of thin-section 1.5-mm contiguous 30FT imaging should only enhance the enthusiasm for MR in this area. Our results suggest that the enthusiasm should be tempered by the understanding that MR interpretation will disagree with CT in up to 25% of cases, even in the hands of experienced neuroradiologists.
A recent nonblinded, nonrandomized study compared 30FT thin-section MR with 20FT techniques in the evaluation of neural foramina [9]. Because this study used contiguous 1.5- to 2.0-mm 30FT slices and compared them with 4-mm 20FT scans with 1-mm interslice gaps, the results were not
surprising. The thinner slice technique provided greater detail of narrowing, and the apparent image contrast subjectively was greater with the high-intensity CSF 30FT technique than with low-intensity CSF technique [9].
Many artifacts can degrade the 30FT images. Motion in this 6.5-min series, including swallowing and respiratory mo-tion, may prevent adequate evaluation of the foramina [5, 6]. Aliasing, in which the upper and lower slices are "wrapped around" each other, degrades slices at the extremes of the slab, typically the upper and lower first four slices. Therefore, one may have to sacrifice visualization of the C2-C3 level if clinical suspicion of disease is at the C7-T1 level in order to ensure high-quality images at the lower level. Ferromagnetic artifact in the postoperative cervical spine also will degrade gradient-echo images.
In our routine evaluation of the cervical spine, we use a contiguous 3-mm-thick sagittal 800/20/2 spin-echo se-quence, followed by the 5° 50/15/1 30FT sequence with gradient-moment nulling, a 256
x
128 matrix, and 60 1.5-mm contiguous sections. We also include the 30° 50/11/1 se-quence without gradient-moment nulling. Our results suggest that 30FT gradient-echo, thin, contiguous-section MR imag-ing is useful in assessimag-ing the neural foramina, since its accu-racy in the best of interpreters approaches that of the intraob-server concordance when double reading CT scans, approx-imately 85%. The wide range of variability in our evaluators' grading of foramina suggests that the learning curve for MR interpretation probably has not peaked as it has with CT, and therefore its accuracy is strongly interpreter dependent.Presumably, as neuroradiologists gain more experience with the technique, the reliability and reproducibility of MR interpretation will increase. It is still more difficult for MR to depict small bony encroachments on the foramina than to detect herniated disk material. The large number of indeter-minate or uninterpretable images on the 30° technique, cou-pled with the superior bone-CSF contrast on the 5° technique, suggests that the latter is the more useful examination in the evaluation of the foramina.
REFERENCES
1. Czervionke LF, Daniels DL, Ho PSP, et al. Cervical neural foramina: correlative anatomic and MR imaging study. Radiology 1988;169: 753-759
2. Modic MT, Masaryk TJ, Mulopulos GP, Bundschuh CV, Han JS, Bohlman H. Cervical radiculopathy: prospective evaluation with surface coil MR imaging, CT with metrizamide, and metrizamide myelography. Radiology
1986;161 :753-759
3. Brown BM, Schwartz RH, Frank E, Blank NK. Preoperative evaluation of cervical radiculopathy and myelopathy by surface-coil MR imaging. AJNR 1988;9: 859-866
4. Modic MT, Masaryk T J, Ross JS, Mulopulos GP, Bundschuh CV, Bohlman H. Cervical radiculopathy: value of oblique MR imaging. Radiology
1987;163:227-231
5. Wehrli FW, Atlas SW. Fast imaging: principles, techniques, and clinical applications. In: Atlas SW, ed. Magnetic resonance imaging of the brain
and spine. New York: Raven Press, 1990:1013-1078
6. Carlson J, Crooks L, Ortendahl D, Kramer OM, Kaufman L. Signal-to-noise ratio and section thickness in two-dimensional versus three-dimensional Fourier transform imaging. Radiology 1988;166:266-270
7. Enzmann DR, Rubin JB, Wright A. Cervical spine MR imaging: generating high signal CSF in sagittal and axial images. Radiology 1987;163: 233-238
8. Hedberg MC, Drayer BP, Flom RA, Hodak JA, Bird CR. Gradient echo (GRASS) MR imaging in cervical radiculopathy. AJNR 1988;9:145-151