1491
MS
Investigation of Apparent Diffusion Coefficient and
Diffusion Tensor Anisotropy in Acute and Chronic
Multiple Sclerosis Lesions
Andrew L. Tievsky, Thomas Ptak, and Jeffrey Farkas
BACKGROUND AND PURPOSE: The various stages of multiple sclerosis (MS) are charac-terized by de- and remyelination as well as by inflammation. Diffusion MR imaging is sensitive to tissue water motion, which might correspond to these pathologic processes. Our purpose was to demonstrate differences in apparent diffusion coefficient (ADC) and diffusion tensor anisotropy in acute and chronic MS plaques and in normal-appearing brain.
METHODS: Twelve MS patients underwent conventional and full-tensor diffusion MR im-aging with B 5 1221 s/mm2. Derivation of trace ADC and calculation of anisotropic scalars, including eccentricity, relative anisotropy (RA), and fractional anisotropy (FA) was performed on a per-pixel basis. Regions of interest of plaques and normal structures were determined on coregistered maps. MS lesions were classified as acute, subacute, or chronic on the basis of their appearance on conventional images and in relation to clinical findings.
RESULTS: Seven patients had acute plaques with a concentric arrangement of alternating high and low signal intensity on diffusion-weighted images. In nine acute lesions, plaque centers had high ADC with reduced anisotropy compared with rim, normal-appearing white matter (NAWM), and chronic lesions. The thin rim of diffusion-weighted hyperintensity surrounding the center showed variable ADC and anisotropic values, which were not statistically different from NAWM. Subacute and chronic MS lesions had intermediate ADC elevations/anisotropic reductions. Calculated FA pixel maps were superior to eccentricity or RA maps; however, quality was limited by signal-to-noise constraints.
CONCLUSION: ADC and diffusion anisotropic scalars reflect biophysical changes in the underlying pathology of the demyelinating process.
The acute episode of multiple sclerosis (MS) is characterized by perivenular inflammation with ax-onal preservation and demyelination. A healing phase with incomplete remyelination follows. These events may occur in cyclic fashion, resulting in progressive deterioration of neuronal transmis-sion and clinical function. Chronic letransmis-sions, after
Received July 17, 1998; accepted after revision March 15, 1999.
Presented at the annual meeting of the American Society of Neuroradiology, Toronto, May 1997.
From the Department of Radiology, Georgetown University Medical Center, Washington, DC (A.L.T.); the Department of Radiology, Boston Medical Center (T.P.); and the Department of Radiology, Massachusetts General Hospital and Harvard Medical School, Boston (J.F.).
Address reprint requests to Andrew L. Tievsky, MD, Divi-sion of Neuroradiology CCC-2, Department of Radiology, Georgetown University Medical Center, 3800 Reservoir Rd NW, Washington, DC 20037.
qAmerican Society of Neuroradiology
several such cycles, show hypocellularity of both glia and axons (1, 2).
sor eigenvalues represent reproducible values that reflect inherent biophysical properties of tissue structure. Whereas apparent diffusion coefficient (ADC) values for normal white and gray matter are virtually identical, cerebral white matter shows varying degrees of diffusion anisotropy, while the gray matter possesses nearly equal diffusion in all directions, or isotropy. Calculated scalar indexes show increasing values for subcortical U fibers, the internal capsule, the corona radiata, the forceps ma-jor and minor, and the corpus callosum, respective-ly. The inherent diffusion anisotropy of myelinated fiber tracts provides a parameter that might help characterize and possibly quantify the state of my-elination of MS lesions using MR imaging.
ADC elevation in MS lesions has been reported previously (7–9). We proposed to quantify and compare ADC and diffusion tensor anisotropic sca-lars in regions of acute and chronic demyelination in MS as a correlate to the underlying pathology. A secondary goal of this project was to evaluate the quality and utility of calculated anisotropic maps calculated from full-tensor diffusion MR data.
Methods
Twelve patients with well-documented definite or clinically probable MS were examined with conventional and diffusion-weighted MR imaging. Studies were performed on a commer-cial 1.5-T scanner with echo-planar gradient strength of 10 mT/ m. Full-tensor spin-echo (SE) diffusion-weighted imaging was
performed in six gradient directions with B 5 1221 s/mm2.
T2-weighted SE echo-planar images were obtained at each lev-el with the diffusion gradients off for the purposes of ADC
calculation (actual B 5 57 s/mm2). Technical factors were
6000/118/3 (TR/TE/excitations), 2563128 matrix, 40320-cm
field of view, 17 sections, and a total imaging time of approx-imately 2 minutes. Voxel dimensions were 1.56 mm in the x and y axes, with a 6-mm section thickness, for a voxel volume
of 14.6 mm3. Diffusion-weighted images and trace ADC maps
were generated on-line. On a UNIX workstation, the
eigen-valuesl1,l2, andl3 were computed from the diffusion tensor
on a per-voxel basis and then used to generate anisotropic maps.
Calculated scalar indexes of tensor anisotropy, as described by Basser et al (5), included eccentricity, relative anisotropy (RA), and fractional anisotropy (FA).
Eccentricity (Ecc) of the diffusion tensor describes the el-lipsoid nature of the principal and minor axes with reference to a circle:
Ecc5Ï12l3/l1
Eccentricity is 0 for isotropic states and approaches 1 for the highly anisotropic condition of nearly unidirectional diffusion. By separating the isotropic (D)I and anisotropic components
(D)2(D)I of the diffusion deviatoric, other indexes may be
calculated. The RA scalar represents a measurement of devi-ation from the isotropic state of the diffusion tensor:
ÏD:D
RA5
Ï(D)I:(D)I
its isotropic component.
FA measures the fraction of the magnitude of the diffusion tensor that is anisotropic:
FA
2 2 2
3 (l12 ^D& )1(l22 ^D& )1(l32 ^D& ) 5
! !
2 l21l 21l 21 2 3
For RA and FA, values equal 0 for the isotropic condition, in which diffusion is equal in all directions and approach a value of 1 for extreme directional inequality, such as for the cylin-drical cigar-shaped anisotropic medium, which closely models water diffusibility in myelinated fiber tracts.
Region of interest (ROI) determinations measuring 232
and 33 3 pixels were obtained manually on a Sun
worksta-tion. Regions whose measurements were contaminated by par-tial volume effects of CSF were excluded. ROIs of frontal subcortical normal-appearing white matter (NAWM) and deep gray matter in the posterior thalamus were used for reference values. A semiautomated program enabled simultaneous de-termination of diffusion-weighted imaging signal intensity, T2 echo-planar imaging signal intensity, ADC, three eigenvalues, eccentricity, FA, and RA on coregistered image maps. Statis-tical analysis was performed by calculating correlation coef-ficients and by applying independent and correlated two-tailed t-tests where appropriate.
MS lesions were classified by consensus of two neurora-diologists as being acute, subacute, or chronic on the basis of T1 and T2 relaxation characteristics, the presence of contrast enhancement after administration of a gadolinium chelate, and surrounding edema (10). Plaques that were considered to be acute were characterized by peripheral contrast enhancement after administration of gadopentetate, by central T1 hypoin-tensity/T2 hyperintensity, and, in most cases, by a rim of T2 edema. These lesions frequently corresponded to neurologic deficits. Using commonly accepted criteria, other plaques were categorized as either subacute, owing to the presence of edema or contrast enhancement, or chronic, on the basis of morphol-ogy and signal characteristics. Anisotropic maps were evalu-ated for image quality by consensus of two neuroradiologists.
Results
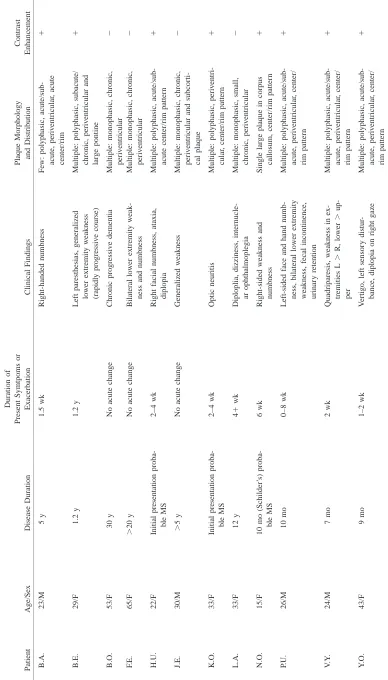
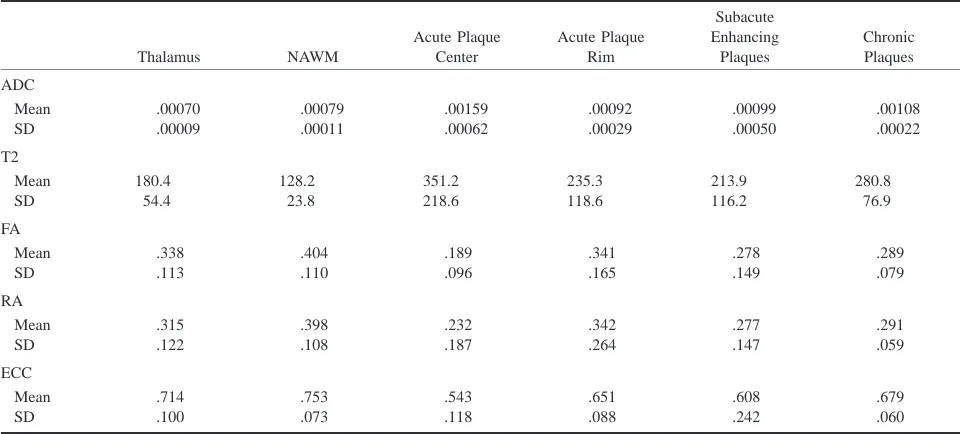
Clinical and radiologic findings are summarized in Table 1. A complete data set consisting of ADC and anisotropic scalars was determined for 46 MS plaques in 12 patients. Global results of plaque classification and measurements are given in Table 2. Analysis of all plaques revealed an inverse re-lationship between ADC and anisotropic indexes. FA, RA, and eccentricity values were closely cor-related, in accordance with previous studies of these parameters (3, 5) (Table 3).
FA maps were judged superior to RA and ec-centricity for general image quality in all cases. All calculated maps, however, were degraded by ran-dom noise imposed by relative signal-to-noise (S/ N) constraints, which have been reported previous-ly (11). Accordingprevious-ly, for 18 lesions, additional ADC and FA measurements were obtained by hand ROI measurements.
plaques in 12 patients with MS Thalamus NAWM Acute Plaque Center Acute Plaque Rim Subacute Enhancing Plaques Chronic Plaques ADC Mean SD .00070 .00009 .00079 .00011 .00159 .00062 .00092 .00029 .00099 .00050 .00108 .00022 T2 Mean SD 180.4 54.4 128.2 23.8 351.2 218.6 235.3 118.6 213.9 116.2 280.8 76.9 FA Mean SD .338 .113 .404 .110 .189 .096 .341 .165 .278 .149 .289 .079 RA Mean SD .315 .122 .398 .108 .232 .187 .342 .264 .277 .147 .291 .059 ECC Mean SD .714 .100 .753 .073 .543 .118 .651 .088 .608 .242 .679 .060
[image:4.612.47.527.85.302.2]Note.—ADC indicates apparent diffusion coefficient; FA, fractional anisotropy; RA, relative anisotropy, ECC, eccentricity; NAWM, normal-appearing white matter.
TABLE 3: Correlation matrix for anisotropy indexes and ADC for 46 MS lesions in 12 patients
ADC ECC FA RA
ADC ECC FA RA 1 20.7573* 20.7091* 20.6839* 1 0.9545* 0.9443* 1 0.987* 1
Note.—ADC indicates apparent diffusion coefficient; ECC, eccen-tricity; FA, fractional anisotrophy; RA, relative anisotrophy.
* P,.01.
alternating high and low signal intensity on diffu-sion-weighted images, rim enhancement after ad-ministration of contrast material, and peripheral edema (Figs 1–3). These lesions showed a hypoin-tense center on diffusion-weighted images, char-acterized by high ADC values and T2 prolongation, surrounded by a hyperintense rim, with variable ADC and intermediate T2 signal hyperintensity. Typically, there was peripheral edema, distin-guished by moderate increases in ADC and T2 sig-nal. The diffusion-weighted imaging appearance of the center and rim can be explained by central de-phasing due to high ADC, with T2 ‘‘shine through’’ in the rim caused by relatively unaffected ADC values, comparable to NAWM, in association with elevated T2 signal. Chronic plaques had high-er ADC values and a tendency toward isotropy, as compared with NAWM, and were of intermediate signal intensity relative to the centers of acute le-sions. A typical chronic case of MS is illustrated in Figure 4.
The ADC and FA median and range for catego-rized plaques and normal structures are summacatego-rized graphically in Figure 5. Correlated and independent two-tailed t-tests showed that statistically significant relationships of ADC and FA were complementary: ADC acute plaque center .ADC acute plaque rim (P,.01); FA acute plaque center,FA acute plaque rim (P , .01); ADC acute plaque center . ADC NAWM (P,.05) and thalamus (P,.05); and FA acute plaque center , NAWM (P , .05) and thal-amus (P ,.05). There was considerable variability and lack of statistical significance between ADC and FA measurements of acute plaque rims and NAWM or thalamus.
Differences between ADC and FA measurements of 64 subacute and chronic plaques lacked statistical significance. Accordingly, these lesions were grouped together. ADC subacute/chronic plaques . ADC NAWM (P , .01) and thalamus (P , .001); FA subacute/chronic plaques ,FA NAWM (P , .05); ADC subacute/chronic plaques,ADC acute plaque center (P,.05); FA subacute/chronic plaques.FA acute plaque center (P ,.01).
Discussion
[image:4.612.47.276.383.445.2]FIG1. Patient H.U.: 22-year-old woman with acute plaques and multiple neurologic signs and symptoms of 2 to 4 weeks’ chronicity at first presentation of MS.
A–F, Multiple monophasic ring lesions are identified on T1-weighted contrast-enhanced (A) and FLAIR (B) images. Lesion centers show hypointensity on diffusion-weighted image (C) with corresponding increased diffusibility (brightness) on calculated ADC map (D), caused by increased water mobility in regions of acute inflammation. Reduction in anisotropy in these regions is present on calculated maps of eccentricity (E) and FA (F). Note that region of peripheral edema is readily differentiated from thin plaque rim on ADC map. ADC values: NAWM, 0.00081; left periventricular acute plaque center, 0.00211; left periventricular acute plaque rim, 0.00124. FA values: NAWM, 0.299; left periventricular acute plaque center, 0.111; left periventricular acute plaque rim, 0.162.
The concentric ring appearance of acute le-sions we observed on diffusion-weighted images is in accordance with serial studies of plaque evo-lution on MR images in patients with relapsing-remitting MS (10). Increased diffusivity with an-isotropic reduction in the plaque center may be secondary to the combined effects of increased extracellular water and loss of myelin. Blood-brain barrier disruption in acute MS, due to as-trocytic damage or functional impairment of in-tact endothelium or both, results in an increase in extracellular water in the perivenular region, which constitutes part of the plaque center. Oli-godendrocyte damage also occurs early in plaque development, resulting in demyelination and al-teration of axonal conduction, which is a signif-icant contributor to neurologic dysfunction.
Elec-tron microscopy studies have shown the presence of inflammatory infiltrates of lymphocytes and lipid-engulfing macrophages, swollen oligoden-droglia, as well as expansion of extracellular vol-umes. In an acute plaque, these pathologic pro-cesses evolve in a centrifugal manner. The rim of an acute lesion is characterized by histopatholog-ic findings of capillary alterations, whhistopatholog-ich are thought to account for ring enhancement of these lesions. We speculate that the variability of ADC and anisotropic scalars in the plaque rim in the region of active demyelination, as defined in this study, represents the presence of vasogenic ede-ma in the extracellular space superimposed on cytotoxic edema of oligodendroglia.
preser-FIG2. Patient V.Y: 24-year-old man with 7-month history of relapsing-remitting MS presented with quadriparesis, most severe in upper extremities, and left periventricular acute plaque.
A–E, Note delineation of the hyperintense rim on diffusion-weighted image and relative hypointensity of lesion center (A). T2-weighted echo-planar image shows marked central hyperintensity and slightly lower signal in rim (B). Center has increased diffusibility, appearing almost as bright as CSF, and has a low ADC value (dark) in the rim on calculated ADC map (C). FA (D) and eccentricity (E) maps reveal intermediate anisotropic values in rims relative to lesion centers, which approach isotropy. ADC values: NAWM, 0.00071; left periventricular acute plaque center, 0.00136; left periventricular acute plaque rim, 0.00066. FA values: NAWM, 0.430; left periventricular acute plaque center, 0.135; left periventricular acute plaque rim, 0.362.
vation, reactive astrogliosis, and absence of acute inflammation. Extracellular water is increased rel-ative to uninvolved white matter. These histopath-ologic findings would seem to correlate well with intermediate ADC elevations and a tendency to-ward isotropy.
Considerable variability in ADC and anisotrop-ic scalars was observed between measurements of morphologically similar lesions in the present study. In addition to intrinsic differences in dif-fusivity, measurements of MS plaques were af-fected by the technical limitations of echo-planar diffusion-weighted MR imaging. Relatively low S/ N ratios, echo-planar artifacts, and other factors affecting the magnitude and uniformity of image signal intensity, while not objectionable for qual-itative diagnostic purposes, produce significant
co-FIG3. Patient N.O.: 15-year-old girl with 10-month history of Schilder’s MS variant.
A–E, Unusual bihemispheric callosal plaque shows a mixed pattern with rim enhancement on T1-weighted contrast-enhanced (A) and T2-weighted (B) images. Diffusion-weighted image shows moderate hyperintensity, caused by T2 shine through in lesion center, with hyperintense rim (C). Calculated ADC map (not shown) revealed increased diffusibility in lesion center with slight decrease in rim. Calculated maps of FA (D) and eccentricity (E) show marked tendency toward isotropy in lesion center, with minimal anisotropic reduction in rim. ADC values: NAWM, 0.00068; acute plaque center, 0.00155; acute plaque rim, 0.00072. FA values: NAWM, 0.568; acute plaque center, 0.176; acute plaque rim, 0.312.
ordination with the development of clinically practical non–echo-planar diffusion pulse se-quences will improve the reliability of absolute diffusion measurements.
Another limitation of the methodology in this study is the failure to account for the inherent spa-tial/anatomic dependence of anisotropic measure-ments, which may result in erroneous comparisons of voxels in different white matter regions (5, 14). For example, these anatomic factors produce aniso-tropic differences between acute plaque rim and NAWM, in addition to histopathologic factors. In general, owing to differences in local fiber organi-zation, the true significance of absolute anisotropic measurements can only be appreciated in relation to normal contralateral brain structures. However, since most MS patients harbor microscopic or macroscop-ic disease in contralateral periventrmacroscop-icular white mat-ter, corona radiata, and subcortical white matmat-ter, use of ‘‘mirror’’ measurements or other internal controls for comparing ROIs may not be accurate.
Also, our classification of plaques in the sub-acute category may not be entirely accurate in view of the absence of serial MR examinations in these patients. While the true age range of the lesions is unknown, their morphologic characteristics suggest that they were undergoing remyelination (10).
FIG4. Patient B.O.: 53-year-old woman with 40-year history of MS, presenting with dementia. T2 hyperintensity and ADC elevation are apparent with loss of white matter anisotropy in multiple chronic periventricular and subcortical plaques.
A–E, Diffusion-weighted image (A), T2-weighted echo-planar image (B), ADC map (C), and calculated maps of eccentricity (D) and FA (E). ADC values: NAWM, 0.00097; right corona radiata chronic plaque, 0.00083; left periventricular chronic plaque, 0.00071. FA values: NAWM, 0.334; right corona radiata chronic plaque, 0.289; left periventricular chronic plaque, 0.445.
there is considerable pathologic heterogeneity in chronic MS lesions with respect to the amount of extracellular water and axonal loss, and do not correspond well to MR appearance on T1- or T2-weighted images (19, 20).
With future anticipated improvements in statis-tical reliability, it is likely that anisotropic mea-surements of NAWM might provide an index of fiber myelination that reflects the cumulative le-sion burden not currently obvious on routine im-ages. Hence, one might speculate that a proposed future application for tensor MR imaging would be in the serial evaluation of lesion load in patients with long-standing disease, such as in comparison with histograms of serial whole-brain diffusion anisotropic studies that have been thresholded to remove CSF effects. Longitudinal epidemiologic studies will be necessar y to confirm this hypothesis.
Conclusion
in-FIG5. A, ADC median and range of MS plaques as compared with deep gray matter (thalamus) and NAWM.
B, FA median and range of MS plaques as compared with deep gray matter (thalamus) and NAWM.
crease in extracellular water, exhibit intermediate ADC elevation and moderate reductions in aniso-tropic values as compared with NAWM.
References
1. Ludwin SK. Central nervous system remyelination: studies in
chronically damaged tissue. Ann Neurol 1994;36(Suppl):143–145
2. Weinshenker BG. Natural history of multiple sclerosis. Ann Neurol 1994;36(Suppl):6–11
3. Basser PJ, Mattiello J, Le Bihan D. Anisotropic diffusion: MR
diffusion tensor imaging. In: Le Bihan D, ed. Diffusion and
Per-fusion Magnetic Resonance Imaging: Applications to Functional MRI. New York: Raven; 1995:140–149
4. Douek P, Turner R, Pekar J, Patronas N, Le Bihan D. MR color
mapping of myelin fiber orientation. J Comput Assist Tomogr
1991;15:923–929
5. Basser PJ, Pierpaoli C. Microstructural and physiological
fea-tures of tissues elucidated by quantitative-diffusion-tensor MRI. J Magn Reson B 1996;111:209–219
6. Hsu EW, Mori S. Analytical expressions for the NMR apparent
diffusion coefficient in an anisotropic system and a simplified method for determining fiber orientation. Magn Reson Med
1995;34:194–200
7. Larsson HB, Thomsen C, Frederiksen J, Stubgaard AM, Henrik-sen O. In vivo magnetic resonance diffusion measurement in
the brain of patients with multiple sclerosis. Magn Reson
Im-aging 1992;10:7–12
8. Horsfield MA, Lai M, Webb SL, et al. Apparent diffusion
co-efficients in benign and secondary progressive multiple scle-rosis by nuclear magnetic resonance. Magn Reson Imaging
1996;36:393–400
9. Christiansen P, Gideon P, Thomsen D, Stubgaard M, Henriksen O, Larsson HBW. Increased water self-diffusion in chronic plaques
and in apparently normal white matter in patients with mul-tiple sclerosis. Acta Neurol Scand 1992;87:195–199
10. Guttman CRG, Sungkee SA, Liangge H, Kikinis R, Jolesz FA.
The evolution of multiple sclerosis lesions on serial MR. AJNR
Am J Neuroradiol 1995;16:1481–1491
11. Wu O, Weiskoff RM, Copen WA, Rosen BR, Sorensen AG.
Comparison of scalar metrics of anisotropy in ischemic hu-man brain using diffusion weighted magnetic resonance im-aging. In: Proceedings of the International Society of Magnetic
Resonance in Medicine; April 12–18, 1997; Vancouver, BC, Canada
12. Tievsky AL, Gonzalez RG, Rosen BR, Sorensen AG.
Investiga-tion of ADC changes in acute cerebral infarcInvestiga-tion with isch-emia. Presented at the annual meeting of the American Society
of Neuroradiology, Philadelphia, May 1998
13. Tievsky AL, Schaefer PW, Gonzalez RG, Rosen BR, Sorensen AG. Full tensor diffusion-weighted imaging of white matter
shear injury. Presented at the annual meeting of the American
Society of Neuroradiology, Toronto, May 1997
14. Moseley ME, Kucsharczyk J, Asgari HS, Norman D.
Anisot-ropy in diffusion-weighted MRI. Magn Reson Med 1991;19:
321–326
15. Barbosa S, Blumhardt LD, Roberts N, Lock T, Edwards RH.
Mag-netic resonance relaxation time mapping in multiple sclerosis: normal appearing white matter and the ‘‘invisible’’ lesion load. Magn Reson Imaging 1994;12:33–42
16. Gass A, Barker GJ, Kidd D. Correlation of magnetization
trans-fer ratio with clinical disability in multiple sclerosis. Ann
Neu-rol 1994;36:62–67
17. Simon JH. Contrast-enhanced MR imaging in the evaluation
of treatment response and prediction of outcome in multiple sclerosis. J Magn Reson Imaging 1997;7:29–37
18. Mammi S, Filippi M, Martinelli V, et al. Correlation between
brain MRI lesion volume and disability in patients with mul-tiple sclerosis. Acta Neurol Scand 1996;94:93–96
19. Barnes D, Munro PMG, Youl BD, Prineas JW, McDonald WI.
The long-standing MS lesion. Brain 1991;114:1271–1280
20. Jacobs L, Kinkel WR, Ploachini I, Kinkel RP. Correlations of