1207
MS
Assessment of Internal Auditory Canal Tumors: A
Comparison of Contrast-Enhanced T1-Weighted and
Steady-State T2-Weighted Gradient-Echo MR Imaging
Petra Schmalbrock, Donald W. Chakeres, James W. Monroe, Ashok Saraswat, Beth A. Miles, and D. Bradley Welling
BACKGROUND AND PURPOSE: Although contrast-enhanced T1-weighted MR imaging is the standard of reference for diagnosing tumor in the cerebellopontine angle, high-resolution T2-weighted imaging may show more details of the seventh and eighth cranial nerve branches, resulting in more accurate tumor volume measurements. The purpose of this study was to compare two MR sequences for their ability to delineate internal auditory canal tumors.
METHODS: Twenty-seven ears in 21 patients with 16 confirmed schwannomas were studied with the 3D T2-weighted prototype segment-interleaved motion-compensated acquisition in steady state (SIMCAST) and the T1-weighted contrast-enhanced spoiled gradient-echo (SPGR) techniques. Twenty-eight axial sections were acquired using parameters of 17/3.3 (TR/TE), a 408 flip angle, a 203 15-cm or 22 3 16-cm field of view (FOV), a 5123 256 matrix, and a 0.4- or 1.2-mm section thickness for the SIMCAST technique, and 30/4.2, a 308flip angle, a 20 3 20-cm FOV, a 5123288 matrix, and a 1.5-mm section thickness for the SPGR technique. Tumor appearance and depiction of surrounding anatomy, including the cranial nerves, were evaluated. Tumor volumes were measured by manual tracing.
RESULTS: Both sequences clearly identified tumors that ranged in size from 0.06 to 3.0 cm3.
Measurements on both sequences agreed, on average, within 14%. The information from both sequences was complementary. SIMCAST usually delineated the CSF spaces better, whereas SPGR more clearly showed the tumor/brain boundary.
CONCLUSION: SIMCAST and SPGR are suitable for tumor detection and volume mea-surements. SPGR has somewhat better contrast, but SIMCAST excels at depicting the sur-rounding anatomy and tumor involvement of the seventh and eighth cranial nerves.
Because lesions in the inner ear and cerebellopon-tine angle (CPA) are readily detected with contrast-enhanced T1-weighted MR imaging, this is the pre-ferred method for screening patients with suspected CPA tumors (1–3). However, a more detailed char-acterization of the lesions, beyond mere detection, would be of significant clinical interest. For ex-ample, for patients with small tumors, knowledge of the involvement of individual nerve branches may better aid surgical procedures aimed at hearing
Received April 1, 1998; accepted after revision March 22, 1999.
Supported in part by research grant 5-R29-DC-01646 from the National Institute for Deafness and Other Communication Disorders, National Institutes of Health.
From the Departments of Radiology (P.S., D.W.C., J.W.M., A.S.) and Otolaryngology (B.A.M., D.B.W.), The Ohio State University, Columbus, OH.
Address reprint requests to Petra Schmalbrock, PhD, De-partment of Radiology, The Ohio State University, MRI Fa-cility, 1630 Upham Dr, Columbus, OH 43210.
qAmerican Society of Neuroradiology
preservation. Furthermore, it is common clinical practice not to treat older patients surgically but rather to monitor their tumor growth. The monitor-ing and characterizmonitor-ing of tumors are also of interest for follow-up studies in patients who have had sur-gery or who have been treated with stereotactic radiosurgery.
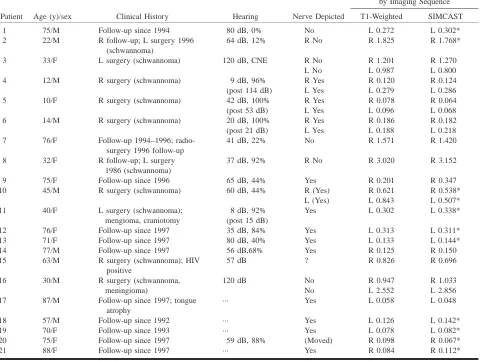
TABLE 1: Patient data and tumor sizes
Patient Age (y)/sex Clinical History Hearing Nerve Depicted
Size of Tumor (cm3)
by Imaging Sequence
T1-Weighted SIMCAST
1 75/M Follow-up since 1994 80 dB, 0% No L 0.272 L 0.302*
2 22/M R follow-up; L surgery 1996 (schwannoma)
64 dB, 12% R No R 1.825 R 1.768*
3 33/F L surgery (schwannoma) 120 dB, CNE R No R 1.201 R 1.270 L No L 0.987 L 0.800 4 12/M R surgery (schwannoma) 9 dB, 96% R Yes R 0.120 R 0.124 (post 114 dB) L Yes L 0.279 L 0.286 5 10/F R surgery (schwannoma) 42 dB, 100% R Yes R 0.078 R 0.064 (post 53 dB) L Yes L 0.096 L 0.068 6 14/M R surgery (schwannoma) 20 dB, 100% R Yes R 0.186 R 0.182 (post 21 dB) L Yes L 0.188 L 0.218 7 76/F Follow-up 1994–1996;
radio-surgery 1996 follow-up
41 dB, 22% No R 1.571 R 1.420
8 32/F R follow-up; L surgery 37 dB, 92% R No R 3.020 R 3.152 1986 (schwannoma)
9 75/F Follow-up since 1996 65 dB, 44% Yes R 0.201 R 0.347
10 45/M R surgery (schwannoma) 60 dB, 44% R (Yes) R 0.621 R 0.538* L (Yes) L 0.843 L 0.507* 11 40/F L surgery (schwannoma); 8 dB, 92% Yes L 0.302 L 0.338*
mengioma, craniotomy (post 15 dB)
12 76/F Follow-up since 1997 35 dB, 84% Yes L 0.313 L 0.311* 13 71/F Follow-up since 1997 80 dB, 40% Yes L 0.133 L 0.144*
14 77/M Follow-up since 1997 56 dB,68% Yes R 0.125 R 0.150
15 63/M R surgery (schwannoma); HIV positive
57 dB ? R 0.826 R 0.696
16 30/M R surgery (schwannoma, 120 dB No R 0.947 R 1.033
meningioma) No L 2.552 L 2.856
17 87/M Follow-up since 1997; tongue atrophy
··· Yes L 0.058 L 0.048
18 57/M Follow-up since 1992 ··· Yes L 0.126 L 0.142*
19 70/F Follow-up since 1993 ··· Yes L 0.078 L 0.082*
20 75/F Follow-up since 1997 59 dB, 88% (Moved) R 0.098 R 0.067*
21 88/F Follow-up since 1997 ··· Yes R 0.084 R 0.112*
* SIMCAST studies with 0.4-mm thick sections.
cheaper but less sensitive auditory brain stem re-sponse (ABR) testing (11, 12). While large lesions have been clearly depicted with fast spin-echo (FSE) (7, 8) and constructive interference in steady state (CISS) (9, 10) imaging, some small lesions (,5 mm) were missed in previous work (8). Therefore, it is desirable to further increase spatial resolution; in par-ticular, slice resolution with T2-weighted MR imaging.
The purpose of this study was to compare the prototype SIMCAST sequence with routine con-trast-enhanced T1-weighted 3D spoiled gradient-echo (SPGR) imaging for the evaluation of tumors of the internal auditory canal (IAC). The SIM-CAST sequence is based on similar principles as the CISS sequence (7, 13) but uses fractional ech-oes and averaging of four or more interleaved ac-quisitions with different RF phases (rather than the maximum intensity projection of two acquisitions used with CISS) to minimize susceptibility artifacts and to produce maximal signal for moving fluid. Previous studies have shown that the SIMCAST sequence, particularly when used with high-speed
gradients, has the highest resolution capability among the T2-weighted sequences for inner ear im-aging (14). SIMCAST and contrast-enhanced T1-weighted imaging were compared for their ability to allow accurate measurements of tumor volume, for their characterization of tumor signal, and for their depiction of the spatial relationship between tumors and nerves in the IAC.
Methods
TABLE 2: Grading of image contrast
0 (Darkest) 1 2 3 (Brightest)
T1-weighted Hypointense relative to CSF Isointense with CSF Isointense with brain Hypointense relative to brain SIMCAST Hypointense relative to brain Isointense with brain Isointense with CSF Hypointense relative to CSF
schwannomas. Six patients had surgery after the MR imaging study reported here and two had unilateral surgery before the first MR imaging evaluation. Data on these postsurgical ears were excluded from the image analysis. Thus, 16 of 27 tumors were schwannomas (eight confirmed by postsurgical evalua-tion plus an addievalua-tional eight that were assumed to be schwan-nomas, since the other ear had a surgically confirmed schwannoma).
Axial images were acquired with a 1.5-T MR system using the standard quadrature head coil. Images with T2-weighted appearance were acquired with the segment-interleaved mo-tion-compensated acquisition in steady state (SIMCAST) se-quence, which is a prototype 3D gradient-echo pulse sequence (14). Gradient moments were compensated over TR for all axes. Short fractional echoes were acquired to minimize de-phasing due to flow motion and susceptibility effects. Suscep-tibility artifacts were also avoided by averaging four acquisi-tions with different RF phase stepping (13, 14). To avoid potential problems with gross patient motion, the four data sets with different RF phases were acquired in an interleaved fash-ion. The first 11 SIMCAST examinations were acquired with parameters of 17/3.5 (TR/TE), a flip angle of 408, a 223 16-cm field of view (FOV), a 5123256 matrix, and 32 1.2-mm-thick sections. In the 10 more recently acquired studies, high-speed gradient coils were used, with smaller FOVs, of 203 15 cm, and thinner sections, of 0.8 mm (interpolated to 0.4 mm). In all cases, the SIMCAST images were acquired before the injection of contrast material.
Contrast-enhanced T1-weighted images were obtained after the injection of 10 mL of contrast agent with a 3D spoiled gradient-echo sequence (15) using parameters of 30/4.2/1 (TR/ TE/excitation), a flip angle of 308, a 20320-cm FOV, a 512
3288 matrix, and 64 1.5-mm-thick sections. Both sequences had similar scan times of 7 minutes.
Magnified views of the inner ears of patients with acoustic lesions obtained with both the contrast-enhanced T1-weighted and the SIMCAST sequences were analyzed in detail. Images were assessed for tumor extent, tumor heterogeneity, and de-piction of other inner ear structures (cochlea, vestibule, and semicircular canals). A relative grading scheme was used to assess the tumor contrast. For the T1-weighted images, the grade levels were 0 (darkest)5hypointense relative to CSF, 1 5 isointense with CSF, 2 5 isointense with brain, and 3 (brightest)5hyperintense relative to brain. For the SIMCAST images, the grading scheme was 0 (darkest) 5 hypointense relative to brain, 1 5 isointense with brain, 2 5 isointense with CSF, and 3 (brightest) 5 hyperintense relative to CSF (Table 2).
For tumor volume measurements, the images were trans-ferred to an off-line workstation (GE, Advantage Windows workstation). On each image section, tumors were manually traced by a neuroradiologist using the workstation software, and volumes were computed. In all cases, the SIMCAST im-ages were traced first so as to avoid biasing toward the stan-dard of reference (the T1-weighted images).
Results
All 27 lesions were clearly depicted with both sequences. Using the contrast-enhanced T1-weight-ed study as the standard of reference, the sensitivity of the SIMCAST sequence was 100% (27/27).
Re-markably, small tumors with volumes as low as 0.05 cm3 were clearly depicted. In all 21 patients, the cochlea, vestibule, and semicircular canals were clearly delineated bilaterally on the SIMCAST im-ages, whereas these structures were seen poorly on the T1-weighted images. The complete course of the seventh and eighth nerves in the CPA and IAC was seen on the SIMCAST sequences in normal ears. Lesions were seen in the IAC (27/27 lesions) protruding into the CSF spaces of the CPA (12/27) and eroding the IAC (9/27).
In 18 of the 27 affected ears, portions of the vestibulocochlear or facial nerve branches could be seen on axial SIMCAST images (Figs 1 and 2). In these cases, the axial images were reformatted into sagittal, coronal, and oblique planes or along a curved plane that followed the shape of the nerves. Individual vestibulocochlear nerve branches are best depicted on sagittal or oblique sagittal refor-matted sections through the IAC (14), whereas curved reformatted images often allowed visualiza-tion of the entire course of the nerves from the brain stem to the fundus of the IAC. Since the con-trast-to-noise ratio between CSF and nerves is low on T1-weighted sequences, nerve depiction was usually poor on T1-weighted images. Nerves were never seen inside the tumor mass.
For the 27 SIMCAST images, the contrast was rated 0 (hypointense relative to brain, Table 2) in seven cases and 1 (isointense with brain) in 20 cases. That means lesions were always clearly dif-ferentiated from the surrounding high-signal CSF, but for most lesions extending toward the brain stem, the tumor/brain boundary was not distin-guishable merely by the tissue signal contrast. However, in most cases, the tumor margin could be determined on the basis of the shapes of the ana-tomic structures or by using intervening vessels as landmarks separating the tumor from the brain (Fig 3). For the 27 contrast-enhanced T1-weighted se-quences, the contrast was rated 3 (hyperintense rel-ative to brain) in 25 cases and 2 (isointense with brain) in two cases. Thus, tumor/brain distinction was better on contrast-enhanced T1-weighted im-ages. However, owing to the low CSF signal on T1-weighted images, fluid/bone boundaries were poorly defined, and thus the extent of tumor from the fluid spaces into the bony regions was not as clearly distinguishable.
FIG1. Case 19: Slightly oblique axial reformatted images of a small mass.
A, SIMCAST image acquired in 5:05 minutes with parameters of 12.3/2.3, 408flip angle, 22316-cm FOV, 5123256 matrix, 32-kHz receiver bandwidth, four RF phase stepping loops (14), and 32 0.8-mm-thick sections interpolated to 0.4 mm.
B, Contrast-enhanced study acquired in 4:07 minutes with parameters of 40/4.2/1, 308flip angle, identical FOV and matrix size, 15.6-kHz receiver bandwidth, and 32 1.6-mm-thick sections interpolated to 0.8 mm.
Both images (A and B) depict the superior portion of the IAC. On the SIMCAST image (A), a continuous dark line extending from the brain stem to the fundus of the IAC is seen in the anterior portion of the IAC, presumably the facial nerve (solid arrows). Only a portion of the facial nerve is seen on the T1-weighted image (B). With SIMCAST, the tumor mass (open arrow) is clearly seen in the posterior portion of the IAC, displacing the facial nerve anteriorly and leading to a tortuous course around the tumor. Tumor volumes of 0.082 cm3and 0.078 cm3were measured on the SIMCAST and T1-weighted images, respectively. The tumor size is 6 mm along the IAC with
both sequences, but may appear slightly wider across the IAC on the T1-weighted image than on the SIMCAST image, possibly due to partial volume effects or to tumor involvement of the nerve, leading to signal enhancement. Note that small vessels (dashed arrows) have low signal on the SIMCAST image and high signal on the T1-weighted images, due to the presence of contrast agent in the vessels. With the SIMCAST sequence, using zero-order motion-compensated gradients over TR, no signal loss is observed with slow motion, such as is present in CSF or in the IAC (v,0.6 cm/s; phantom study by Schmalbrock P, presented at the International Society for Magnetic Resonance in Medicine, 1998). Higher-order motion components are present for faster vascular flow and result in dephasing and signal decrease, accounting for the low vascular signal.
FIG2. Case 11.
A and B, Reformatted axial (A) and coronal (B) SIMCAST images acquired in 5:05 minutes with parameters of 12.3/2.3, 408flip angle, 22316-cm FOV, 5123256 matrix, 32-kHz receiver bandwidth, four RF phase stepping loops (14), and 32 0.8-mm-thick axial sections interpolated to 0.4 mm.A was magnified by a factor of three from the original data and reformatted along an axially oriented curved surface from the brain stem to the superior portion of the IAC containing the facial nerve (fn). Only a portion of the superior vestibular nerve (svn) is seen in this view. B was magnified sixfold and reformatted along a coronally oriented curved surface following the facial nerve in the anterior portion of the IAC. Other labeled structures include the pons (pons), the pontomedullary junction ( pmj ), and the superior aspect of the porus acousticus (spa). The curved views permit continuous depiction of the facial nerve from the brain stem to the fundus of the IAC. On the curved axial image (A) the facial nerve is pushed anteriorly by the tumor (open arrow). On the curved coronal image (B), the nerve courses superiorly to the tumor. There is remodeling of the IAC. In this patient, surgery preserved hearing.
two cases. This indicates that some of the tumors were probably necrotic, hemorrhagic, or partially cystic. On SIMCAST images, cystic tumor regions had higher signal intensity than brain, helping to distinguish the brain tumor margin; however, these tumor regions were more difficult to separate from CSF. Tumors that were partially cystic or necrotic did not enhance homogeneously. This led to diffi-culty in identifying margins between tumor and CSF with confidence on the contrast-enhanced
im-ages, and such tumor portions were defined better on the SIMCAST studies.
FIG 3. Case 10: IAC mass (right side)
with a tumor volume of 0.6 cm3.
A–D, On SIMCAST images (A and C), acquired in 5:05 minutes with parameters of 12.3/2.3, 408 flip angle, 22 3 16-cm FOV, 5123 256 matrix, 32-kHz receiver bandwidth, four RF phase stepping loops (14), and 32 0.8-mm-thick sections inter-polated to 0.4 mm, the tumor is isointense with brain tissue; nevertheless its bound-ary may be estimated by using vascular structures (arrows) as reference points. On contrast-enhanced images (B and D), acquired in 5:20 minutes with parameters of 30/4.2/1, 308 flip angle, 20 3 20-cm FOV, 5123288 matrix, 15.6-kHz receiver bandwidth, and 60 1.5-mm-thick sections, the hyperintense tumor is easily distin-guishable from the adjacent flocculus (fl) and cerebral peduncle.
consistent between studies (ie, in agreement within 15% or less) in the majority of cases (17/27). Spe-cifically, when the tumors were surrounded by CSF or bone interfaces, the measurements were accu-rate. Discrepancies in tumor volumes of more than 15% were observed only in 10 cases. Two of these patients (cases 4 and 9) had heterogeneous tumors, and variations in tumor volume measurements may be anticipated, since each technique presented dif-ficulties in evaluating different portions of the tu-mors. In a third patient (case 10), a large CPA com-ponent was not accurately evaluated with the SIMCAST sequence. Large discrepancies in tumor volume were also observed in seven small tumors, with volumes less than 0.15 cm3. However, these percentage differences amounted to small differ-ences in actual volume (0.01 to 0.03 cm3), corre-sponding to only a few image voxels. Finally, mea-surements were repeated in five ears by another investigator, and were in agreement to within 10%, except in one ear, in which the tumor margin was not clearly delineated (case 10).
Discussion
The goal of our study was to assess the capabil-ities of a new prototype T2-weighted MR imaging method, the SIMCAST sequence, and to compare it with standard contrast-enhanced T1-weighted im-aging. Specifically, we measured tumor volumes, evaluated tumor signal characteristics, and studied
the tumor involvement of the individual nerve branches.
Both contrast-enhanced T1-weighted imaging and the SIMCAST method clearly depicted all tu-mors, and tumor volume measurements were ob-tained for a wide range of sizes, from 0.05 to 3.1 cm3. In addition, the SIMCAST sequence provided excellent visualization of the inner ear anatomy. All individual branches of the cranial nerves in the IAC and CPA were routinely seen with SIMCAST, whereas these structures generally were not depict-ed on T1-weightdepict-ed images. Even though both methods could identify the presence of tumor, availability of contrast-enhanced T1- and T2-weighted images allowed a more thorough assess-ment of the disease. Comparison of the signal char-acteristics of heterogeneous tumors on T1- and T2-weighted images may allow assessment of the nature of the abnormality (cystic, necrotic, hemor-rhagic), and tumor boundaries may be more accu-rately determined, as both methods may fail to clearly delineate tumor margins. Thus, acquisition of complementary information may be particularly useful in follow-up examinations.
Our study gives some initial indication of the advantages of SIMCAST imaging with very high spatial resolution.
Tumor Detection and Screening
sev-eral authors (4–10) as an alternative to T1-weight-ed imaging, with its additional cost for contrast ma-terial, or the less reliable ABR testing (11, 12). It is not clear whether other abnormalities that cause hearing loss, such as inflammatory (Ramsey-Hunt syndrome, syphilis, viral otitis, middle ear sepsis), metastatic, or other idiopathic entities, are reliably detected on noncontrast examinations. However, it is clear that only T2-weighted studies with very high resolution are capable of showing them, as low-resolution studies are known to have missed tumors (8). This may be due, at least in part, to partial volume averaging. For example, one may assume a worst-case scenario in which a very small tumor is located partially in two adjacent sections, which leads to reduced tumor contrast; such a tu-mor may easily be missed. It is therefore important to increase the section resolution. One may expect to detect all tumors if the section thickness is com-parable or less than the thickness of the cranial nerve branches. Consequently, SIMCAST imaging, using high-speed gradients with the capacity for nearly isotropic voxels, may be a favorable method for tumor screening.
Accuracy of Tumor Volume Measurements
Our data indicate that accuracy of tumor volume measurements is limited mainly by the inability to delineate tumor margins. In our study, in-plane res-olution was 0.4 3 0.8 mm (interpolated to 0.4 3 0.4 mm), and the section thickness was 1.2 in older studies or 0.8 mm (interpolated to 0.4 mm) for the most recent SIMCAST studies and 1.5 mm for con-trast-enhanced T1-weighted images. Thus, partial volume effects are expected to be most significant in the section direction in which the resolution is two to four times lower. In our study, even the 10 smallest tumors (,0.15 cm3) were clearly seen on four to five sections on the older studies and in 10 to 15 sections on the recent SIMCAST studies, whereas they were seen in only two to three sec-tions on the T1-weighted images with lower section resolution. Thus, problems with partial volume av-eraging in the section direction were insignificant. Limited in-plane resolution may lead to errors in tracing tumor boundaries. Since volume measure-ments from SIMCAST and contrast-enhanced im-ages agreed within 15%, and because repeated measurements by two investigators agreed within 10%, one may assume that errors due to manual tracing and partial volume effects were approxi-mately 10% to 15%. So even though our study did not include test/retest evaluation, one may conclude that tumor growth can be estimated with 15% to 20% accuracy, provided that tumor boundaries are clearly delineated.
Depiction of Nerve Involvement
Finally, high-resolution T2-weighted SIMCAST imaging is advantageous because it permits
evalu-ation of tumor involvement of individual nerves (Figs 1 and 2). Previous studies of healthy subjects have shown that the SIMCAST technique can de-pict the nerve branches accurately even in narrow IACs (14). Very high-resolution SIMCAST images also give a better picture of nerve placement and can be used to measure nerve diameters. In our study, vestibulocochlear nerves or nerve segments were seen in 17 of 27 affected ears. Four of these patients underwent unilateral surgery, and some de-gree of hearing preservation was achieved in three cases (Table 1). Note that patients in whom nerves were depicted had consistently better hearing. The average hearing threshold was 41 dB when nerves were seen and 77 dB when nerves could not be identified (Table 1). This suggests that high-reso-lution SIMCAST images may be good predictors of surgical outcome.
Conclusion
Our study demonstrates that high-resolution T2-weighted SIMCAST imaging can detect small lesions in the inner ear with a high degree of accuracy. Al-though 3D FSE imaging may produce similar results, our previous study showed that SIMCAST provides a better signal-to-noise ratio per unit of scan time (14). This may make SIMCAST imaging a suitable candidate for low-cost tumor screening; however, the addition of contrast-enhanced T1-weighted imaging provides complementary information and is therefore beneficial, especially in the follow-up of patients with known lesions or in presurgical evaluation. Monitor-ing of tumor growth is important, since the biological behavior of these tumors is unpredictable. Many are found in elderly patients with other medical prob-lems. If they are stable, it may be best to observe them, for without an accurate means of following up these tumors, it is not possible to decide on the best management strategy. Our study offers some initial indication that high-resolution SIMCAST imaging and contrast-enhanced 3D-SPGR can be used for ac-curate monitoring of tumor growth; however, a more extensive study with a larger number of follow-up studies is needed.
References
1. Weissman J. Hearing loss. Radiology 1996;199:593–611 2. Chakeres DW, Oehler M, Schmalbrock P, Slone W. Temporal
bone imaging. In: Som PM, Curtain HD, eds. Head and Neck Imaging. St Louis: Mosby; 1996;1319–1350
3. Stone JA, Chakeres DW, Schmalbrock P. High resolution
imag-ing of the auditory pathway. MR Clin North Am 1998;6:
195–217
4. Lee JN, King BD, Parker DL, Buswell HR. High resolution 3D
imaging of the inner ear with a modified fast spin-echo pulse sequence. J Magn Reson Imaging 1996;6:223–225
5. Casselman JW, Kuhweide R, Deimling M, Ampe W, Dehaene I, Meeus L. Constructive interference in steady-state-3DFT MR
imaging of the inner ear and cerebellopontine angle. AJNR Am J Neuroradiol 1993;14:47–57
6. Jackler RK. Cost-effective screening for acoustic neuroma with
7. Allen RW, Harnsberger HR, Shelton C, et al. Low-cost high
res-olution fast spin-echo of acoustic schwannoma: an alternative to enhanced conventional spin-echo MRI? AJNR Am J Neuro-radiol 1996;17:1205–1210
8. Fukui M, Weissman JL, Curtin HD, Kanal E. T2-weighted MR
characteristics of internal auditory masses. AJNR Am J Neu-roradiol 1996;17:1211–1218
9. Casselman JW, Kuhweide R, Dehaene I, Ampe W, Devlies F.
Magnetic resonance examination of the inner ear and cere-bellopontine angle in patients with vertigo and/or abnormal findings at vestibular. Acta Otolaryngol Suppl (Stockh) 1994;
513:15–27
10. Stuckey SL, Harris AJ, Mannolini SM. Detection of acoustic
schwannoma: use of constructive interference in the steady state three-dimensional MR. AJNR Am J Neuroradiol 1996:17;
1219–1225
11. Carrier DA, Arriaga MA. Cost-effective evaluation of
asym-metric sensorineural hearing loss with focused magnetic
res-onance imaging. Otolaryngol Head Neck Surg 1997;116:567–
574
12. Welling D, Glasscock M, Woods C, Jackson C. Acoustic
neuro-ma: a cost-effective approach. Head Neck Surg 1990;103:
364–370
13. Zur Y, Wood ML, Neuringer LJ. Motion-insensitive, steady-state
free precession imaging. Magn Reson Med 1990;16:444–459
14. Kurucay S, Schmalbrock P, Chakeres DW, Keller PJ. A segment
interleaved motion compensated acquisition in the steady state technique for high resolution imaging of the inner ear. J Magn Reson Imaging 1997;7:1060–1068
15. Vlaardingerbroek MT, DeBoer JA. Magnetic Resonance
Imag-ing. Berlin: Springer; 1996;167–214
16. Schmalbrock P, Monroe JW, Can high resolution steady state
MRI depict cochlea fluid motion? Presented at: Sixth Scientific