Original citation:
Hosseinzadeh, Elham, Barai, Anup, Marco, James and Jennings , Paul A. (2017) A comparative study on different cooling strategies for
lithium-ion battery cells. In: The European Battery, Hybrid and Fuel Cell Electric Vehicle Congress (EEVC 2017) , Geneva, 14-16 Mar 2017. Published in: The European Battery, Hybrid and Fuel Cell Electric Vehicle Congress (EEVC 2017) Proceedings pp. 1-9.
Permanent WRAP URL:
http://wrap.warwick.ac.uk/87136
Copyright and reuse:
The Warwick Research Archive Portal (WRAP) makes this work by researchers of the University of Warwick available open access under the following conditions. Copyright © and all moral rights to the version of the paper presented here belong to the individual author(s) and/or other copyright owners. To the extent reasonable and practicable the material made available in WRAP has been checked for eligibility before being made available.
Copies of full items can be used for personal research or study, educational, or not-for-profit purposes without prior permission or charge. Provided that the authors, title and full bibliographic details are credited, a hyperlink and/or URL is given for the original metadata page and the content is not changed in any way.
A note on versions:
The version presented in WRAP is the published version or, version of record, and may be cited as it appears here.
European Battery, Hybrid and Fuel Cell Electric Vehicle Congress
Geneva, 14
th- 16
thMarch 2017
A Comparative Study on Different Cooling Strategies for
Lithium-Ion Battery Cells
Elham Hosseinzadeh
1, Anup Barai
1, James Marco
1, Paul Jennings
11WMG-University of Warwick, Coventry, UK, e.hosseinzadeh@warwick.ac.uk
Abstract
In this study a 1D electrochemical-thermal model is coupled with a 3D thermal model in order to predict the
heat generation and corresponding temperature distribution in a battery cell. The developed model is verified
against experimental data for a 20 Ah lithium iron phosphate (LFP) which is operating at 20 °C ambient
temperature. The model is then adjusted to accommodate for 10Ah and 40 Ah cells by decreasing and
increasing the surface area of each cell as well as the tab dimensions. The temperature distribution of the
different cells are studied employing fin cooling as well as indirect liquid cooling system. Simulation results
highlight that the temperature gradient within the surface of the 40 Ah cell is almost 1.9 and 1.3 times that
of the 10 Ah and 20 Ah cells, respectively. Moreover, it is found that the fin cooling method by employing
aluminium plates between the cells is not a good choice when applied to large format batteries. Whereas, by
employing the indirect liquid cooling, a very uniform temperature along with low temperature gradient is
achieved even under high discharge rate. When the two cooling units have the same volume, the obtained
volumetric temperature gradient with fin cooling is equal to 20.5, 27.5 and 34.7 °C for the 10 Ah, 20 Ah and
40Ah respectively, whereas the corresponding value in case of the indirect cooling is 4.7, 5.2 and 6.2 °C
respectively.
Keywords: Lithium ion batteries, Thermal management, Electrochemical-thermal model, 3D modelling
1
Introduction
Lithium ion batteries have an optimum range of operating temperature (15-35 °C), within which they have the best performance [1], [2]. In addition, the temperature gradient of the battery in both the cell level and pack level should be kept lower than 5 °C to reduce the degradation rate[2-4]. Battery characteristics such as power and energy density, cycle life, reliability and cost are strongly affected by their operating temperature. Therefore, a proper thermal management system is required to ensure a safe operation as well as
prolonged lifetime. Designing a thermal
management system depends on many factors such as the size of the battery, operating conditions, energy capacity and power requirement of the pack as well as the pack configuration [5].
condensation within the battery pack resulting from uncontrolled humidity [6].
Common thermal management methods are air cooling [7-13], liquid cooling [5], [14] and fin cooling [1]. Heat pipe [3], [15-17] and phase change material (PCM) [18-20] are other alternatives for battery cooling. Generally active air cooling system consumes the most parasitic power among the other cooling methods [1]. It is applicable to battery systems with low heat generation per cell (𝑄𝑐𝑒𝑙𝑙< 10 𝑊) [5]. Moreover,
the capacity of the air cooling system is dependent on the ambient conditions, and it may cause a large non-uniform temperature distribution during aggressive drive cycles [21], [22]. Liquid cooling adds more cost, weight and complexity to the system compared to air cooled systems [23]. The cooling plate itself is expensive and it needs to be
properly designed. Moreover, auxiliary
components such as heat exchanger, pump and so on, adds weight and complexity to the system. On the other hand, it offers a higher cooling capacity which makes it desirable for electric vehicle application [17], [18]. The advantages of heat pipes over the other cooling methods are their high thermal conductivity, compact structure and flexible geometry [3]. However, the effectiveness of such cooling systems can still be greatly improved.
To design a thermal management system for electric vehicles (EV) or hybrid electric vehicles (HEV) the trade-off between efficiency, cost and weight should be considered. In order to evaluate the existing trade-off, fin cooling and indirect liquid cooling systems are employed and investigated for different cells individually. The objective is to identify the optimal design, in terms of temperature distribution, size and complexity of the cooling system. Hence, in this study primarily impact of battery dimensions, battery capacity, and their combined interplay on the overall heat generation and corresponding temperature distribution of a battery cell is investigated. Further, the thermal behavior of the three different cells, 10 Ah, 20 Ah and 40, employing fin cooling and indirect liquid cooling systems is studied and compared.
2
Methodology
The focus of this study is to find the optimal cell size for the battery pack considering the heat generation and temperature distribution, volume of the pack and design of the cooling system. To achieve the objectives of this study, in the first step a battery model is developed to predict the
heat generation as well as the temperature distribution of the cell. The model combines a 1D
electrochemical-thermal calculation for one
electrode pair with a 3D thermal calculation of a cell sequentially in order to capture the temperature distribution at the cell scale. In essence the 1D electrochemical-thermal model provides a heat
source (generated heat from a constant
charge/discharge cycle or a drive cycle) for the 3D thermal model in the cell level. The inputs to this model are current, capacity, geometrical design, material properties and ambient temperature, while the outputs are the responses of the cell to the current load, i.e. voltage, generated heat, temperature profile across the cell surface, state of charge and all other internal variables that are key for the successful operation and durability of the cell. The anode is made of graphite and the cathode material is lithium iron phosphate (LFP). The model is verified against experimental data for a 20Ah pouch cell which is operating at 20°C ambient temperature with different C-rates (1C,3C, 5C). The model is developed in a way that can be adjusted for different kind of cells with different chemistries, once the physical and thermal parameters of the cell are known. The battery cells in this study are 10 Ah, 20 Ah and 40 Ah LFP pouch cells. The batteries have similar electrochemical characteristics, such as electrode thickness, particle size, porosity, but they are different in surface area (Hcell× Wcell) and tab
width (Wtab), as shown in Fig. 1. The geometrical
[image:3.595.368.462.497.604.2]dimensions of different cases are summarised in Table 1.
Figure 1. Geometrical configuration of a LFP pouch cell.
Table 1. Physical dimensions of LFP pouch cells for different cases.
Cell (Ah)
𝐻𝑐𝑒𝑙𝑙
(mm)
𝑊𝑐𝑒𝑙𝑙
(mm)
𝑊𝑡𝑎𝑏
(mm)
𝐻𝑡𝑎𝑏
(mm)
Thickness (mm)
10 135 135 40 30 7.5
20 190 190 60 30 7.5
3
Results and discussion
3.1
Model Validation
A 1D electrochemical-thermal model is coupled with a 3D thermal model in order to predict the heat generation and corresponding temperature distribution in a battery cell. The model is validated against a 20 Ah LiFePO4 pouch cell subject to 1C, 3C and 5C continuous discharge conditions [24]. The cell is placed in a climate chamber at 20 ℃ while the two sides of the cell are exposed to the air. A free convection boundary condition with h value of (ℎ = 10 𝑊𝑚−2. 𝐾), is considered around the cell surface [24]. The surface temperature of the cell is measured by seven thermocouples place on both sides. The validation of the 3D thermal model is presented in Figure 2. The comparison is made for the maximum surface temperature obtained through the 3D model versus the measured temperature through the experiments for the 1C, 3C and 5C constant discharge rate. The peak error of the simulation results at 1C, 3C and 5C is equal to 10.6%, 10.2% and 10.4% respectively. The error can be attributed to the assumption of the constant h-value as well as inaccuracy of the temperature dependent electrochemical parameters.
Figure 2. Maximum cell surface temperature of the 20Ah LFP pouch cell at 20 °C, with natural cooling condition.
By operating the batteries under a constant 3C and 5C discharge rate at 20°C ambient temperature the following results are obtained. Table 2 summarises the average, maximum and minimum volumetric temperatures of the batteries at the end of 3C and 5C discharge along with the time averaged heat generation. The cells are fully insulated, meaning that there is no convective flux around the cells, and heat transfer coefficient is equal to zero (ℎ = 0).
Table 2. Heat generation and temperature profile of different cells – Reference Cases
Cell
(Ah)
𝑄𝑐𝑒𝑙𝑙
(W)
𝑇𝑎𝑣𝑒
(°C)
𝑇𝑚𝑎𝑥
(°C)
𝑇𝑚𝑖𝑛
(°C)
∆𝑇𝑠𝑢𝑟𝑓
(°C)
10 3C 7.5 49 49.1 48.8 32.15
5C 17.2 58.3 59.0 58.1 0.9
20 3C 15 49.4 50.1 49.1 1.0
5C 34.3 58.9 61.5 58.1 3.4
40 3C 29.9 49.8 52.4 49 3.4
5C 69.7 59.6 66.7 57.9 8.8
Employing Large format batteries lead to a more compact pack with less wiring and connections, so they are preferred from this point of view. On the other hand, they have a larger temperature gradient within the surface of the battery, which makes the thermal management very challenging, as displayed in Table 2. In this study, fin cooling and indirect liquid cooling systems are applied on the surface of the cells to identify the pros and cons of large format compared to small format batteries.
3.2
Fin Cooling
The primary cooling unit contains aluminium plates inserted between the cells which act as a heat sink. By imposing a constant temperature at the edge of the plates, 𝑇 = 20°𝐶, the following temperature profiles within the battery cells are achieved, as depicted in Figure 3(a,b,c).
[image:4.595.71.276.433.581.2]
(a) (b)
(c)
Figure 3. Temperature distribution of the batteries by applying fin cooling, inserting aluminium plates between the cells for, (a) 10 Ah, (b) 20 Ah, (c) 40 Ah battery cells.
Table 3. The average and maximum volumetric temperature as well as the temperature gradient values of the different cells at the end of 3C and 5C discharge, applying fin cooling, the thickness of the aluminium plate is (𝑡𝐴𝑙 = 1.5 𝑚𝑚).
Cell (Ah)
𝑇𝑎𝑣𝑒
(°C)
𝑇𝑚𝑎𝑥
(°C)
∆𝑇 (°C)
10 3C 29.1 31.2 12.1
5C 35.3 40.5 20.5
20 3C 32.9 37.3 17.3
5C 40.3 47.5 27.5
40 3C 36.4 42.9 22.9
5C 44.3 54.7 34.7
In order to decrease the temperature gradient of the cells a thicker aluminium plate with 𝑡𝐴𝑙 = 5 𝑚𝑚 was embedded between the cells. The simulation results are summarised in Table 4. By increasing the plate thickness from 1.5 to 5 mm, the temperature gradient of the 10 Ah, 20 Ah and 40 Ah reached to 9.6, 14.1 and 18.3 °C at the end of 5C discharge, whereas at the end of 3C
[image:5.595.71.267.84.393.2]discharge a temperature gradient of 5.3, 8.4, 11.9 °C was achieved.
Figure 4. The average volumetric temperature of the cells operating at 3C and 5C discharge rate at 20°C ambient temperature.
It is clear that the indirect cooling method by employing aluminium plates between the cells is not a good option when having large format batteries. However, another alternative, indirect liquid cooling is introduced in order to reduce the temperature gradient and to improve the thermal management of the batteries.
Table 4. The average and maximum volumetric temperature as well as the temperature gradient values of the different cells applying aluminium plates between the cells at the end of 3C and 5C discharge, the thickness of aluminium plate is (𝑡𝐴𝑙= 5 𝑚𝑚).
Cell (Ah)
𝑇𝑎𝑣𝑒
(°C)
𝑇𝑚𝑎𝑥
(°C)
∆𝑇 (°C)
10 3C 23.7 25.3 5.3
5C 26.7 29.6 9.6
20 3C 25.9 28.4 8.4
5C 30 34.1 14.1
40 3C 28.5 31.9 11.9
5C 33.3 38.3 18.3
3.3
Indirect Liquid Cooling
The second cooling method is indirect liquid cooling which comprises of aluminium cooling plates with embedded cooling channels. In order for the cooling methods to be comparable, both cooling units applied in this study have similar volume. The dimensions of the cooling plate is presented in Table 5. 𝑤𝑐ℎ is the width of one channel, ℎ𝑐ℎ represents the thickness of the channels, and 𝑡𝐴𝑙 is the thickness of Al plate at each side of the
[image:5.595.310.518.120.266.2] [image:5.595.309.527.464.567.2] [image:5.595.73.280.538.642.2]mixture as well as mineral oil were applied for cooling. The velocity range for water/Glycol mixture is 0.1-0.5 m/s to ensure a laminar flow regime approximation is valid.
Table 5. Dimensions of the cooling plates
𝑤𝑐ℎ
(mm)
ℎ𝑐ℎ
(mm) 𝑙𝑐ℎ
(m) 𝑡𝐴𝑙
(mm)
10 Ah 10 1 0.51 0.25
20 Ah 7 1 0.73 0.25
40 Ah 5 1 1.00 0.25
Figure 5 presents the volumetric temperature gradient (ΔT) of the 40 Ah cell during a constant 5C discharge. By increasing the flow rate from 0.1 m/s to 0.5 m/s, ΔT is reduced by 49%. However the decreased rate is not proportional with the flow speed. For example by increasing the velocity from 0.3 to 0.5 m/s, ΔT is only reduced by 14%. It indicates that the gained cooling effect at high flow rates is not significant, whereas the parasitic power consumption of the pump increases dramatically as stated by:
𝑃𝑝𝑢𝑚𝑝=∑𝑛 ∆𝑃𝑖𝑉𝑖
𝑖=1 (1)
where ∆𝑃𝑖 is the total pressure drop in one cooling
channel and 𝑖 indicates the number of channels. 𝑉𝑖
is the volumetric flow rate in the cooling channel. A similar trend is observed for volumetric temperature gradient of the 10 Ah and 20 Ah cell with different flow rates. For V=0.5 m/s the minimum ΔT at the end of discharge is approximately 6.2°C, whereas it can reduce to 5.1 and 4.7 for the 20 Ah and 10 Ah cells respectively. In case of applying mineral oil as coolant with velocity of 0.1 m/s, the ΔT of 15.3 °C is achieved at the end of 5C discharge, which is fairly high, almost twice of the gradient obtained through water mixture cooling. The limiting factor in case of oil cooling is the very high pressure drop in the channels. It means that even though the flow is within the laminar regime, the flow rate cannot increase any further because the power consumption of the pump dramatically increases as shown in Figure 6.
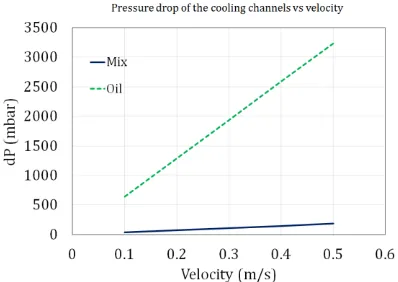
For identical flow rates, the pressure drop of the mineral oil is far more that of the water/glycol mixture. The difference is more pronounced as the flow rate increases. For example at V=0.1 m/s, ∆𝑃 of the mineral oil is 645 mbar whereas it is equal to 35 for the water/glycol mixture. While at V=0.5 m/s, ∆𝑃 is equal to 3233 mbar and 185 mbar for mineral oil and water/glycol mixture respectively.
It highlights that in order to have a more efficient oil cooling system, a higher number of channels in parallel is required in order to reduce the pressure drop.
Figure 5. Volumetric temperature gradient of a 40 Ah pouch cell operating under 5C discharge rate at 20°C ambient temperature.
Figure 6. Pressure drop of the water/glycol mixture versus mineral oil for different flow rates.
The volumetric temperature gradient of the cells under 3C constant discharge is shown in Figure 7. As seen ΔT profile for the 10 Ah and 20 Ah and 40 Ah cell over the discharge process is quite similar. The volumetric ΔT at the end of discharge for a 10 Ah, 20 Ah and 40 Ah is equal to 2.5, 2.7, 3.3 °C respectively, showing a linear progression versus capacity of the cell.
[image:6.595.86.265.165.244.2] [image:6.595.308.507.344.485.2]discharge it reaches to 2.6, 2.9 and 3.5 °C which is within the optimal range of the operating temperature. This proves the effectiveness of the indirect cooling channels with water/glycol mixture as the coolant.
[image:7.595.308.514.146.287.2]Figure 7. Volumetric temperature gradient of the 10 Ah, 20 Ah and 40 Ah cells during a 3C constant discharge rate at 20°C ambient temperature. The water/glycol velocity is equal to V=0.5 m/s for all the cases.
Figure 8. Volumetric average temperature of the 10 Ah, 20 Ah and 40 Ah cells over the time under 3C and 5C constant discharge at 20°C ambient temperature. The water/glycol velocity is equal to V=0.5 m/s for all the cases.
Similar study was conducted for a 40 Ah cell at 30 °C ambient temperature, as shown in Figure 9 and Figure 10. The inlet temperature of the coolant was set to both 20 °C and 30 °C. The time averaged heat generation of the cell at 20 °C and 30 °C under a constant 5C discharge is equal to 69.7 W and 51.7 W respectively. Under the 5C discharge, operating at 20 °C, the average temperature of 23.5 °C is achieved. At 30 °C, for 𝑇𝑐𝑜𝑜𝑙𝑎𝑛𝑡 = 20 °𝐶, the average temperature starts
to decrease from 30 °C to 21.4 °C until t=200 s, and then it starts increasing again until it reaches to 23.1 °C at the end of discharge. The lower temperature rise can be attributed to the lower
value of the heat generation at the higher ambient temperature. Even though the time averaged temperature for the two cases is not identical, but after 200s they follow the same trend.
Figure 9. Average volumetric temperature of the 40 Ah cell at 20 °C and 30 °C ambient temperature. The water/glycol velocity is equal to V=0.5 m/s for all the cases.
In case of cell operation at 30 °C ambient temperature, and for 𝑇𝑐𝑜𝑜𝑙𝑎𝑛𝑡= 30 °𝐶, the cell
operates at a higher temperature range, however the temperature rise is equal to 3.1°C, which is similar to the case with 𝑇𝑐𝑜𝑜𝑙𝑎𝑛𝑡= 20 °𝐶. Comparing the
temperature gradient under different temperature conditions it is observed that, ΔT of the cell at the end of discharge under 20 °𝐶 ambient temperature is 6.2 °𝐶, whereas it is slightly lower at 30 °𝐶 ambient temperature, which is 5.7 °𝐶 and 5.6 °𝐶, for 𝑇𝑐𝑜𝑜𝑙𝑎𝑛𝑡 = 20 °𝐶 and 𝑇𝑐𝑜𝑜𝑙𝑎𝑛𝑡= 30 °𝐶,
respectively.
The temperature distribution of the 40 Ah cell at the end of 5C discharge is presented in Figure 11. It is seen that the temperature profile of the cell across the surface is quite uniform with the approximate temperature gradient of 2°C whereas the temperature gradient through the thickness of the cell is much higher, as shown in Figure 12(a,b).(a)
(b)
[image:7.595.72.273.158.297.2] [image:7.595.71.270.380.518.2]cannot be reduced much due to the low through-plane thermal conductivity of the cell.
[image:8.595.71.275.123.262.2]Figure 10. Volumetric temperature gradient of the 40 Ah cell at 20 °C and 30 °C ambient temperature under 5C discharge. The water/glycol velocity is equal to V=0.5 m/s for all the cases.
Figure 11. Temperature distribution of a 40 Ah cell at the end of 5C discharge at 20°C ambient temperature with water/glycol mixture coolant, V=0.5 m/s.
(a) (b)
Figure 12. Temperature distribution of a 40 Ah cell through the cell thickness at the end of 5C discharge at 20°C ambient temperature, (a) with no cooling, (b) with water/glycol mixture coolant, V=0.5 m/s.
4
Conclusion
This study indicates impact of cell size on the heat generation and temperature distribution of the cell, which has a high influence on the battery aging. Large format batteries have high packing efficiency, but on the other hand they have a large temperature gradient, which is the main concern for their application. Having such a temperature gradient requires a more complex cooling design. On the other hand, having small capacity batteries leads to a large number of cells in a pack while it benefits from a simple cooling design.
In this study an electrochemical-thermal model was
developed to investigate the temperature
distribution of a 10 Ah, 20 Ah and 40 Ah LFP pouch cell applying two cooling strategies: fin cooling and indirect liquid cooling. The simulation results show that the aluminium plate is not an effective cooling method when having large format cells. Even though it can reduce the average temperature of the cells, it is unable to decrease the temperature gradient of the cells effectively. For the 10 Ah, operating under 3C, with 𝑡𝐴𝑙 = 1.5 𝑚𝑚 and 𝑡𝐴𝑙= 5 𝑚𝑚, the temperature gradient of the cell decreased to 12 °C and 5 °C respectively. However, inserting a 5 𝑚𝑚 plate between each two cells adds extra weight to the system which is not desirable. But for 𝑡𝐴𝑙= 1.5 𝑚𝑚 by modifying the fin design,
there is a potential for effective cooling of the 10 Ah cell operating under 3C, which is the case in most vehicle application.
The second approach involved employing an indirect liquid cooling method, with a total plate thickness of 1.5 𝑚𝑚. Water/glycol mixture and mineral oil were applied as the coolants. The simulation results shows that both the temperature gradient and average temperature of the battery reduced significantly applying the water glycol mixture whereas the mineral oil indicated a larger
temperature gradient and higher average
temperature. Moreover, the pressure drop of the mineral oil in a cooling channel was significantly higher than that of the water/glycol mixture, which means a higher parasitic power is required in case of oil cooling.
[image:8.595.123.228.342.458.2] [image:8.595.138.249.538.668.2]difficult to reach a temperature gradient of below 5°C, no matter how efficient a cooling system is.
Acknowledgments
The research within this paper is undertaken as a part of ELEVATE (EP/M009394/1) and APC
Spoke Institutional Sponsorship projects
(EP/P511432/1) funded by the Engineering and Physical Science Research Council (EPSRC).
References
[1] D. Chen, J. Jiang, G. H. Kim, C. Yang, and A. Pesaran, Comparison of different cooling methods for lithium ion battery cells, Journal of Applied Thermal Engineering, 94(2016), 846–854
[2] A. Greco, X. Jiang, and D. Cao, An investigation of lithium-ion battery thermal management using paraffin/porous-graphite-matrix composite, Journal of Power Sources, 278(2015), 50–68
[3] R. Zhao, J. Gu, and J. Liu, An experimental study of heat pipe thermal management system with wet cooling method for lithium ion batteries, Journal of Power Sources, 273(2015), 1089–1097
[4] A. A. Pesaran, Battery thermal models for hybrid vehicle simulations, Journal of Power Sources, 110(2002), 377–382
[5] H. Teng and K. Yeow, Design of Direct and Indirect Liquid Cooling Systems for High- Capacity, High-Power Lithium-Ion Battery Packs, SAE Tech-2012.
[6] G. Karimi and X. Li, Thermal management of lithium-ion batteries for electric vehicles, International Journal of Energy Research, 37(2013), 13-24
[7] A. A. Pesaran, S. Burch, and M. Keyser, An approach for designing thermal management systems for electric and hybrid vehicle battery packs, The Fourth Vehicle Thermal Management Systems Conference and Exhibition, 1999
[8] N. Yang, X. Zhang, G. Li, and D. Hua,
Assessment of the forced air-cooling performance for cylindrical lithium-ion battery packs: A comparative analysis between aligned and staggered cell arrangements, Journal of Applied Thermal Engineering, 80(2015), 55–65
[9] L. Fan, J. M. Khodadadi, and A. A. Pesaran,
A parametric study on thermal management of an air-cooled lithium-ion battery module
for plug-in hybrid electric vehicles, Journal of Power Sources, 238(2013), 301–312
[10] T. Wang, K. J. Tseng, J. Zhao, and Z. Wei,
Thermal investigation of lithium-ion battery module with different cell arrangement structures and forced air-cooling strategies, Journal of Applied Energy, 134(2014), 229– 238
[11] Y. Ma, H. Teng, and M. Thelliez,
Electro-Thermal Modeling of a Lithium-ion Battery System, 3(2016), 306–317
[12] T. Wang, K. J. Tseng, and J. Zhao,
Development of efficient air-coolingstrategies for lithium-ion battery module based on empirical heat source model, Journal of Appllied Thermal Engineering, 90(2015), 521–529
[13] D. C. Erb, I. M. Ehrenberg, S. E. Sarma, and E. Carlson, Effects of cell geometry on thermal management in air-cooled battery packs, IEEE-2015
[14] W. Tong, K. Somasundaram, E. Birgersson, A. S. Mujumdar, and C. Yap, Numerical investigation of water cooling for a lithium-ion bipolar battery pack, International Journal of Thermal Sciences, 94(2015), 259–269 [15] Y. Ye, L. H. Saw, Y. Shi, and A. A. O. Tay,
Numerical analyses on optimizing a heat pipe thermal management system for lithium-ion batteries during fast charging, Journal of Applied Thermal Engineering, 86(2015), 281– 291
[16] Q. Wang, B. Jiang, Q. F. Xue, H. L. Sun, B. Li, H. M. Zou, and Y. Y. Yan, Experimental investigation on EV battery cooling and heating by heat pipes, Journal of Applied Thermal Engineering, 88(2014), 54–60 [17] T. H. Tran, S. Harmand, B. Desmet, and S.
Filangi, Experimental investigation on the feasibility of heat pipe cooling for HEV/EV lithium-ion battery, Journal of Applied Thermal Engineering, 63(2014), 551–558 [18] R. Sabbah, R. Kizilel, J. R. Selman, and S.
Al-Hallaj, Active (air-cooled) vs. passive (phase change material) thermal management of high power lithium-ion packs: Limitation of temperature rise and uniformity of temperature distribution, Journal of Power Sources, 182(2008), 630–638
[20] Z. Rao, Q. Wang, and C. Huang,
Investigation of the thermal performance of phase change material/mini-channel coupled battery thermal management system, Journal of Applied Energy, 164(2016), 659–669
[21] Z. Rao and S. Wang, A review of power battery thermal energy management, Renewable and Sustainable Energy Reviews., 15(2011), 4554–4571
[22] T. M. Bandhauer, S. Garimella, and T. F. Fuller, A Critical Review of Thermal Issues in Lithium-Ion Batteries, Journal of Electrochemical Society, 158(2011), R1-R25
[23] A. Pesaran, Battery Thermal Management in EVs and HEVs : Issues and Solutions, Advanced Automotive Battery Conference, 2001.
[24] D. Worwood, E. Hosseinzadeh, K. Q, J. Marco, D. Greenwood, M. R, W. . Widanage, A. Barai, and P. Jennings, Thermal analysis of a lithium-ion pouch cell under aggressive automotive duty cycles with minimal cooling, IET Hybrid Electr. Veh. Conf., HEVC-2016.
Authors
Dr Elham Hosseinzadeh received her PhD in Feb 2013 from Technical University of Denmark (DTU), with focus on “Modelling and Design of Hybrid PEM Fuel Cell Systems for Lift Trucks”. After completion of her PhD, she worked for IRD Fuel cell company as a Research Engineer for a couple of years. She has joined Warwick Manufacturing Group (WMG) as a research fellow in Jan 2016. She is currently working on electrochemical modelling of lithium ion batteries as well as battery thermal management.
Dr Anup Barai has a PhD degree from University of Warwick, a First-Class MSc degree in Embedded Systems Design and a BSc (Honours) degree in Electrical and Electronic Engineering. Anup has been working at WMG since 2011, currently as a research fellow. Since joining WMG Anup has delivered research which has tangible impact on industrial and academic
researcher's success, making
fundamental changes in the way energy storage systems are characterised.
Dr James Marco is a Chartered Engineer and a member of the Institution of Engineering and Technology (MIET). After graduating with an Engineering Doctorate from Warwick in 2000, he worked for several years within the automotive industry. Research interests include systems engineering, real-time control, systems modelling, design optimisation and the design of battery management and energy management control systems.