http://wrap.warwick.ac.uk/
angle γ. Physics Letters B, Volume 718 (Number 1). pp. 43-55.
Permanent WRAP url:
http://wrap.warwick.ac.uk/52198
Copyright and reuse:
The Warwick Research Archive Portal (WRAP) makes this work of researchers of the
University of Warwick available open access under the following conditions.
This article is made available under the Creative Commons Attribution- 3.0 Unported
(CC BY 3.0) license and may be reused according to the conditions of the license. For
more details see
http://creativecommons.org/licenses/by/3.0/
A note on versions:
The version presented in WRAP is the published version, or, version of record, and may
be cited as it appears here.
Contents lists available atSciVerse ScienceDirect
Physics Letters B
www.elsevier.com/locate/physletb
A model-independent Dalitz plot analysis of
B
±
→
D K
±
with
D
→
K
S
0
h
+
h
−
(
h
=
π
,
K
) decays and constraints on the CKM angle
γ
✩
.
LHCb Collaboration
a r t i c l e
i n f o
a b s t r a c t
Article history:
Received 27 September 2012 Accepted 5 October 2012 Available online 9 October 2012 Editor: L. Rolandi
A binned Dalitz plot analysis of B±→D K± decays, with D→K0S
π
+π
− and D →KS0K+K−, is performed to measure theCP-violating observablesx±and y±which are sensitive to the CKM angleγ
. The analysis exploits 1.0 fb−1 of data collected by the LHCb experiment. The study makes nomodel-based assumption on the variation of the strong phase of the D decay amplitude over the Dalitz plot, but uses measurements of this quantity from CLEO-c as input. The values of the parameters are found to bex−=(0.0±4.3±1.5±0.6)×10−2,y
−=(2.7±5.2±0.8±2.3)×10−2,x
+=(−10.3±4.5±1.8± 1.4)×10−2and y
+=(−0.9±3.7±0.8±3.0)×10−2. The first, second, and third uncertainties are the
statistical, the experimental systematic, and the error associated with the precision of the strong-phase parameters measured at CLEO-c, respectively. These results correspond to
γ
=(44+−4338)◦, with a second solution atγ
→γ
+180◦, and rB=0.07±0.04, whererB is the ratio between the suppressed andfavouredBdecay amplitudes.
©2012 CERN. Published by Elsevier B.V. All rights reserved.
1. Introduction
A precise determination of the Unitarity Triangle angle
γ
(also denoted asφ
3), is an important goal in flavour physics.Measure-ments of this weak phase in tree-level processes involving the in-terference betweenb
→
cus¯
andb→
ucs¯
transitions are expected to be insensitive to new physics contributions, thereby providing a Standard Model benchmark against which other observables, more likely to be affected by new physics, can be compared. A powerful approach for measuringγ
is to study CP-violating observables in B±→
D K±decays, whereD designates a neutralDmeson recon-structed in a final state common to both D0 and D¯
0 decays.Ex-amples of such final states include two-body modes, where LHCb has already presented results[1], and selfCP-conjugate three-body decays, such asK0
S
π
+π
−andKS0K+K−, designated collectively asK0 Sh+h−.
The proposal to measure
γ
with B±→
D K±, D→
KS0h+h− decays was first made in Refs.[2,3]. The strategy relies on com-paring the distribution of events in the D→
K0Sh+h− Dalitz plot
forB+
→
D K+ and B−→
D K− decays. However, in order to de-termineγ
it is necessary to know how the strong phase of the D decay varies over the Dalitz plot. One approach for solving this problem, adopted by BaBar[4–6]and Belle[7–9], is to use an am-plitude model fitted on flavour-taggedD→
KS0h+h−decays to pro-vide this input. An attractive alternative[2,10,11]is to make use of direct measurements of the strong-phase behaviour in bins of the✩ © CERN for the benefit of the LHCb Collaboration.
Dalitz plot, which can be obtained from quantum-correlated DD
¯
pairs fromψ(3770)
decays and that are available from CLEO-c[12], thereby avoiding the need to assign any model-related systematic uncertainty. A first model-independent analysis was recently pre-sented by Belle [13] using B±→
D K±, D→
K0S
π
+π
− decays. Inthis Letter,ppcollision data at
√
s=
7 TeV, corresponding to an in-tegrated luminosity of 1.0 fb−1 and accumulated by LHCb in 2011, are exploited to perform a similar model-independent study of the decay mode B±→
D K± withD→
KS0π
+π
− andD→
KS0K+K−. The results are used to set constraints on the value ofγ
.2. Formalism and external inputs
The amplitude of the decay B+
→
D K+, D→
K0Sh+h− can be
written as the superposition of the B+
→ ¯
D0K+ andB+→
D0K+ contributions asAB
m2+
,
m2−= ¯
A+
rBei(δB+γ)A.
(1)Here m2
+ andm2− are the invariant masses squared of the KS0h+
and KS0h− combinations, respectively, that define the position of the decay in the Dalitz plot, A
=
A(m2+,
m2−)
is theD0→
KS0h+h− amplitude, and A¯
= ¯
A(m2+,
m2−)
the D¯
0→
KS0h+h−amplitude. The parameter rB, the ratio of the magnitudes of the B+→
D0K+and B+
→ ¯
D0K+ amplitudes, is∼
0.1 [14], andδ
B is the
strong-phase difference between them. The equivalent expression for the charge-conjugated decay B−
→
D K− is obtained by making the substitutionsγ
→ −
γ
and A↔ ¯
A. NeglectingCPviolation, which is known to be small in D0− ¯
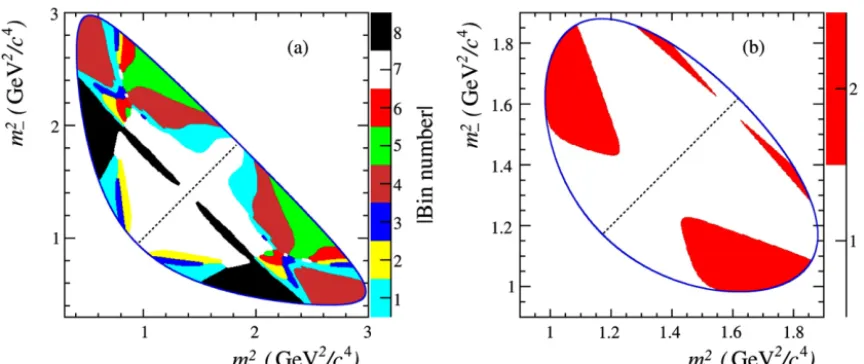
D0 mixing and Cabibbo-favouredFig. 1.Binning choices for (a)D→K0
Sπ+π−and (b)D→K 0
SK+K−. The diagonal line separates the positive and negative bins.
D meson decays [15], the conjugate amplitudes are related by A(m2
+
,
m2−)
= ¯
A(m2−,
m2+).
Following the formalism set out in Ref.[2], the Dalitz plot is partitioned into 2N regions symmetric under the exchangem2+
↔
m2−. The bins are labelled from
−
N to+
N (excluding zero), where the positive bins satisfy m2−>
m2+. At each point in the Dalitz plot, there is a strong-phase differenceδ
D(m
2+,
m−2)
=
argA¯
−
argAbetween theD
¯
0 andD0 decay. The cosine of the strong-phase dif-ference averaged in each bin and weighted by the absolute decay rate is termedciand is given byci
=
Di
(
|
A|| ¯
A|
cosδ
D)
dD
Di
|
A|
2dD
Di
| ¯
A|
2dD
,
(2)where the integrals are evaluated over the area
D
of bin i. An analogous expression may be written forsi, which is the sine ofthe strong-phase difference within bin i, weighted by the decay rate. The values of ci and si can be determined by assuming a
functional form for
|
A|
,| ¯
A|
andδ
D, which may be obtained froman amplitude model fitted to flavour-tagged D0 decays.
Alterna-tively direct measurements of ci and si can be used. Such
mea-surements have been performed at CLEO-c, exploiting quantum-correlated DD
¯
pairs produced at theψ(3770)
resonance. This has been done with a double-tagged method in which one D meson is reconstructed in a decay to eitherK0Sh+h−or KL0h+h−, and the other D meson is reconstructed either in a CP eigenstate or in a decay toK0Sh+h−. The efficiency-corrected event yields, combined
with flavour-tag information, allowci andsi to be determined[2, 10,11]. The latter approach is attractive as it avoids any assumption about the nature of the intermediate resonances which contribute to the KS0h+h−final state; such an assumption leads to a system-atic uncertainty associated with the variation in
δ
D that is difficultto quantify. Instead, an uncertainty is assigned that is related to the precision of theciandsimeasurements.
The population of each positive (negative) bin in the Dalitz plot arising from B+ decays isN++i (N+−i), and that from B− decays is N+−i (N−−i). From Eq.(1)it follows that
N+±i
=
hB+K∓i
+
x2+
+
y2+K±i+
2KiK−i
(
x+c±i∓
y+s±i)
,
N−±i
=
hB−K±i
+
x2−
+
y2−K∓i+
2KiK−i
(
x−c±i±
y−s±i)
,
(3)
where hB± are normalisation factors which can, in principle, be
different for B+ andB− due to the production asymmetries, and
Kiis the number of events in biniof the decay of a flavour-tagged
D0
→
K0Sh+h−Dalitz plot. The sensitivity to
γ
enters through theCartesian parameters
x±
=
rBcos(δ
B±
γ
)
and y±=
rBsin(δ
B±
γ
).
(4)In this analysis the observed distribution of candidates over the D
→
KS0h+h− Dalitz plot is used to fit x±, y± andhB±. Thepa-rameters ci and si are taken from measurements performed by
CLEO-c [12]. In this manner the analysis avoids any dependence on an amplitude model to describe the variation of the strong phase over the Dalitz plot. A model is used, however, to provide the input values for Ki. For the D0
→
KS0π
+π
− decay the modelis taken from Ref.[5]and for theD0
→
KS0K+K−decay the model is taken from Ref. [6]. This choice incurs no significant systematic uncertainty as the models have been shown to describe well the intensity distribution of flavour-tagged D0 decay data.The effect ofD0
− ¯
D0mixing is ignored in the above discussion, and was neglected in the CLEO-c measurements ofciandsias wellas in the construction of the amplitude model used to calculate Ki.
This leads to a bias of the order of 0.2◦in the
γ
determination[16]which is negligible for the current analysis.
The CLEO-c study segments theK0S
π
+π
− Dalitz plot into 2×
8 bins. Several bin definitions are available. Here the ‘optimal bin-ning’ variant is adopted. In this scheme the bins have been chosen to optimise the statistical sensitivity toγ
in the presence of a low level of background, which is appropriate for this analysis. The op-timisation has been performed assuming a strong-phase difference distribution as predicted by the BaBar model presented in Ref.[5]. The use of a specific model in defining the bin boundaries does not bias the ci and si measurements. If the model is a poorde-scription of the underlying decay the only consequence will be to reduce the statistical sensitivity of the
γ
measurement.For the KS0K+K− final stateci andsi measurements are
avail-able for the Dalitz plot partitioned into 2
×
2, 2×
3 and 2×
4 bins, with the guiding model being that from the BaBar study described in Ref.[6]. The bin boundaries divide the Dalitz plot into bins of equal size with respect to the strong-phase difference between the D0 andD¯
0 amplitudes. The current analysis adopts the 2×
2op-tion, a decision driven by the size of the signal sample. The binning choices for the two decay modes are shown inFig. 1.
3. The LHCb detector
a high precision tracking system consisting of a silicon-strip ver-tex detector surrounding the pp interaction region, a large-area silicon-strip detector (VELO) located upstream of a dipole magnet with a bending power of about 4 Tm, and three stations of silicon-strip detectors and straw drift-tubes placed downstream. The com-bined tracking system has a momentum resolution of (0.4–0.6)% in the range of 5–100 GeV/c, and an impact parameter (IP) resolu-tion of 20 μm for tracks with high transverse momentum (pT).
The dipole magnet can be operated in either polarity and this feature is used to reduce systematic effects due to detector asym-metries. In the data set considered in this analysis, 58% of data were taken with one polarity and 42% with the other. Charged hadrons are identified using two ring-imaging Cherenkov (RICH) detectors. Photon, electron and hadron candidates are identified by a calorimeter system consisting of scintillating-pad and preshower detectors, an electromagnetic calorimeter and a hadronic calorime-ter. Muons are identified by a system composed of alternating layers of iron and multiwire proportional chambers.
A two-stage trigger is employed. First a hardware-based deci-sion is taken at a frequency up to 40 MHz. It accepts high trans-verse energy clusters in either the electromagnetic calorimeter or hadron calorimeter, or a muon of high pT. For this analysis, it is
required that one of the charged final-state tracks forming theB± candidate points at a deposit in the hadron calorimeter, or that the hardware-trigger decision was taken independently of these tracks. A second trigger level, implemented in software, receives 1 MHz of events and retains
∼
0.3% of them [18]. It searches for a track with largepTand large IP with respect to anyppinteraction pointwhich is called a primary vertex (PV). This track is then required to be part of a two-, three- or four-track secondary vertex with a highpTsum, significantly displaced from any PV. In order to
max-imise efficiency at an acceptable trigger rate, the displaced vertex is selected with a decision tree algorithm that usespT, impact
pa-rameter, flight distance and track separation information. Full event reconstruction occurs offline, and a loose preselection is applied.
Approximately three million simulated events for each of the modes B±
→
D(KS0π
+π
−)K
± and B±→
D(KS0π
+π
−)
π
±, and one million simulated events for each of B±→
D(KS0K+K−)K
± and B±→
D(KS0K+K−)
π
± are used in the analysis, as well as a large inclusive sample of generic B→
D X decays for back-ground studies. These samples are generated using a version ofPythia6.4[19]tuned to model the ppcollisions[20].EvtGen[21]
encodes the particle decays in which final state radiation is gener-ated usingPhotos[22]. The interaction of the generated particles
with the detector and its response are implemented using the
Geant4 toolkit[23]as described in Ref.[24].
4. Event selection and invariant mass spectrum fit
Selection requirements are applied to isolate both B±
→
D K± and B±→
Dπ
± candidates, with D→
KS0h+h−. Candidates se-lected in the Cabibbo-favoured B±→
Dπ
± decay mode provide an important control sample which is exploited in the analysis.A production vertex is assigned to eachBcandidate. This is the PV for which the reconstructed B trajectory has the smallest IP
χ
2, where this quantity is defined as the difference in theχ
2 fitof the PV with and without the tracks of the considered particle. TheK0S candidates are formed from two oppositely charged tracks reconstructed in the tracking stations, either with associated hits in the VELO detector (longK0
S candidate) or without (downstream
K0S candidate). The IP
χ
2 with respect to the PV of each of thelong (downstream) KS0 daughters is required to be greater than 16 (4). The angle
θ
between theKS0 candidate momentum and the vector between the decay vertex and the PV, expected to be smallgiven the high momentum of the B meson, is required to satisfy cos
θ >
0.99, reducing background from combinations of random tracks.The D meson candidates are reconstructed by combining the long (downstream) KS0 candidates with two oppositely charged tracks for which the values of the IP
χ
2 with respect to the PVare greater than 9 (16). In the case of the D
→
K0SK+K−a loose
particle identification (PID) requirement is placed on the kaons to reduce combinatoric backgrounds. The IP
χ
2 of the candidateD with respect to any PV is demanded to be greater than 9 in order to suppress directly produced D mesons, and the angle
θ
between the D candidate momentum and the vector between the decay and PV is required to satisfy the same criterion as for the KS0 selection (cosθ >
0.99). The invariant mass resolution of the signal is 8.7 MeV/c2 (11.9 MeV/c2) for D mesons reconstructedwith long (downstream) KS0candidates, and a common window of
±
25 MeV/c2 is imposed around the world average D0 mass[15]. The K0S mass is determined after the addition of a constraint that
the invariant mass of the two D daughter pions or kaons and the two KS0 daughter pions have the world average D mass. The invariant mass resolution is 2.9 MeV/c2 (4.8 MeV/c2) for long
(downstream) KS0 decays. Candidates are retained for which the invariant mass of the two KS0 daughters lies within
±
15 MeV/c2 of the world average KS0 mass[15].The Dmeson is combined with a candidate kaon or pion bach-elor particle to form the B candidate. The IP
χ
2 of the bachelorwith respect to the PV is required to be greater than 25. In or-der to ensure good discrimination between pions and kaons in the RICH system only tracks with momentum less than 100 GeV/care considered. The bachelor is considered as a candidate kaon (pion) according to whether it passes (fails) a cut placed on the output of the RICH PID algorithm. The PID information is quantified as a difference between the logarithm of the likelihood under the mass hypothesis of a pion or a kaon. Criteria are then imposed on the B candidate: that the angle between its momentum and the vec-tor between the decay and the PV should have a cosine greater than 0.9999 for candidates containing longKS0 decays (0.99995 for downstream KS0 decays); that theB vertex-separation
χ
2 withre-spect to its PV is greater than 169; and that the B IP
χ
2 withrespect to the PV is less than 9. To suppress background from charmless B decays it is required that the D vertex lies down-stream of the B vertex. In the events with a long KS0 candidate, a further background arises from B±
→
Dh±, D→
π
+π
−h+h− decays, where the two pions are reconstructed as a long KS0 can-didate. This background is removed by requiring that the flight significance between the D andK0S vertices is greater than 10.
In order to obtain the best possible resolution in the Dalitz plot of theDdecay, and to provide further background suppression, the B,D andK0
S vertices are refitted with additional constraints on the
D andKS0masses, and theB momentum is required to point back to the PV. The
χ
2 per degree of freedom of the fit is required tobe less than 5.
Less than 0.4% of the selected events are found to contain two or more candidates. In these events only the Bcandidate with the lowest
χ
2per degree of freedom from the refit is retained forsub-sequent study. In addition, 0.4% of the candidates are found to have been reconstructed such that their D Dalitz plot coordinates lie outside the defined bins, and these too are discarded.
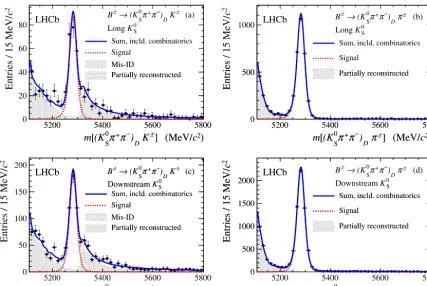
The invariant mass distributions of the selected candidates are shown in Fig. 2 for B±
→
D K± and B±→
Dπ
±, with D→
K0S
π
+π
− decays, divided between the long and downstream KS0Fig. 2.Invariant mass distributions of (a, c)B±→D K±and (b, d)B±→Dπ±candidates, withD→K0
Sπ+π−, divided between the (a, b) long and (c, d) downstreamK 0 S
categories. Fit results, including the signal and background components, are superimposed.
Fig. 3.Invariant mass distributions of (a)B±→D K±and (b)B±→Dπ±candidates, withD→K0SK+K−, shown with bothK 0
S categories combined. Fit results, including
the signal and background components, are superimposed.
fit to these distributions is superimposed. The fit is performed simultaneously for B±
→
D K± and B±→
Dπ
±, including both D→
K0S
π
+π
−andD→
KS0K+K−decays, allowing severalparam-eters to be different for long and downstream KS0 categories. The fit range is between 5110 MeV/c2 and 5800 MeV/c2 in invariant mass. At this stage in the analysis the fit does not distinguish be-tween the different regions of Dalitz plot orB meson charge. The purpose of this global fit is to determine the parameters that de-scribe the invariant mass spectrum in preparation for the binned fit described in Section5.
The signal probability density function (PDF) is a Gaussian func-tion with asymmetric tails where the unnormalised form is given by
f
(
m;
m0,
α
L,
α
R,
σ
)
=
exp[−
(
m−
m0)
2/(
2σ
2+
α
L(
m−
m0)
2)
]
,
m<
m0;
exp[−
(
m−
m0)
2/(
2σ
2+
α
R(
m−
m0)
2)
]
,
m>
m0;
(5)
where m is the candidate mass, m0 the B mass and
σ
,α
L, andα
R are free parameters in the fit. The parameter m0 is taken ascommon for all classes of signal. The parameters describing the asymmetric tails are fitted separately for events with long and downstream KS0 categories. The resolution of the Gaussian func-tion is left as a free parameter for the two K0
S categories, but
the ratio between this resolution in B±
→
D K± and B±→
Dπ
±decays is required to be the same, independent of category. The resolution is determined to be around 15 MeV/c2 forB±
→
Dπ
±decays of both K0
S classes, and is smaller by a factor 0.95
±
0.06for B±
→
D K±. The yield of B±→
Dπ
± candidates in each cat-egory is determined in the fit. Instead of fitting the yield of the B±→
D K± candidates separately, the ratioR
=
N(B
±→
D K±)/N(B
±→
Dπ
±)
is a free parameter and is common across all categories. [image:5.612.81.508.388.527.2]Table 1
Yields and statistical uncertainties in the signal region from the invariant mass fit, scaled from the full fit mass range, for candidates passing the B±→Dh±,D→K0
Sπ+π−selection. Values are shown separately for candidates containing long and downstreamKS0decays. The signal region is
between 5247 MeV/c2and 5317 MeV/c2and the full fit range is between 5110 MeV/c2and 5800 MeV/c2.
Fit component B±→D K±selection B±→Dπ±selection
Long Downstream Long Downstream
B±→D K± 213±13 441±25 – –
B±→Dπ± 11±3 22±5 2809±56 5755±82
Combinatoric 9±4 29±6 22±3 90±7
[image:6.612.82.523.229.290.2]Partially reconstructed 11±1 25±2 25±1 55±1
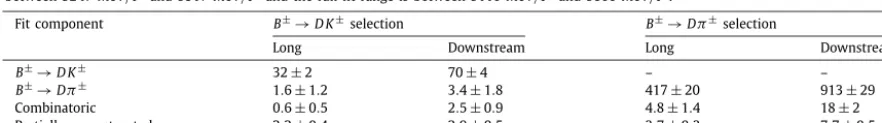
Table 2
Yields and statistical uncertainties in the signal region from the invariant mass fit, scaled from the full fit mass range, for candidates passing the B±→Dh±,D→K0
SK+K−selection. Values are shown separately for candidates containing long and downstreamKS0decays. The signal region is
between 5247 MeV/c2and 5317 MeV
/c2and the full fit range is between 5110 MeV
/c2and 5800 MeV
/c2.
Fit component B±→D K±selection B±→Dπ±selection
Long Downstream Long Downstream
B±→D K± 32±2 70±4 – –
B±→Dπ± 1.6±1.2 3.4±1.8 417±20 913±29 Combinatoric 0.6±0.5 2.5±0.9 4.8±1.4 18±2 Partially reconstructed 2.2±0.4 2.9±0.5 3.7±0.3 7.7±0.5
floated separately for each class of decay. Partially reconstructed backgrounds are described empirically. Studies of simulated events show that the partially reconstructed backgrounds are dominated by decays that involve aD meson decaying to K0
Sh+h−. Therefore
the same PDF is used to describe these backgrounds as used in a similar analysis of B±
→
D K± decays, with D→
K±π
∓, K+K− andπ
+π
− [1]. In that analysis the shape was constructed by ap-plying the selection to a large simulated sample containing many common backgrounds, each weighted by its production rate and branching fraction. The invariant mass distribution for the surviv-ing candidates was corrected to account for small differences in resolution and PID performance between data and simulation, and two background PDFs were extracted by kernel estimation [25]; one forB±→
D K± and one for B±→
Dπ
±decays. The partially reconstructed background PDFs are found to give a good descrip-tion of bothK0S categories.
An additional and significant background component exists in the B±
→
D K± sample, arising from the dominant B±→
Dπ
±decay on those occasions where the bachelor particle is misiden-tified as a kaon by the RICH system. In contrast, the B±
→
D K± contamination in the B±→
Dπ
± sample can be neglected. The size of this background is calculated through knowledge of PID and misidentification efficiencies, which are obtained from large sam-ples of kinematically selected D∗±→
Dπ
±, D→
K∓π
± decays. The kinematic properties of the particles in the calibration sam-ple are reweighted to match those of the bachelor particles in the B decay sample, thereby ensuring that the measured PID perfor-mance is representative of that in the B decay sample. The effi-ciency to identify a kaon correctly is found to be around 86%, and that for a pion to be around 96%. The misidentification efficien-cies are the complements of these numbers. From this information and from knowledge of the number of reconstructed B±→
Dπ
±decays, the amount of this background surviving the B±
→
D K± selection can be determined. The invariant mass distribution of the misidentified candidates is described by a Crystal Ball function[26]with the tail on the high mass side, the parameters of which are fitted in common between all theB±
→
D K±samples.The number of B±
→
D K± candidates in all categories is de-termined byR
, and the number of B±→
Dπ
± events in the corresponding category. The ratioR
is determined in the fit and measured to be 0.085±
0.005 (statistical uncertainty only) and is consistent with that observed in Ref.[1]. The yields returned bythe invariant mass fit in the full fit region are scaled to the sig-nal region, defined as 5247–5317 MeV/c2, and are presented in
Tables 1 and 2 for the D
→
K0Sπ
+π
− and D→
KS0K+K− selec-tions respectively. In the B±→
D(K0S
π
+π
−)K
± sample there are654
±
28 signal candidates, with a purity of 86%. The correspond-ing numbers for the B±→
D(K
0SK+K−)K
± sample are 102±
5 and 88%, respectively. The contamination in the B±→
D K± selec-tion receives approximately equal contribuselec-tions from misidentified B±→
Dπ
± decays, combinatoric background and partially recon-structed decays. The partially reconrecon-structed component in the sig-nal region is dominated by decays of the type B→
Dρ
, in which a charged pion from theρ
decay is misidentified as the bachelor kaon, andB±→
D∗π
±, again with a misidentified pion.The Dalitz plots forB±
→
D K±data in the signal region for the two D→
KS0h+h− final states are shown in Fig. 4. Separate plots are shown for B+andB−decays.5. Binned Dalitz fit
The purpose of the binned Dalitz plot fit is to measure the CP-violating parameters x± and y±, as introduced in Section 2. Following Eq. (3) these parameters can be determined from the populations of each B±
→
D K± Dalitz plot bin given the external information that is available for theci,siandKiparameters. Inor-der to know the signal population in each bin it is necessary both to subtract background and to correct for acceptance losses from the trigger, reconstruction and selection.
Although the absolute numbers ofB+andB−decays integrated over the Dalitz plot have some dependence onx±andy±, the ad-ditional sensitivity gained compared to using just the relative bin-to-bin yields is negligible, and is therefore not used. Consequently the analysis is insensitive to any B production asymmetries, and only knowledge of the relative acceptance is required. The relative acceptance is determined from the control channelB±
→
Dπ
±. In this decay the ratio ofb→
ucd¯
tob→
cud¯
amplitudes is expected to be very small (∼
0.005) and thus, to a good approximation, interference between the transitions can be neglected. Hence the relative population of decays expected in each B±→
Dπ
± Dalitz plot bin can be predicted using the Ki values calculated with theFig. 4.Dalitz plots ofB±→D K±candidates in the signal region for (a, b)D→K0
Sπ+π−and (c, d)D→KS0K+K−decays, divided between (a, c)B+ and (b, d)B−. The
boundaries of the kinematically-allowed regions are also shown.
In order to optimise the statistical precision of this procedure, the bins
+
iand−
iare combined in the calculation, since the efficien-cies in these symmetric regions are expected to be the same in the limit that there are no charge-dependent reconstruction asymme-tries. It is found that the variation in relative acceptance between non-symmetric bins is at most∼
50%, with the lowest efficiency occurring in those regions where one of the pions has low mo-mentum.Separate fits are performed to the B+ and B− data. Each fit simultaneously considers the two KS0 categories, the B±
→
D K± andB±→
Dπ
±candidates, and the twoD→
K0Sh+h−final states. In order to assess the impact of the D→
K0SK+K− data the fit
is then repeated including only the D
→
KS0π
+π
− sample. The PDF parameters for both the signal and background invariant mass distributions are fixed to the values determined in the global fit. The yields of all the background contributions in each bin are free parameters, apart from bins where a very low contribution is de-termined from an initial fit, in which case they are fixed to zero, to facilitate the calculation of the error matrix. The yields of sig-nal candidates for each bin in theB±→
Dπ
±sample are also free parameters. The amount of signal in each bin for the B±→
D K± sample is determined by varying the integrated yield and the x± andy±parameters.A large ensemble of simulated experiments are performed to validate the fit procedure. In each experiment the number and distribution of signal and background candidates are generated
according to the expected distribution in data, and the full fit pro-cedure is then executed. The values for x± and y± are set close to those determined by previous measurements [14]. It is found from this exercise that the errors are well estimated. Small biases are, however, observed in the central values returned by the fit and these are applied as corrections to the results obtained on data. The bias is
(0.2–0.3)
×
10−2 for most parameters but rises to 1.0×
10−2 for y+. This bias is due to the low yields in some of the bins and is an inherent feature of the maximum likelihood fit. This behaviour is associated with the size of data set being fit, since when simulated experiments are performed with larger sam-ple sizes the biases are observed to reduce.
The results of the fits are presented in Table 3. The system-atic uncertainties are discussed in Section 6. The statistical un-certainties are compatible with those predicted by simulated ex-periments. The inclusion of the D
→
K0SK+K− data improves the precision onx± by around 10%, and has little impact on y±. This behaviour is expected, as the measured values of ciin this mode,which multiply x± in Eq. (4), are significantly larger than those of si, which multiply y±. The two sets of results are compatible within the statistical and uncorrelated systematic uncertainties.
Table 3
Results for x± and y± from the fits to the data in the case when both D→
K0
Sπ+π−andD→KS0K+K−are considered and when only theD→K0Sπ+π−
fi-nal state is included. The first, second, and third uncertainties are the statistical, the experimental systematic, and the error associated with the precision of the strong-phase parameters, respectively. The correlation coefficients are calculated including all sources of uncertainty (the values in parentheses correspond to the case where only the statistical uncertainties are considered).
Parameter All data D→KS0π+π−alone
x−[×10−2] 0.0±4.3±1.5±0.6 1.6±4.8±1.4±0.8
y−[×10−2] 2.7±5.2±0.8±2.3 1.4±5.4±0.8±2.4
corr(x−,y−) −0.10 (−0.11) −0.12 (−0.12) x+[×10−2] −10.3±4.5±1.8±1.4 −8.6±5.4±1.7±1.6
y+[×10−2] −0.9±3.7±0.8±3.0 −0.3±3.7±0.9±2.7
[image:8.612.104.509.493.715.2]corr(x+,y+) 0.22 (0.17) 0.20 (0.17)
Fig. 5.One (solid), two (dashed) and three (dotted) standard deviation confidence levels for(x+,y+)(blue) and(x−,y−)(red) as measured in B±→D K± decays (statistical only). The points represent the best fit central values. (For interpretation of the references to colour in this figure legend, the reader is referred to the web version of this Letter.)
The data show this behaviour, but are also compatible with the no CPviolation hypothesis.
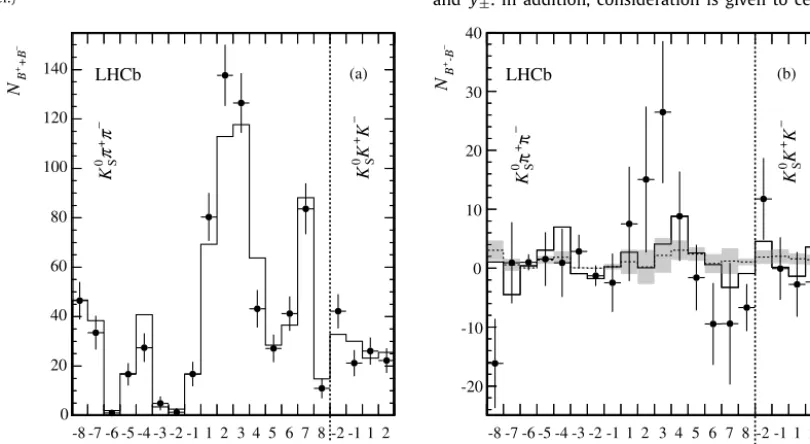
In order to investigate whether the binned fit gives an adequate description of the data, a study is performed to compare the ob-served number of signal candidates in each bin with that expected given the fitted total yield and values of x± and y±. The num-ber of signal candidates is determined by fitting in each bin for the B±
→
D K± contribution for long and downstream KS0 decays combined, with no assumption on how this component is dis-tributed over the Dalitz plot.Fig. 6 shows the results in effective bin number separately forNB++B−, the sum of B+and B−candi-dates, which is aCP-conserving observable, and for the difference NB+−B−, which is sensitive toCP violation. The effective bin
num-ber is equal to the normal bin numnum-ber for B+, but is defined to be this number multiplied by
−
1 for B−. The expectations from the (x±, y±) fit are superimposed as is, for the NB+−B−distribu-tion, the prediction for the case x±
=
y±=
0. Note that the zero CP violation prediction is not a horizontal line at NB+−B−=
0be-cause it is calculated using the total B+ and B− yields from the full fit, and using bin efficiencies that are determined separately for each sample. The data and fit expectations are compatible for both distributions yielding a
χ
2 probability of 10% forNB++B− and
34% for NB+−B−. The results for theNB+−B− distribution are also
compatible with the noCP violation hypothesis (
χ
2 probability=
16%).
6. Systematic uncertainties
Systematic uncertainties are evaluated for the fits to the full data sample and are presented in Table 4. In order to understand the impact of the CLEO-c
(c
i,
si)
measurements the errors arisingfrom this source are kept separate from the other experimental uncertainties. Table 5shows the uncertainties for the case where only D
→
KS0π
+π
−decays are included. Each contribution to the systematic uncertainties is now discussed in turn.The uncertainties on the shape parameters of the invariant mass distributions as determined from the global fit when prop-agated through to the binned analysis induce uncertainties onx± and y±. In addition, consideration is given to certain assumptions
Fig. 6.Signal yield in effective bins compared with prediction of(x±,y±)fit (black histogram) forD→K0Sπ+π−andD→K 0
SK+K−. Figure (a) shows the sum ofB+and
Table 5
Summary of statistical, experimental and strong-phase uncertainties onx±andy±
in the case where onlyD→K0
Sπ+π−decays are included in the fit. All entries are
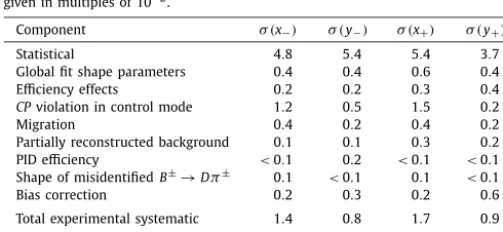
given in multiples of 10−2.
Component σ(x−) σ(y−) σ(x+) σ(y+)
Statistical 4.8 5.4 5.4 3.7 Global fit shape parameters 0.4 0.4 0.6 0.4 Efficiency effects 0.2 0.2 0.3 0.4 CPviolation in control mode 1.2 0.5 1.5 0.2 Migration 0.4 0.2 0.4 0.2 Partially reconstructed background 0.1 0.1 0.3 0.2 PID efficiency <0.1 0.2 <0.1 <0.1 Shape of misidentifiedB±→Dπ± 0.1 <0.1 0.1 <0.1 Bias correction 0.2 0.3 0.2 0.6 Total experimental systematic 1.4 0.8 1.7 0.9 Strong-phase systematic 0.8 2.4 1.6 2.7
made in the fit. For example, the slope of the combinatoric back-ground in the data set containingD
→
KS0K+K−decays is fixed to be zero on account of the limited sample size. The induced errors associated with these assumptions are evaluated and found to be small compared to those coming from the parameter uncertainties themselves, which vary between 0.4×
10−2and 0.6×
10−2 for thefit to the full data sample.
The analysis assumes an efficiency that is flat across each Dalitz plot bin. In reality the efficiency varies, and this leads to a poten-tial bias in the determination ofx±and y±, since the non-uniform acceptance means that the values of
(c
i,
si)
appropriate for theanalysis can differ from those corresponding to the flat-efficiency case. The possible size of this effect is evaluated in LHCb simula-tion by dividing each Dalitz plot bin into many smaller cells, and using the BaBar amplitude model[5,6]to calculate the values ofci
andsi within each cell. These values are then averaged together,
weighted by the population of each cell after efficiency losses, to obtain an effective
(c
i,
si)
for the bin as a whole, and the resultscompared with those determined assuming a flat efficiency. The differences between the two sets of results are found to be small compared with the CLEO-c measurement uncertainties. The data fit is then rerun many times, and the input values of
(c
i,
si)
aresmeared according to the size of these differences, and the mean shifts are assigned as a systematic uncertainty. These shifts vary between 0.2
×
10−2and 0.3×
10−2.The relative efficiency in each Dalitz plot bin is determined from the B±
→
Dπ
± control sample. Biases can enter the mea-surement if there are differences in the relative acceptance over the Dalitz plot between the control sample and that of signal B±→
D K± decays. Simulation studies show that the acceptance shapes are very similar between the two decays, but small vari-ations exist which can be attributed to kinematic correlvari-ationsin-B−final state will receive a contribution fromD
¯
0 decays, and thiswill lead to the presence ofCP violation via the same mechanism as in B
→
D K decays. The size of any CP violation that exists in this channel is governed by rDπB ,
γ
andδ
DBπ, where thepa-rameters with superscripts are analogous to their counterparts in B±
→
D K±decays. The naive expectation is thatrBDπ∼
0.005 but larger values are possible, and the studies reported in Ref.[1]are compatible with this possibility. Therefore simulated experiments are performed with finiteCPviolation injected in the control chan-nel, conservatively settingrDπB to be 0.02, taking a wide variation
in the value of the unknown strong-phase difference
δ
BDπ, and choosingγ
=
70◦. The experiments are fit under the no CP vio-lation hypothesis and the largest shifts observed are assigned as a systematic uncertainty. This contribution is the largest source of experimental systematic uncertainty in the measurement, for ex-ample contributing an error of 1.5×
10−2 in the case ofx+ in the full data fit.
The resolution of each decay on the Dalitz plot is approxi-mately 0.004 GeV2
/c
4 for candidates with long K0S decays and 0.006 GeV2/c
4 for those containing downstreamKS0in them2+and m2−directions. This is small compared to the typical width of a bin, nonetheless some net migration is possible away from the more densely populated bins. At first order this effect is accounted for by use of the control channel, but residual effects enter because of the different distribution in the Dalitz plot of the signal events. Once more a series of simulated experiments is performed to as-sess the size of any possible bias which is found to vary between 0.2
×
10−2 and 0.4×
10−2.The distribution of the partially reconstructed background is varied over the Dalitz plot according to the uncertainty in the make-up of this background component. From these studies an un-certainty of
(0.2–0.3)
×
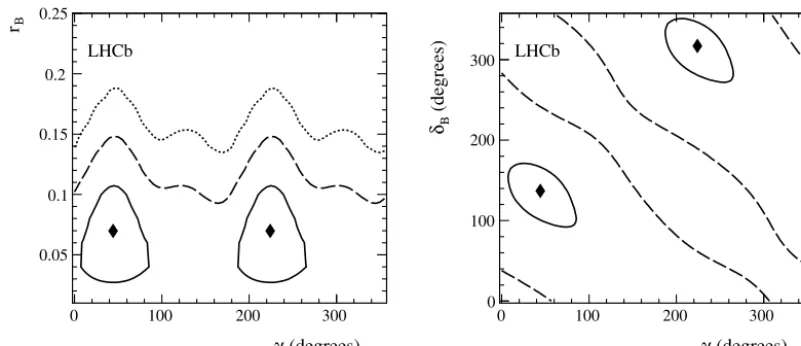
10−2 is assigned to the fit parameters in the full data fit. [image:9.612.32.284.282.398.2]Fig. 7.Two-dimensional projections of confidence regions onto the(γ,rB)and(γ, δB)planes showing the one (solid) and two (dashed) standard deviations with all uncer-tainties included. For the (γ,rB) projection the three (dotted) standard deviation contour is also shown. The points mark the central values.
An uncertainty is assigned to each parameter to accompany the correction that is applied for the small bias which is present in the fit procedure. These uncertainties are determined by performing sets of simulated experiments, in each of which different values of x± and y± are input, corresponding to a range that is wide compared to the current experimental knowledge, and also encom-passing the results of this analysis. The spread in observed bias is taken as the systematic error, and is largest for y+, reaching a value of 0.5
×
10−2in the full data fit.Finally, several robustness checks are conducted to assess the stability of the results. These include repeating the analysis with alternative binning schemes for the D
→
K0Sπ
+π
− data and per-forming the fits without making any distinction betweenKS0 cate-gory. These tests return results compatible with the baseline pro-cedure.The total experimental systematic uncertainty from LHCb-related sources is determined to be 1.5
×
10−2 onx−, 0.9×
10−2 on y−, 1.8×
10−2 on x+ and 0.8
×
10−2 on y+. These are all smaller than the corresponding statistical uncertainties. The dom-inant contribution arises from allowing for the possibility of CP violation in the control channel, B
→
Dπ
. In the future, when larger data sets are analysed, alternative analysis methods will be explored to eliminate this potential source of bias.The limited precision on
(c
i,
si)
coming from the CLEO-cmea-surement induces uncertainties on x± and y± [12]. These un-certainties are evaluated by rerunning the data fit many times, and smearing the input values of
(c
i,
si)
according to theirmea-surement errors and correlations. Values of
(0.6–3.0)
×
10−2 arefound for the fit to the full sample. When evaluated for theD
→
K0Sπ
+π
− data set alone, the results are similar in magnitude, but not identical, to those reported in the corresponding Belle analy-sis[13]. Differences are to be expected, as these uncertainties have a dependence on the central values of thex±and y±parameters, and are sample-dependent for small data sets. Simulation stud-ies indicate that these uncertaintstud-ies will be reduced when larger B±→
D K±data sets are analysed.After taking account of all sources of uncertainty the correla-tion coefficient betweenx− and y− in the full fit is calculated to be
−
0.10 and that between x+ and y+ to be 0.22. The correla-tions between B− and B+ parameters are found to be small and can be neglected. These correlations are summarised inTable 3, to-gether with those coming from the statistical uncertainties alone, and those from the fit toD→
KS0π
+π
−data.7. Interpretation
The results for x± and y± can be interpreted in terms of the underlying physics parameters
γ
, rB andδ
B. This is done usinga frequentist approach with Feldman–Cousins ordering [27], us-ing the same procedure as described in Ref.[13]. In this manner confidence levels are obtained for the three physics parameters. The confidence levels for one, two and three standard deviations are taken at 20%, 74% and 97%, which is appropriate for a dimensional Gaussian distribution. The projections of the three-dimensional surfaces bounding the one, two and three standard deviation volumes onto the
(
γ
,
rB)
and(
γ
, δ
B)
planes are shownin Fig. 7. The LHCb-related systematic uncertainties are taken as uncorrelated and correlations of the CLEO-c and statistical uncer-tainties are taken into account. The statistical and systematic un-certainties onxandy are combined in quadrature.
The solution for the physics parameters has a two-fold ambigu-ity,
(
γ
, δ
B)
and(
γ
+
180◦, δ
B+
180◦). Choosing the solution that
satisfies 0
<
γ
<
180◦ yields rB=
0.07±
0.04,γ
=
(44
+−4338)
◦ andδ
B=
(137
+−3546)
◦. The value forrB is consistent with, but lower than,the world average of results from previous experiments[15]. This low value means that it is not possible to use the results of this analysis, in isolation, to set strong constraints on the values of
γ
and
δ
B, as can be seen by the large uncertainties on theseparam-eters.
8. Conclusions
Approximately 800 B±
→
D K± decay candidates, with the D meson decaying either to KS0π
+π
− or KS0K+K−, have been se-lected from 1.0 fb−1 of data collected by LHCb in 2011. These samples have been analysed to determine theCP-violating param-etersx±=
rBcos(δB±
γ
)
and y±=
rBsin(δB±
γ
), where
rB is theratio of the absolute values of the B+
→
D0K−and B+→ ¯
D0K−amplitudes,
δ
B is the strong-phase difference between them, andγ
is the angle of the unitarity triangle. The analysis is performed in bins of D decay Dalitz space and existing measurements of the CLEO-c experiment are used to provide input on the D de-cay strong-phase parameters(c
i,
si)
[12]. Such an approach allowsMore stringent constraints are expected when these results are combined with other measurements from LHCb which have com-plementary sensitivity to the same physics parameters.
Acknowledgements
We express our gratitude to our colleagues in the CERN accel-erator departments for the excellent performance of the LHC. We thank the technical and administrative staff at CERN and at the LHCb institutes, and acknowledge support from the National Agen-cies: CAPES, CNPq, FAPERJ and FINEP (Brazil); CERN; NSFC (China); CNRS/IN2P3 (France); BMBF, DFG, HGF and MPG (Germany); SFI (Ireland); INFN (Italy); FOM and NWO (The Netherlands); SCSR (Poland); ANCS (Romania); MinES of Russia and Rosatom (Russia); MICINN, XuntaGal and GENCAT (Spain); SNSF and SER (Switzer-land); NAS Ukraine (Ukraine); STFC (United Kingdom); NSF (USA). We also acknowledge the support received from the ERC under FP7 and the Region Auvergne.
Open access
This article is published Open Access at sciencedirect.com. It is distributed under the terms of the Creative Commons Attribu-tion License 3.0, which permits unrestricted use, distribuAttribu-tion, and reproduction in any medium, provided the original authors and source are credited.
1003.3360.
[10] A. Bondar, A. Poluektov, Eur. Phys. J. C 47 (2006) 347, arXiv:hep-ph/0510246. [11] A. Bondar, A. Poluektov, Eur. Phys. J. C 55 (2008) 51, arXiv:0801.0840. [12] CLEO Collaboration, J. Libby, et al., Phys. Rev. D 82 (2010) 112006, arXiv:
1010.2817.
[13] Belle Collaboration, H. Aihara, et al., Phys. Rev. D 85 (2012) 112014, arXiv: 1204.6561.
[14] Heavy Flavor Averaging Group, D. Asner, et al., Averages of b-hadron, c-hadron, andτ-lepton properties, arXiv:1010.1589, updates available online athttp:// www.slac.Stanford.edu/xorg/hfag.
[15] Particle Data Group, J. Beringer, et al., Phys. Rev. D 86 (2012) 010001. [16] A. Bondar, A. Poluektov, V. Vorobiev, Phys. Rev. D 82 (2010) 034033, arXiv:
1004.2350.
[17] LHCb Collaboration, A.A. Alves Jr., et al., JINST 3 (2008) S08005.
[18] V.V. Gligorov, C. Thomas, M. Williams, The HIT inclusive B triggers, LHCb-PUB-2011-016.
[19] T. Sjöstrand, S. Mrenna, P. Skands, JHEP 0605 (2006) 026, arXiv:hep-ph/ 0603175.
[20] I. Belyaev, et al., in: Nuclear Science Symposium Conference Record (NSS/MIC), IEEE, 2010, p. 1155.
[21] D.J. Lange, Nucl. Instrum. Meth. A 462 (2001) 152.
[22] P. Golonka, Z. Was, Eur. Phys. J. C 45 (2006) 97, arXiv:hep-ph/0506026. [23] GEANT4 Collaboration, J. Allison, et al., IEEE Trans. Nucl. Sci. 53 (2006) 270;
GEANT4 Collaboration, S. Agostinelli, et al., Nucl. Instrum. Meth. A 506 (2003) 250.
[24] M. Clemencic, et al., J. Phys.: Conf. Ser. 331 (2011) 032023.
[25] K.S. Cranmer, Comput. Phys. Comm. 136 (2001) 198, arXiv:hep-ex/0011057. [26] T. Skwarnicki, A study of the radiative cascade transitions between the
Upsilon-prime and Upsilon resonances, PhD thesis, Institute of Nuclear Physics, Krakow, 1986, DESY-F31-86-02.
[27] G.J. Feldman, R.D. Cousins, Phys. Rev. D 57 (1998) 3873, arXiv:physics/9711021.
LHCb Collaboration