Estimating User Interaction Complexity
Zarimir Tzankov Mitev
University of Twente P.O. Box 217, 7500AE Enschede
The Netherlands
[email protected]
ABSTRACT
One of the main topics in software development is con-cerned with measuring the complexity of interactions. In this paper, the focus is on user-machine interactions. Cur-rent approaches for estimating user perception of an inter-action before it is fully developed are expensive in terms of time, money and effort. Furthermore, when it comes to data collected for measuring the complexity of a given interaction, there is currently not an established method-ology of reusing such data for measuring another inter-action. In this research a new methodology is proposed which could make it possible to systematically collect data from users about few primitive interactive actions indi-vidually and then reuse the same data for the estimation of the complexity of arbitrary interactions composed of such actions. The validity of the proposed methodology is measured based on a sample of forty-three randomly selected students from the University of Twente and it is then compared with the average measured user perception accuracy.
Keywords
measure, interaction, complexity, system, usability, action time
1.
INTRODUCTION
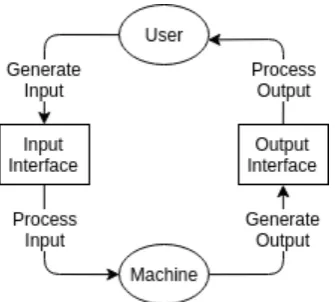
In user-machine interactions, users act on machines via put interfaces and the machines then process the new in-puts as shown on Figure 1. Machines act on users via out-put interfaces and the users then process new outout-puts as shown on Figure 1. Each action could be categorized, for example ”click”, ”key press”, ”scroll-down”, ”mouse-move”, ”display on the screen”, ”produce sound”, ”vibrate”, etc. An interaction could be described as a set of actions. In-teraction complexity is a way to measure the quality of an interaction so as to enable objective comparisons with other interactions. A model for these concepts is given on Figure 1 for which an in-depth explanation is provided later in this section.
1.1
Problem Statement
User-testing an interaction design is useful but also expen-sive in terms of resources. The people conducting the tests
Permission to make digital or hard copies of all or part of this work for personal or classroom use is granted without fee provided that copies are not made or distributed for profit or commercial advantage and that copies bear this notice and the full citation on the first page. To copy oth-erwise, or republish, to post on servers or to redistribute to lists, requires prior specific permission and/or a fee.
31thTwente Student Conference on ITJuly 5th, 2019, Enschede, The Netherlands.
Copyright2019, University of Twente, Faculty of Electrical Engineer-ing, Mathematics and Computer Science.
have to spend time searching for participants for the inter-action experiments. Depending on the format, a video or a voice transcription has to be made if the experiments are recorded. Usually both qualitative and quantitative data has to be analyzed which also requires time and human resources. Even if the user testing is carried out perfectly, the feedback could still be substantially negative which would mean that all the development that has taken place for the prototype is more or less wasted and the next pro-totype has to be started from scratch. Apart from that, there is also a risk of mishandling the data and introduc-ing bias. Gettintroduc-ing wrong information is in some sense worse than getting negative but correct information, because in the latter case the information is insightful, whereas in the first case it is likely to result in more wrong decisions and more wasted time and effort. Even if none of these bad sit-uations happen, for the next prototype iteration this whole user-testing cycle has to be repeated with all the resource expenses and risks associated with it. Alternatively, user testing could be done after the whole product is finished, but this is also comes with a risk, because the costs of fixing a fundamentally flawed interaction design which is fully developed may outweigh any benefits associated with postponing the user testing to this point.
1.2
Research Questions
The main research question is formulated as follows:
• What could be done to estimate the complexity of an interaction in its design and development stages?
The research question is divided in the following sub ques-tions:
• What kind of interaction data could be relevant for such an estimator?
• What would have to be done to utilize such data for the purpose of estimating the complexity of arbitrary interactions?
• What would be the accuracy of such estimators rel-ative to the accuracy of user perception?
1.3
Proposed Methodology
1.3.1
Model
Figure 1. A simple model of user-machine inter-action.
sound/noise or something else dependent on the available output interface. An interaction could be modelled as a set of actions (input/output actions) as shown on Figure 1. Furthermore, each action could be categorized, i.e ’click on mouse’, ’press a key’, ’scroll down’, ’move mouse’, ’touch screen’, etc. For a machine, examples of such actions could be ’show on screen’, ’vibrate’, ’make a sound’, etc. Each action has a doer (user or machine), category and a du-ration time. An interaction is simply a set of actions. In this research, complexity of an interaction is measured as the total time required to complete it, therefore, if two interactions are compared, the one which takes the least amount of time is determined as the better of the two.
1.3.2
Formalization
Definition 1. An agent is either a User or a Machine (Figure 1):
Agents ={User,Machine}
Definition 2. An action is a pair of an agent and a time duration (Figure 1):
Actions = Agents×Times
Note: The way Times is measured is an implementation detail. In this research, Times =Rand its members are
durations measured in milliseconds.
Definition 3. An interaction is a set of one or more ac-tions:
Interactions = (Actions)+
Note: It could be argued that some actions could be car-ried out in parallel. Possible extensions which could ad-dress this problem are given in Section 5.
Definition 4. The complexity of an interaction is the total time required to complete it, i.e the sum of all of its action times because they are sequential:
C(I) = X
(agent,time)∈I
time
Definition 5. Comparison of two interactions:
Better(F, I0, I1) =
{I0, I1} if F(I0)≈F(I1)
{I0} if F(I0)<F(I1)
{I1} if F(I0)>F(I1)
The function F takes an interaction as an argument and returns the time it takes to complete:
F : Interactions→Times
For a given pair of interactions, the following types of com-parisons can be made:
• A comparison based on the measured total time for each interaction in the pair:
measured = Better(Measured, I0, I1)
• A comparison based on the perceived total time for each interaction in the pair:
perceived = Better(Perceived, I0, I1)
• A comparison based on the estimated total time for each interaction in the pair:
estimated = Better(Estimated, I0, I1)
Definition 6. Accuracy is empirically inferred based on a sample of interaction pairs. Once each pair is compared, the accuracy is measured as follows:
• The sample accuracy of the user perception is the proportion of correctly compared interaction pairs over the sample size:
perception =Count(Equal(perceived, actual)) Count(pairs)
• The sample accuracy of an estimator is the propor-tion of correctly compared interacpropor-tion pairs over the sample size:
estimation =Count(Equal(estimated, actual)) Count(pairs)
Definition 7. TDR (Time Difference Ratio) of a given interaction pair is calculated as the proportion of half the time difference over the mean time:
TD(F, I0, I1) =
1
2|F(I0)−F(I1)| 1
2[F(I0) + F(I1)]
·100%
The mean time is used because it represents a time that is equally distanced from the times of each of the two in-teractions and the order of the inin-teractions does not affect the proportion. The distance from the mean time to either of the interaction times is equal to half the time difference. The ratio is based on the assumption that both estima-tor and perception accuracy should be higher when TDR is larger and vice versa. Based on this assumption, an interaction pair sample could be distributed in TDR in-tervals and then estimator and perception accuracy could be investigated for each interval. In this research, TDR intervals of 5% are used, i.e 0-5%, 5-10%, 10-15%, 15-20% and so on.
1.4
Goal
The goal is to investigate if the methodology is useful on small-scale examples in a controlled environment. If the results are promising, further research could test the methodology on larger scale examples.
1.4.1
Hypothesis
1.4.2
Objectives
• Investigate the accuracy of user perception in a sam-ple of interaction pairs distributed in TDR intervals • Investigate the accuracy of two estimators in a sam-ple of interaction pairs distributed in TDR intervals
1.5
Justification
All else being equal, increasing the amount of time an in-teraction takes strictly reduces its quality, therefore, time does not merely correlate with interaction quality. Both users and machines have algorithms for processing infor-mation and for producing input and output respectively. Developers have direct control only over the machines. Time reductions can be made by optimizing the machines’ information processing capability. Time reductions could also be made by optimizing the output that machines pro-duce to the user’s algorithms for processing such informa-tion. For instance, if a machine displays a message on a screen and it disappears after 1 millisecond, then this is not optimized to the user’s message processing algorithms, because people cannot read messages this quickly. A sim-ilar argument could also be made for showing a message for too long. Furthermore, users and machines have dif-ferent strengths and weaknesses. For example, machines could save and then recall with a hundred percent accu-racy thousands of words within seconds. Users, on the other hand, are able to process information in environ-ments full of uncertainty such as determining the meaning of words.
The ways people interact with machines are constrained by several factors. On the one hand, there are physiolog-ical limits in terms of both speed and precision when it comes to someone’s ability to click on a button, move a mouse, press on a key, look at something. On the other hand, there are also limits to the processing capabilities one has in terms of both speed and precision when it comes to interpreting information. In terms of user processing capability, there is only so much information one could hold in the short-term memory, and it is difficult to keep multiple things in mind when making decisions because it requires a recall of all the relevant information and it also often requires dealing with a large amount of uncertainty both of which are expensive operations. This affects what kind of information representations require less user effort to process. For example, spelling mistakes cause people to spend additional effort in guessing what was the intended word.
Intuitive design aims to minimize the required effort from users to get what they want. As such, action times could be a good estimate of the exerted effort from the users. The estimate approach has some disadvantages as well. For example, users get distracted, sometimes change their decisions in the middle of an interaction and other times they are simply tired and do not perform as well. A user may be able to type very quickly but if they make a mis-take it could mis-take them more time to realize the mismis-take and fix it than the total time to write all the other char-acters. If mean performance is used as an estimate, such mistakes could contribute to a large deviation of more than a 100%. On the other hand, these factors may also affect user’s perception of time differences between interactions which means that such high potential deviations may not necessarily imply that the estimate approach will have less accuracy than human perception. Alternatively, it is pos-sible that user’s perception subconsciously takes into an account important factors which will be disregarded by an estimator built only on action times.
There are certainly reasons to think that such a method-ology could be useful as well as reasons to be skeptical. This research aims to investigate the accuracy of both the methodology as well as the user’s perception and relate one to the other.
1.6
Background
1.6.1
Related Prior Work
One of the main methods of developing user interactions of high complexity is through prototyping and testing on real users [7]. This approach is preferable when the focus is on exploring new interaction designs, but it is time con-suming when the focus is on creating new features using established designs [4]. Other interaction research meth-ods include observation, performance measures, question-naires, focus groups, logging actual use and user feedback [6], some of which cannot be automated and others provide only a certain type of data. There is evidence that certain heuristics provide consistent positive results regardless of the machine to which they are applied [5]. There have been proposed solutions to the problems described in this paper, a similar idea has been explored before and a working tool has been developed capable of measuring interaction com-plexity during development of mobile applications [8]. The proposed idea in this research is different, because it uti-lizes a simpler model and investigates an approach which is more flexible, it proposes a way to reason about com-plexity of interactions regardless of the machine in which they are used as opposed to modelling mobile applications and sampling user data for each interaction.
1.6.2
Overlapping Prior Work
A week before the paper submission, it was discovered that a methodology which uses similar reasoning to the one used for the methodology in this paper has been de-veloped decades ago [1, 2]. It is more sophisticated and its estimators are based on more intricate details such as the average eye-movement speed, the time it takes people to process different kinds of information and other finer de-tails which affect user action times. The core idea remains the same - develop estimators by sampling simple interac-tive actions and then use the estimators to estimate the complexity of arbitrary interactions in terms of the total time required to complete them. Furthermore, tools have been developed such as CogTool [3] which almost fully au-tomate the task of estimating the complexity of an interac-tion using an interacinterac-tion mock up and an acinterac-tion sequence demonstration. It is important to note that the ideas in this paper have been independently developed without the knowledge of tools like CogTool or the underlying research behind them.
2.
METHODOLOGY
In order to investigate the validiy of the hypothesis, an experiment was developed, consisting of sampling of sim-ple interactive elements and then sampling of interactions composed of such elements. Actions are only sequential which means that the total time of an interaction is equal to the sum of its action times. The participant popula-tion for the research was chosen to be the students from the University of Twente. The main focus of most of the decisions made when preparing the research format was avoiding data bias.
2.1
Interaction Development
2.1.1
Machine and Environment
environment consisted of a PostgreSQL database, a web-server written in Python and the client logic written in JavaScript. Similarly, a native desktop environment could have been developed, but due to research constraints, there was time to develop only one simulation environment. The browser used was the latest version of Chromium and the browser window was maximized to the full size of the screen - 1920x1080px. Despite developing the machine environment as if it were a web application, the same methodology should work for a native desktop applica-tion, a smart-phone applicaapplica-tion, or even a feature phone application - any kind of a machine and environment com-bination that users interact with.
2.1.2
Input and Output Types
Depending on the user-system interfaces, different types of input methods should be considered, i.e for a smart-phone, touch-screen touching is prevalent and mouse-clicking is non-existent, and also smart-phones could output to the user via vibrations, whereas computers usually cannot vi-brate. The interactions developed for this research require the user to provide input to a computer in the following ways:
• moving a mouse
• clicking on the left mouse button
• pressing on letter keys and digit keys on a keyboard
The computer outputs information in the following ways:
• display on the screen
2.1.3
Interactive Elements
These input and output types are combined in interactive elements. For this research, only two interactive elements have been developed and used.
Clicker
Clicker
The first element is referred to as a ’clicker’ and every clicker instance looks exactly as the one shown on Figure 2. The only difference between different clicker instances is their position on the screen which is set at random each time. The user is supposed to move the mouse from its current position to the clicker instance and when the user clicks on it, the clicker instance is completed.
Texter
Texter
The second element is referred to as a ’texter’ and it looks like the one shown on Figure 3. Each texter has two text fields, the top text field shows what the user should en-ter in the bottom text field. Furthermore, each texen-ter has a random position on the screen and a random charac-ter sequence. A user is expected to move the mouse to the bottom field, click on it, then manually enter the an-swer shown on the top field. On each key press the user’s answer is compared with the expected answer. On the key press in which these two answers are equal, the tex-ter is automatically completed, i.e the user does not have to manually press enter or click somewhere to submit - it happens automatically.
2.1.4
Interaction
Each interaction in the research is composed of a sequence of ’clickers’ and/or ’texters’. At any point during an in-teraction, there is only one element on the screen, either
Figure 2. A clicker element.
Figure 3. A texter element.
a ’clicker’ or a ’texter’ which the user has to complete be-fore the element is hidden and the next element is shown. Each participant is asked to complete two phases of a se-ries of interactions which will be explained in detail in the following subsections.
2.2
Element Sampling
During the element sampling phase, a series of interaction sequences of only one interaction element take place for the purpose of sampling data for each element individually.
2.2.1
Clicker
During the clicker sampling, interactions of only one clicker appear for a period of 20 seconds. Each time the user com-pletes a clicker, the interaction is completed and a new interaction of a single clicker appears, unless the duration period has expired. After the clicker sampling is complete, the texter sampling begins.
2.2.2
Texter
During the texter sampling, interactions of only one texter appear for a period of 50 seconds. Each time the user completes a texter, the interaction is completed and a new interaction of a single texter appears, unless the duration period has expired.
2.3
Interaction Sampling
The last seven tests which the user is asked to complete are Experiment Interactions. Each Experiment Interac-tion has a duraInterac-tion between 14 seconds and 42 seconds (28 seconds -/+ 50%). Each Experiment Interaction consists of a random sequence of clickers and texters. Furthermore, the user is asked to indicate their perception of the time it took them to complete the current interaction relative to the previous one as shown on Figure 4. The question prompt looks exactly the same as the one shown on Figure 5 and it asks the participant to rate the most recent two interactions on a scale.
2.4
Data Collection
The following data is collected from each clicker and tex-ter:
• Time/Mouse - the time from the appearance of the element to the first mouse move. It is short for ’time over moving the mouse’.
• Time/Hover - the time from the first mouse move to the first hover. A hover means that the mouse has reached the element’s clickable area.
1 2 3 4 5 6 7
Figure 5. The seven-scale sensitivity rating question. The red text changes based on the selected value. About the same time is equal to the value 0 (currently selected). Insignificantly more (or less) is equal to 1 (or -1). Significantly more (or less) is equal to 2 (or -2) (currently hovered). A lot more (or less) is equal to 3 (or -3).
• Time/Click - the time from the first hover to the first click
• Distance - the minimal pixel distance from the mouse starting position to the mouse first hover position
• After - the type of the previous element - a clicker or a texter
In terms of the data collection, a texter is a special clicker with more data. The additionally collected data is as fol-lows:
• Time/Keyboard - the time from the first click to the first pressed key. It is named this way, because in many cases, participants first move their right hand to the keyboard and only then press the first key, i.e it is short for ’time over moving the right hand to the keyboard’.
• Time/Submit - the time from the first pressed key to the last pressed key
• Length - the minimal number of keys that the user have to press in order to complete the texter
Lastly, the following data is collected after each pair of Experiment Interactions:
• Perception - the perceived time of the last interaction relative to the second-to-last interaction rated on a scale of -3 to 3.
2.5
Estimators
All the clicker and texter data collected from the two sampling interactions from all the participants is used to develop two interaction time estimators. Similar to how users rated each interaction pair on a scale of -3 to 3, the estimators will be used to rate the same interactions on a scale of -1 to 1. The actual measured times will also be used to rate the same interactions on a scale of -1 to 1. The accuracy of the estimator will then be analyzed in terms of the ratings of the actual measured times, the precision of the user ratings and the accuracy of the other estimators.
2.5.1
Simple Estimator
The first interaction complexity estimator is called ’Simple Estimator’ and it takes only the following arguments for a given interaction:
• number of clickers
• number of texters
It uses the element samples to calculate the mean time to complete for clickers as well as for texters and gives an estimation based on the numbers of clickers and texters in an interaction.
2.5.2
Advanced Estimator
The second interaction complexity estimator is called ’Ad-vanced Estimator’ and it takes the following arguments for a given interaction:
• number of clickers after clickers
• number of clickers after texters
• total distance
• number of texters after clickers
• number of texters after texters
• total length
Most of the time values are simply estimated by taking the mean from the element samples. The estimator, how-ever, takes an advantage of the fact that both the distance to each clicker and the length of each texter can be deter-mined precisely instead of being estimated. It is fair to use these parameters, because they are part of the design and usually not something that dynamically changes for each user. Additionally it differentiates between elements pre-ceded by a texter from those prepre-ceded by a clicker. More specifically, the following times are calculated differently:
• time/pixel (time per pixel) is equal to time/hover over distance
• time/hover is estimated as the product of the actual element distance and the mean time/pixel
• time/key (time per key) is equal to time/submit over length
• time/submit is estimated as the product of the actual element length and the mean time/key
• time/mouse is interpreted as time/keyboard in the cases where the element was preceded by a texter
The reasoning for the time/mouse calculation is that if the user has completed a clicker, then their right hand is on the mouse and the time/mouse for the next element should in-deed be interpreted as time/mouse. If the user completed a texter, however, the time/mouse is then interpreted as time/keyboard based on the following assumptions:
• the time to move the user’s right hand from the mouse to the keyboard (time/keyboard) is approxi-mately the same as moving it back to the mouse
2.6
Constraints and Data Bias
In order to carry out the research in a reasonable amount of time and at the same time produce meaningful results, several decisions had to be made regarding the scope and the structure of the research.
2.6.1
Controlled environment
The main advantage of publishing the experiment online would be the ability to get hundreds of students to partic-ipate. The main disadvantage of this option would be the quality deterioration of each user experiment. Considering that the actions on each clicker and texter are measured in milliseconds, even a single distraction such as getting in a conversation could result in abnormal action times. The experiments consist of a series of random and repetitive tests which increases the chances of people to stopping the experiment midway. Such time abnormalities should not even be considered when measuring complexity of interac-tions if they are caused by external distracinterac-tions. Lastly, if the user is unsure how to interpret the experiment ques-tions, then the researcher would not be able to provide fur-ther clarifications. With these assumptions in mind, the decision was made to choose quality over quantity. Each user experiment was carried out on the same laptop, the same keyboard, the same mouse and the same mouse pad. Each experiment was personally observed and before each step an additional explanation was given to each partici-pant individually in order to make sure they understand exactly what they are asked to do.
2.6.2
Scale of the experiments
A balance had to be made between getting as much data as possible without boring people with too many repeti-tive tasks or worse - getting too many rejections because the duration is too long. These concerns were the reason to compress the user experiments to the limits without losing data quality. This was the main reason the format consisted of 9 highly coherent tests. The duration of each experiment was set at random in the range 4 minutes and 26 seconds -/+ 37% and the duration did become a selling point of the participation pitch as many of the partici-pants responded with ”If it is only five minutes... okay, I can participate.”.
2.6.3
Sampling Bias
The data from the first clicker and the first texter for ev-ery participant was ignored during the analysis. These elements were used to demonstrate to the users what they are supposed to do and thus have abnormally larger action times for reasons which are irrelevant to the validiy of the methodology.
2.6.4
Interaction Organization
Each interaction is a sequence of elements. At any point there is only one element available on the whole screen -either a clicker or a texter. Once the element is completed it disappears and either the interaction completes as well or a new element appears. Whether the new element is a clicker or a texter is decided at random. The duration of each interaction is also randomly decided in the range 28 seconds -/+50% or in other words between 14 seconds and 42 seconds.
2.6.5
Questions
There was only one question and it was once for each inter-action pair for a total of six times per participant. Since the interactions are quite random, it was assumed that participants will have a difficulty keeping track of more than two interactions at a time. For this reason, each
ques-tion considers only the most recent two interacques-tions, in other words, the most recent and vivid experiences. Fur-thermore, in order to make sure that participants have cor-rectly understood the question, the question was explained with an example to each participant who was then asked to explain how they interpret the question and if there was any hint of confusion, the question was further clarified.
2.6.6
Element Positioning
The positions of the texters and the clickers is completely random. The screen is evenly divided in four quadrants, each with the width half the width of the computer screen and each half the height of the computer screen. For each clicker and texter, first one of the quadrants is randomly selected, each with 25% chance of getting selected, then a random position within the quadrant is computed, each pixel within the quadrant has an even chance of being cho-sen for the positioning. This is more of an implementation detail due to CSS specifics, the actual intended purpose was that the positioning had to be fairly random.
2.6.7
Element Styling
The clickers look exactly the same in terms of font size, font color, choice of fonts, background colour of the clicker, background color of the clicker when hovered - all clickers use exactly the same styling. The reason is that, with each styling property that is not fixed, the standard deviation may also increase and at some point the purpose of the research would shift from delivering a proof of concept to focusing too much on details which may even be irrelevant if the proof of concept fails. All the texters also have exactly the same styling with one exception, the texter width depends on the number of symbols - each symbols adds 24 pixels to the width starting from 0 pixel width in order to allow further experimentation with one of the variables, namely clicker size. This had to be done anyway, because texters already look differently than clickers, i.e their area of clicking is not the same and the surroundings is also not the same (texters have two text fields, one filled with characters). This decision meant that there is a little unpredictability and variance in the sampling - just enough to make a proof of concept.
2.6.8
Texter characters
The texter characters are between 3 and 7, all lower-case, letters and digits are evenly distributed and none are spe-cial symbols. These decisions were based on the following reasons:
Lower and Upper Bounds
Lower and Upper Bounds
Textual inputs of only 1-2 characters are rare and usu-ally replaceable by other types of inputs such as check-boxes, radio buttons and etc. The upper bound is set to 7 characters, during the development it was initially set to 12 characters but it was too disproportional to the time constraints of each experiment. The whole purpose of the interactions was that they have a variable number of click-ers and textclick-ers, and preferably more than one, otherwise they are no different than the samples taken in the element sampling phase. In short, texters have the same chance of getting any number of characters, the lower bound being 3 and the upper bound being 7.
Proportion of Letters and Digits
Proportion of Letters and Digits
are sometimes separated, a decision was made to separate letters from digits into two categories and giving each cat-egory 50% chance of being selected. In other words, there is on average an even number of letters and digits in the samples. In practice, sample sizes in the thousands are quite realistic for popular internet based systems such as websites and mobile apps and then such interaction con-straints could be approximated using action times. How-ever, in this research only tens of participants were ex-pected and such flexibility could make the data unreliable altogether.
Only Lower Case Letters
Only Lower Case Letters
Fonts make little to no distinction between the letters and digits ’I-i’, ’L-l’, ’J-j’, ’O-o’, ’1’, ’0’. In practice this is not a problem, because the characters are parts of words and numbers and people can make certain assumptions, i.e digits and capital letters are not expected in the middle of a word, similar to how letters are not expected in the middle of a number. When digits and letters are mixed at random, however, simply getting a text field with one of these symbols could significantly affect the action times. Furthermore, lower case letters and digits require a sin-gle key press, however capital letters require pressing and holding one key while pressing another which is a differ-ent way to use the keyboard interface. It was not expected that there will be enough samples to accommodate to such interaction variety.
No Special Symbols
No Special Symbols
Special symbols are not used as often as letters and dig-its. The second reason is also a reason against upper case letters, namely, most special symbols require pressing and holding of the shift key and simultaneously pressing an-other key.
2.6.9
Sampling Locations
The following student gathering locations were selected:
• Edu-Cafe/Starbucks
• Cubicus
• Design Lab
• Horst
• Carre
• Ravelijn
There is a larger number of participants from Edu-Cafe and Design Lab than the other locations. This is due to the fact that more students gather in these places and the fact that a larger proportion of them tend to be willing to participate. This bias is not caused by the location, rather than the availability of students at that particular time period which in turn is irrelevant to the research, because there is no apparent cause and effect between university project deadlines and the typing and clicking efficiency of students.
2.6.10
Participant Selection
The main concern regarding the usefulness of the method-ology was whether using sample means will be accurate enough to deal with deviations that happen due to de-viations caused by mistakes or user speed. In order to collect useful data, it had to represent people from both
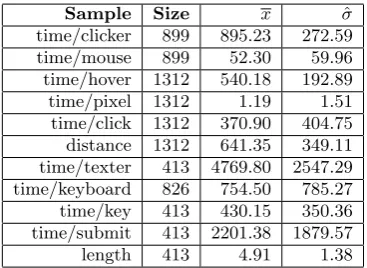
[image:7.595.333.517.52.186.2]Sample Size x σˆ time/clicker 899 895.23 272.59 time/mouse 899 52.30 59.96 time/hover 1312 540.18 192.89 time/pixel 1312 1.19 1.51 time/click 1312 370.90 404.75 distance 1312 641.35 349.11 time/texter 413 4769.80 2547.29 time/keyboard 826 754.50 785.27 time/key 413 430.15 350.36 time/submit 413 2201.38 1879.57 length 413 4.91 1.38
Table 1. Element sampled data. Each row repre-sents a sample and shows the sample type, sam-ple size, samsam-ple mean (x) and the sample devia-tion (σˆ). The distance is measured in pixels, the length in number of characters and each propor-tion (time/acpropor-tion) is measured in terms of millisec-onds per action.
ends of the speed spectrum. By the end of the research, there were enough participants so that satisfactory data diversity was achieved naturally without having to take any extra precautions. For example, Some participants typed symbols using only two fingers, others made a com-ment that each key had both an English (upper left cor-ner) and a Cyrillic print (lower right corcor-ner) which was confusing to them. This was an unforeseen circumstance but its consequences were indeed desirable, because each participant who relied on looking at the keys before press-ing the correct one, now had an additional disadvantage which resulted in larger timing deviations. On the other side of the spectrum, there were also participants whose typing was significantly faster than the average and some of them were even skilled enough to type without having to look at the keyboard at all.
2.6.11
Number of Participants
The final number of participants is forty-three, where only one participant did not have the time to complete all the tests and everyone else completed everything. While the chosen population consists of all students of the University of Twente, the people who actually had the opportunity to participate were students who were present in any of the research chosen locations. The number of participants was further constrained by the time constraints of the re-search and the time needed to explore and develop the methodology as well as the time needed to design the re-search and to program the experiments. There was only a certain amount of time reserved for user testing and it was used to its full extent.
3.
FINDINGS
3.1
Software Used
The collected data was stored in a PostgreSQL database and later extracted and analyzed using plain SQL queries, no external software was used to extract the data or to analyze it. The data graphs were generated using a python library called ’matplotlib’.
3.2
Clicker and Texter Samples
Figure 6. The number of interaction samples per interval of 5% time difference (TDR). For example, between 20% and 25% time differences (TDR), there are almost 30 samples.
Mean Accuracy
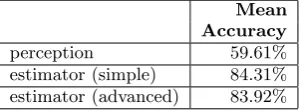
[image:8.595.142.439.80.309.2]perception 59.61% estimator (simple) 84.31% estimator (advanced) 83.92%
Table 2. The participant’s and the estimators’ mean accuracy based on all 255 interaction pair samples.
user to complete a given interaction as explained in Section 2.
3.3
Interaction Samples
Each interaction pair is grouped with other pairs according to their TDR in intervals of 5% as shown on Figure 6. In-teractions have a random time in milliseconds between 14 seconds and 42 seconds. A consequence of this decision is that the number of interaction pairs increases as the TDR decreases. The reason this is a desirable consequence is based on the assumption that higher TDR implies higher accuracy, but when the TDR is low, deviations could sig-nificantly affect the sampled mean and a larger sample size is preferable in order to have a higher chance of arriving at a stable mean value.
3.4
Participant and Estimator Accuracy
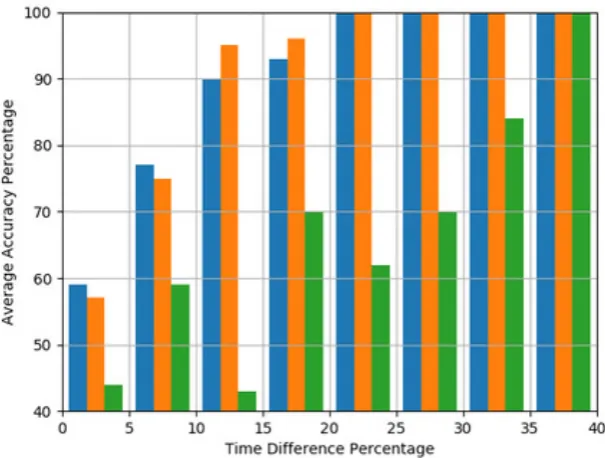
The mean accuracy was computed for the participant per-ception and both estimators across all 255 interaction pairs as shown on Table 2. The interaction pairs were also dis-tributed according to 5% TDR intervals and for each inter-val, the mean accuracy was computed for the participant perception and both estimators as shown on Figure 7.
4.
DISCUSSION
As seen on the graph shown on Figure 6, lower TDR in-tervals have larger number of samples. As discussed in Section 3, it is assumed that the accuracy will increase
with higher TDR intervals and it follows that larger sam-ple sizes are needed for lower TDR intervals than for higher TDR intervlas. Furthermore, if a high accuracy is mea-sured for a low TDR interval and then the accuracy is significantly lower in the following TDR intervals, it can indicate that the high accuracy is an outlier. An exam-ple of such a potential outlier is the perception accuracy recorded in the TDR interval 5%-10% (Figure 7), because in the next TDR interval, the accuracy drops to the lowest accuracy among any of the TDR intervals. Alternatively, the perception accuracy in the TDR range 10%-15% could be the actual outlier, because all the following intervals show a somewhat consistent and gradual increase in accu-racy. Such inconsistencies in human perception could raise questions regarding the validity of the assumption which states that accuracy should increase with the TDR inter-vals. However, the accuracy of not one, but both estima-tors increases according to what the assumption suggests. One possible explanation is that the perception accuracy of an individual also increases as the assumption states, but when taking the mean perception accuracy of a group of people and compare it with that of another group of people, this could cause considerably large deviations, i.e of more than 25%. Another possible explanation is that even the perception accuracy of an individual is not neces-sarily consistent and is affected to a significant extent by external factors such as surrounding visual or auditory dis-tractions. Since the estimators are only affected by mean human performance and while the measures indeed have large deviations, higher TDR intervals linearly increase the tolerable error range, hence the accuracy consistently increases.
[image:8.595.95.245.365.421.2]Figure 7. Comparison of the advanced estimator (blue), the simple estimator (orange) and the participant (green) accuracy per interval of 5% time difference (TDR). For example, participant perception has less than 30% accuracy in interaction samples with time differences (TDR) between 10% and 15%
participant perception only does so from the TDR interval 35%-40% onwards. Furthermore, there is not even a single TDR interval where the participant perception is more accurate than either of the estimators.
There are two TDR intervals where the advanced estima-tor is more accurate than the simple one and two intervals where the opposite happens. In all four TDR intervals, the accuracy differences are no higher than 5% and when measured across all 255 interaction pairs, the mean accu-racy difference is less than half a percent in favor of the simple estimator (Table 1). Half a percent difference is not much when considering that the mean perception accuracy is about 35% worse than either of the estimators (Table 1). It follows from these results that there is a negligible difference in accuracy between the two estimators.
5.
CONCLUSIONS
Referring back to Section 1, the hypothesis states that if all actions are categorized and the mean time is measured for each category based on a large user sample, then an estimator could utilize these times to estimate the com-plexity of any pair of interactions with better accuracy than the accuracy of human perception. The findings in this research indeed support the hypothesis. In the follow-ing sub sections answers will be given to the research sub questions as formulated in Section 1.
5.1
Relevant Data
What kind of interaction data could be relevant for such an estimator (Section 1)? One type of relevant interaction data for such an estimator is any kind of interaction data which affects action times and which is known at the time of the design of the interaction. Examples of such data in this research are the mouse distance of the clickers and the length of the texters both of which are used by the advanced estimator. In practice, both of these data types could be known at design time and not dynamically
gen-erated during an interaction execution. Other examples of such data are font size, font color, element size, clickable area size, input length, input character set, etc.
Another type of relevant interaction data for such an esti-mator is any kind of human action which duration could be estimated. Examples of such data used in this research are:
• time/mouse • time/hover • time/click • distance • time/keyboard • time/submit • length
5.2
Data Utilization
5.3
Estimator Accuracy
What would be the accuracy of such estimators relative to the accuracy of user perception (Section 1)? In the sample of 43 students and a total of 255 interaction pairs, both the simple and the advanced estimator had a consis-tently larger accuracy than the human perception and in the 10%-15% TDR interval, both estimators already have a consistent minimal accuracy of 90%. Furthermore, as discussed in Section 4, there is an indication that human perception could be affected by distractions and memory recall and since in this research the comparisons were in-tentionally made to be the most recently experienced two interactions, in practice human perception accuracy could be even lower. These are promising findings which indi-cate that at a fundamental level, the proposed method-ology has potential and further research could test the methodology using more complicated, varied and world-like experiments.
The advanced estimator had great accuracy even though the simple estimator had the advantage of using param-eters with lesser overall sample deviation. These results are promising, because the simple estimator takes advan-tage of the fact that the elements are mostly consistent, but if the elements vary as it happens in practice, then the deviations may get large enough that the estimator becomes practically useless. However, the deviations in user responses are expected to be consistent (such as typ-ing speed) regardless of the interactive elements. In other words, the advanced estimator which has the potential to scale had about as good an accuracy as the simple estima-tor.
5.4
Potential Extensions
Only the fundamental principles of the methodology pro-posed in Section 1 are investigated in this research. The reason is that if potential extensions are tested together with the fundamental principles and the results are nega-tive, then it would not be clear if it is due to the utilized hypothetical extensions, or because the methodology is flawed at a fundamental level. While the methodology in its simplest form is not of much use, this research provides promising results together with potential extensions which could address some practical issues. In this sub section, a couple of potential extensions are proposed.
5.4.1
Parallel Actions
Referring back to Section 1, it was mentioned that the methodology assumes sequential actions. In practice, how-ever, certain actions happen in parallel. For example the mouse action ’drag-and-drop’ requires holding a button and moving the mouse. Another common parallel action is holding a key such as SHIFT, CTRL or ALT and press-ing another key at the same time. One way to solve this problem is to serialize actions, i.e consider SHIFT+key (press and hold shift and press key) as a single action and measure it in addition to measuring keys in general. Alter-natively, if the mean times for pressing a key in general is known, then human behaviour could be modelled based on assumptions or even better - observations. Once the be-haviour is modelled then it will also reveal how the mean time of pressing a key could be used to estimate pressing SHIFT+key. A similar problem and solution were done in this research as well, namely, the time/keyboard and time/mouse interpretations for the advanced estimator in which assumptions were made regarding human behaviour and an estimator was built using relevant data.
5.4.2
Comparison Criteria
Not any two interactions could be compared. For exam-ple, a file submission interaction could be compared with a file submission interaction which also has a CAPTCHA, but there is no base for comparing it with a login interac-tion. The key here is that interactions can be compared if there is at least some overlap in purpose and the compari-son is an answer to the question ”Which interaction better fulfills this particular purpose?”. If there is no overlap in purpose, then neither of the interactions has the potential to take some of the responsibility of the other. For this problem both simple and complex models could be made. An example of a simple model is giving a unique purpose identifier to each interaction and modelling the fulfillment of the purpose as a boolean, i.e it is either fulfilled in the end or not. An example would be - ”After a login interac-tion, the user is either fully authenticated or not at all”. Alternatively, fulfillment could be modelled as a percent-age if booleans are not expressive enough. In Section 1 this was omitted, but it was taken into an account dur-ing the research. In this research, all interactions had the same purpose ”Complete Experiment”. There was no re-ward associated with completing any of the interactions, in fact, participants were told that their goal is to complete all interactions as quickly as possible.
5.4.3
Priority Weights
Interactions often do not fully overlap in purpose. For ex-ample, a file submission with a CAPTCHA and one with-out a CAPTCHA both fulfill the purpose ”Submit a file”, but the former also fulfills the purpose ”Prevent Spam-ming”, a purpose which does not directly benefit the user. Considering this case, interactions could be modelled as having a set of purposes. If the complexity function is not adapted, then CAPTCHA will always add an additional interaction time and will be considered a worse alterna-tive. To solve this issue, weights could be applied to each action. In this research, weights are not utilized, i.e each action is 100% of its mean time. If weights are utilized, however, certain actions could be given more ’importance’ than other actions. Using weights could not only address the CAPTCHA spam protection, but also provide a way to prioritize target users, i.e differentiate advanced users from new users or differentiate users in terms of demographics, by assigning weights. This way, a global database could be built which has the mean times of a wide variety of ac-tions and people who design interacac-tions could adapt the action mean times to their own needs.
5.5
Prior Work
CogTool [3] is a popular tool for automatically estimating the complexity of an interaction and it is known to provide consistent and accurate results when the TDR is no less than 10%. The findings in this research also agree with this percentage. Even though the accuracy of both esti-mators is no worse than the human perception when the TDR is less than 10%, neither the estimators nor the hu-man perception are consistently higher than 76% which is not accurate enough to make a stable distinction between faster and slower interactions. For this reason, interaction pairs with TDR of less than 10% can indeed be marked as taking ’about the same time’ or ’undecided’ which is also how it is done in CogTool. Similar methodologies have been researched in the past and these findings fur-ther confirm the accuracy and practical usefulness of this approach to estimating interaction complexity.
[1] S. Card, T. Moran, and A. Newell. The psychology of human computer interaction lawrence erlbaum.
Hillside, NJ, 1983.
[2] S. K. Card, T. P. Moran, and A. Newell. The keystroke-level model for user performance time with interactive systems.Communications of the ACM, 23(7):396–410, 1980.
[3] B. E. John, K. Prevas, D. D. Salvucci, and K. Koedinger. Predictive human performance modeling made easy. InProceedings of the SIGCHI conference on Human factors in computing systems, pages 455–462. ACM, 2004.
[4] J. Lazar, J. H. Feng, and H. Hochheiser.Research methods in human-computer interaction. Morgan Kaufmann, 2017.
[5] A. Lodhi. Usability heuristics as an assessment parameter: For performing usability testing. In2010 2nd International Conference on Software Technology and Engineering, volume 2, pages V2–256–V2–259, Oct 2010.
[6] J. Nielsen. Usability assessment methods beyond testing. InUsability Engineering, page 207. An Imprint of Academic Press, 1993.
[7] J. Preece, H. Sharp, and Y. Rogers.Interaction Design: Beyond Human-Computer Interaction. Wiley, 2015.