http://wrap.warwick.ac.uk
Original citation:
Turner, Hugo C., Truscott, James E., Fleming, Fiona M., Hollingsworth, T. Déirdre,
Brooker, Simon J. and Anderson, Roy M.. (2016) Cost-effectiveness of scaling up mass
drug administration for the control of soil-transmitted helminths : a comparison of cost
function and constant costs analyses. The Lancet Infectious Diseases.
Permanent WRAP url:
http://wrap.warwick.ac.uk/77277
Copyright and reuse:
The Warwick Research Archive Portal (WRAP) makes this work of researchers of the
University of Warwick available open access under the following conditions.
This article is made available under the Attribution-NonCommercial-NoDerivatives 4.0
(CC BY-NC-ND 4.0) license and may be reused according to the conditions of the
license. For more details see:
http://creativecommons.org/licenses/by-nc-nd/4.0
/
A note on versions:
The version presented in WRAP is the published version, or, version of record, and may
be cited as it appears here.
Lancet Infect Dis 2016
Published Online
February 17, 2016 http://dx.doi.org/10.1016/ S1473-3099(15)00268-6
London Centre for Neglected Tropical Disease Research, London, UK (H C Turner PhD, J E Truscott PhD, F M Fleming PhD, Prof R M Anderson PhD); Schistosomiasis Control Initiative (F M Fleming), Department of Infectious Disease Epidemiology
(H C Turner, J E Truscott), School of Public Health, Faculty of Medicine, St Marys Campus, Imperial College London, London, UK; Mathematics Institute (T D Hollingsworth PhD)
and School of Life Sciences
(T D Hollingsworth), University of Warwick, Coventry, UK; and Faculty of Infectious and Tropical Diseases, London School of Hygiene & Tropical Medicine, London, UK
(Prof S J Brooker DPhil) Correspondence to: Dr Hugo Turner, Department of Infectious Disease Epidemiology, Faculty of Medicine, Imperial College London, London W2 1PG, UK
Cost-eff ectiveness of scaling up mass drug administration
for the control of soil-transmitted helminths: a comparison
of cost function and constant costs analyses
Hugo C Turner, James E Truscott, Fiona M Fleming, T Déirdre Hollingsworth, Simon J Brooker, Roy M Anderson
Summary
Background The coverage of mass drug administration (MDA) for neglected tropical diseases, such as the soil-transmitted helminths (STHs), needs to rapidly expand to meet WHO’s 2020 targets. We aimed to compare use of a cost function to take into account economies of scale to the standard method of assuming a constant cost per treatment when investigating the cost and cost-eff ectiveness of scaling up a STH MDA programme targeting Ascaris lumbricoides.
Methods We fi tted a cost function describing how the costs of MDA change with scale to empirical cost data and incorporated it into a STH transmission model. Using this cost function, we investigated the consequences of taking into account economies of scale on the projected cost-eff ectiveness of STH control, by comparison with the standard method of assuming a constant cost per treatment. The cost function was fi tted to economic cost data collected as part of a school-based deworming programme in Uganda using maximum likelihood methods. We used the model to investigate the total reduction in the overall worm burden, the total number of prevalent infection case-years averted, and the total number of heavy infection case-years averted. For each year, we calculated the eff ectiveness as the diff erence between the worm burden or number of cases and the number in absence of treatment.
Findings When using the cost function, the cost-eff ectiveness of STH control markedly increased as the programme was scaled up. By contrast, the standard method (constant cost per treatment) undervalued this and generated misleading conclusions. For example, when scaling up control in the projected district from 10% to 75% coverage of at-risk school-age children, the cost-eff ectiveness in terms of prevention of heavy burden infections was projected to increase by over 70% when using the cost function, but decrease by 18% when assuming a constant cost per treatment.
Interpretation The current exclusion of economies of scale in most economic analyses must be addressed if the most cost-eff ective policies for the control of neglected tropical diseases are to be formulated. These fi ndings are also relevant to other large-scale disease interventions.
Funding GlaxoSmithKline, Bill & Melinda Gates Foundation, Partnership for Child Development, and Wellcome Trust.
Copyright © Turner et al. Open Access article distributed under the terms of CC BY-NC-ND.
Introduction
Mass drug administration (MDA) is used to control many neglected tropical diseases (NTDs). This type of preventive chemotherapy targets all at-risk eligible individuals within defi ned age ranges. Although in 2012, 700 million people received at least one MDA round, this is only 36% of those in need of treatment.1 Since the
London declaration on NTDs in 2012,2 the availability of
donated drugs has dramatically increased and is no longer regarded as a major bottleneck to thecontrol and elimination eff orts of the included NTDs.3 However, the
scaling up of the implementation of MDA programmes remains the key obstacle to reaching the 2020 targets set by WHO and the London declaration.2–4 This issue with
scaling up implementation is particularly true for the soil-transmitted helminths (STHs), for which WHO has set goals to scale up MDA, so that by 2020, 75% of preschool and school-age children in need will be treated regularly (ie, annually where prevalence is 20–50% or biannually where prevalence exceeds 50%).2,4
MDA programmes have benefi cial economies of scale5–8—increasing the number treated reduces the cost
per treatment (panel). Such economies of scale arise because many of the costs associated with MDA are fi xed (ie, not dependent on the number treated) and therefore increasing the interventions output reduces the fi xed cost per treatment (panel). Furthermore, as programmes expand they are likely to become more effi cient through better organisation and learning by doing.5,12 Such economies of scale are not unique to
MDA and can also occur for other interventions.13
However, although accounting for economies of scale is recommended in economic assessments,14,15 because of
the absence of detailed cost data, most studies assume constant returns to scale12,16–19—ie, the cost per treatment is
constant, regardless of the number treated. Thus, with this assumption, the total cost of MDA would increase linearly with the number treated.
In view of this need to rapidly scale up MDA,1–4
programmes might be aff ected by these reported economies of scale, and assessment of the potential eff ect of ignoring them on policy recommendations, is important.
We aimed to use a STH transmission model to compare use of a cost function to take into account economies of scale to the standard method of assuming a constant cost per treatment when investigating the cost and cost-eff ectiveness of scaling up a STH MDA programme targeting Ascaris lumbricoides.
Methods
Model
We used a fully age-structured model of the transmission dynamics of STHs for this analysis.9,10 In this analysis, we
used the model parameters pertaining to A lumbricoides
to act as a case study (appendix).
We used the model to simulate a hypothetical district, with a total population of 200 000 individuals at risk of infection—chosen to take into account the full range of the cost data—and a school-based albendazole treatment pro gramme targeting school-age children (5–14 years old; about 32% of the total population).9,10 The assumed
age distribution pertains to sub-Saharan Africa and is based on Uganda’s demographic profi le.20 As in previous
analyses,9,10 three diff erent transmission settings were
investi gated—low (reproductive number [R0]=2),
medium (R0=3), and high (R0=5; panel).21 These
strati-fi cations diff er from the WHO prevalence categories for reasons described by Truscott and colleagues.9 The analysis was done by looking at one district to show the key principles clearly, although the conclusions would apply to national programmes as a whole.
Within the model, the number treated was varied by changing the treatment coverage of the school-age children at risk of infection within the district (panel). Based on the reported coverages from the districts where the cost data were collected,5 a maximum coverage of 95%
of school-age children was assumed within this analysis— the upper limit of the reported coverages. MDA does not include any previous diagnosis before treatment, so uninfected individuals would also be treated.
The effi cacy of albendazole against A lumbricoides, defi ned within the model as the proportion of worms expelled per treatment, was assumed to be 95%.22
Costs
We used a cost function that describes how the total cost per year of MDA changes with the number treated, g. Two terms exist within the function: α1, which represents the
fi xed costs (ie, those that are incurred, and do not change, regardless of how many are treated), and α2, which
represents the subsequent incremental cost per treatment
Research in context
Evidence before this study
Mass drug administration (MDA) programmes are used to control many neglected tropical diseases (NTDs). Although in 2012, 700 million people received at least one MDA round, this is only 36% of those in need of treatment, and the rate of scale up of MDA coverage needs to dramatically increase to achieve the 2020 targets set by WHO. Consequently, having a clear understanding how the cost and cost-eff ectiveness of MDA programmes might change with scale is vital. MDA
programmes have benefi cial economies of scale—ie, increasing the number treated by the programme reduces their cost per treatment. Despite widespread understanding of this notion, for economic assessments in this specialty to assume constant returns to scaleis nonetheless common practice—ie, the cost per treatment is constant, irrespective of how many are treated. We searched PubMed for the terms “economies of scale”, “cost-eff ectiveness”, and “mass drug administration”, with no date or language restrictions. We identifi ed no studies that investigated the implications of using cost functions taking into account economies of scale on the cost-eff ectiveness of scaling up MDA. When we broadened the search beyond MDA interventions, we identifi ed few cost-eff ectiveness studies that had included economies of scale, because of the absence of data. Therefore, assessment of the likely eff ect of this assumption on policy recommendations is essential to stimulate informed discussion in this specialty.
Added value of this study
The aim of this analysis was to use a soil-transmitted helminths (STHs) transmission model—focusing on Ascaris lumbricoides— to investigate the eff ect of taking into account versus ignoring economies of scale on the costs and cost-eff ectiveness of scaling up a STH MDA programme. We investigated two assumptions: the commonly used constant cost per treatment and use of a cost function fi tted to empirical data on a MDA programme, taking into account economies of scale. When using this cost function, the projected cost-eff ectiveness of the STH control programme markedly increased as it was scaled up to treat more people. By contrast, assuming a constant cost per treatment (ie, the standard method) undervalued the cost-eff ectiveness of scaling up MDA programmes and generated some misleading conclusions.
Implications of all the available evidence
The analysis shows the fundamental importance that taking into account economies of scale can have in economic assessments, and how the common practice of ignoring this aspect can have a detrimental eff ect on the conclusions, potentially biasing policy. Although this study focused on MDA programmes for control of NTDs, the fi ndings are also relevant to the assessment of other large-scale control interventions that might have economies of scale, such as vaccination programmes, vitamin A distribution programmes, and malaria control.
(ie, the variable cost). When deriving the cost per treatment from the cost function, the fi xed costs, α1, are divided by the
number treated, g, which consequently decreases the cost per treatment with increasing numbers treated,taking into account potential economies of scale.
The cost function was fi tted to economic cost data collected as part of a school-based deworming pro gramme in Uganda. The data were collected across six districts over 3 years from the perspective of the service provider, since the costs of accessing the intervention are likely to be negligible.5 The programme cost data were collected
through semi-structured inter views with district offi cials and by detailed examination of the programme accounting records in six intervention districts in Uganda.5 Both
fi nancial and economic costs were collected; economic costs include the opportunity cost of using existing Ministry of Health staff and teachers. The delivery cost data are organised into fi ve main cost types: (1) programme running costs; (2) community awareness activities; (3) training of delivery staff ; (4) drug registration and distribution; and (5) production of information, education, and com munication material.5 For this analysis, the unit
cost of albendazole (400 mg) was assumed to be US$0·02 (2014 prices).23 The fi tting of the cost function to the data
was done using maximum likelihood methods (appendix).
The diff erent cost components of the intervention were identifi ed using an ingredients-based approach, taking into account both the number of units and the prices of units in the local currency (Ugandan Shillings).5 The appendix includes a summary of the
data. The costs presented in the study by Brooker and colleagues5were adjusted for infl ation using the gross
domestic product implicit price defl ator and are
expressed in US$ 2014 prices.24
The cost function taking into account the economies of scalewas compared with the standard method of assuming a constant cost per treatment, b, taken as the mean of the data range ($0·85, of which $0·83 is for delivery).5 In this case, the
total cost per year was derived by multiplying the number treated per year, g, by this constant cost per treatment, b. This calculation assumes constant returns to scale.
Implementation period and time horizon
WHO recommends that interventions are assessed using a 10-year implementation period.14 However, this period
refers only to the timeframe across which the intervention is implemented. The time horizon for the analysis (in this case 50 years) is longer to account for the full benefi ts of the intervention, which can occur both during and after its period of implementation.14
Panel: Glossary
Basic reproductive number (R0)
The mean number of female worm off spring generated by a female worm in the absence of density-dependent or mate-availability constraints.
Coverage
The proportion of the targeted population—in this case school-age children at risk of infection—that are treated each treatment round.
Discounting
The process of adjusting the future values of costs and eff ects to show that society prefers to receive benefi ts sooner and pay costs later. The discount rate shows the strength of this time reference.
Diseconomies of scale
The increase in the mean cost per unit of output resulting from increased production (ie, the opposite to economies of scale). This can result from programmes expanding into harder-to-reach areas, which can be more expensive.
Economies of scale
The reduction in the mean cost per unit of output resulting from increased production. In this case, it refers to the reduction in the cost per treatment of an intervention as a result of increasing the numbers treated.
Economies of scope
The reduction in the mean cost per unit resulting from production of two or more products at once. In this case, it
refers to the reduction in the cost per treatment when delivering more than one intervention at once, such as when integrating diff erent control programmes.
Fixed costs
Costs that are not dependent on the quantity of output—ie, in this case, costs that are incurred or that do not change regardless of the number treated within a district. For example, many of the programme running costs at the national level would probably be incurred regardless of how many individuals are subsequently treated within any given district.
Force of infection
The mean number of incoming worms establishingper person per year—a metric for the level of ongoing transmission within the model.
Transmission breakpoint
The non-zero parasite density below which a parasite population cannot maintain itself and is driven into terminal decline and eventual elimination.9–11
Variable costs
Costs that vary in proportion to the quantity of the output—in this case costs that are dependent on the number treated. A key variable cost is that of the total cost of the drugs themselves, which would depend directly on the number of treatments given.
eff ect) were derived by dividing the total cost accrued during the implementation period by the total eff ects accumulated across the full time horizon.
These guidelines14 are based on the assessment of
morbidity control strategies. However, elimination strategies, which aim to stop transmission and make future control measures unnecessary, might need a longer timeframe to account for their long-term benefi cial eff ects.25 Therefore, within a subset of our
simulations, we also considered a longer implementation
eff ects of sexual reproduction and, as a result, elimination is a deterministically defi nable event.21 Elimination has
been achieved when mean worm burdens have fallen below a crucial threshold or, equivalently, the parasite burden continues to fall to zero in the absence of treatment. As recommended by WHO,14 a discount rate
of 3% was applied to both the costs and eff ects (panel). The sensitivity of the results to both the use of a 0% discount rate for eff ects and a rate of 6% for the costs was explored, based on WHO-Choice guide lines.14 Because
the eff ects and costs are still being discounted (panel) at 3% per year and are only taken into account within the 50-year time horizon, the projected benefi ts of elimination are not infi nite.
Eff ectiveness metrics
The model was used to investigate three diff erent
eff ectiveness metrics (modifi ed from Medley and
colleagues26) across the chosen time horizon: (1) the total
number of worm-years averted (ie, the number of years lived with a worm prevented); (2) the total number of prevalent infection case-years averted (ie, the number of years lived with a prevalent infection prevented); and (3) the total number of heavy infection case-years averted (ie, the number of years lived with a heavy infection prevented). Heavy burden was defi ned as having a worm burden above the age-specifi c thresholds for disease presented by Chan and colleagues27 (appendix). For
each year, we calculated the eff ectiveness as the diff erence between the worm burden or number of cases and the number in absence of treatment (appendix).
Role of the funding source
The funders of the study had no role in study design, data collection, data analysis, data interpretation, or writing of the report. The corresponding author had full access to all the data in the study and had fi nal responsibility for the decision to submit for publication.
Results
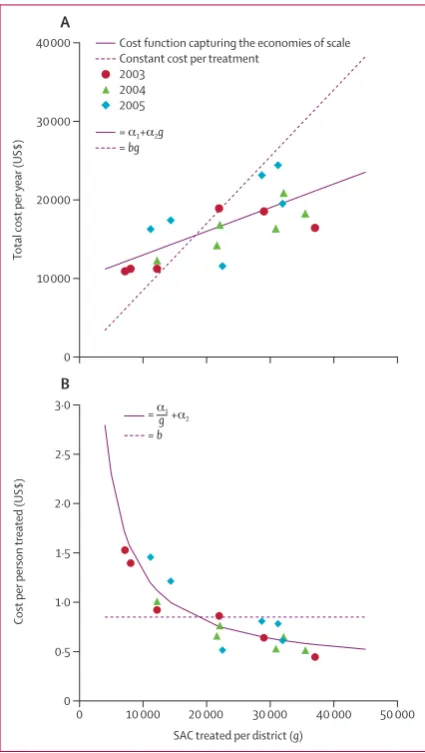
The cost function taking into account the economies of scale accounted well for the noted patterns in the cost data (fi gure 1). By contrast, the standard method of assuming a constant cost per treatment did not correspond well to the data; it substantially underestimated the total cost per year of treating a small number of individuals and over-estimated the total cost per year of treating a large number of individuals (fi gure 1A).
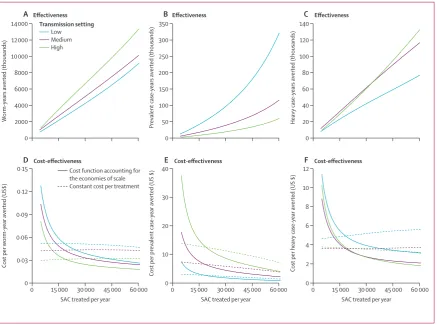
When using the cost function taking into account the economies of scale, the projected cost-eff ectiveness of MDA increased substantially as the number of at-risk school-age children treated within the district was scaled up. This pattern occurred because as treatment was scaled up, the increase in cost derived from the cost function (fi gure 1A) was smaller than the projected increase in the eff ects (fi gure 2A–C). As such, the cost-eff ectiveness ratio (ie, the 0
10 000 20 000 30 000 40 000
Cost per person
treated (US$)
0 1·0
0·5 1·5 2·0 2·5 3·0
0 10 000 20 000 30 000 40 000 50 000
SAC treated per district (g)
A
B
Total cost per
year (US$)
Cost function capturing the economies of scale Constant cost per treatment
2003 2004 2005
= α1+α2g = bg
=α1
= b
[image:5.595.119.332.260.637.2]g+α2
Figure 1: Estimated cost as a function of the number of at-risk school-age children treated within the district, with and without the cost function taking into account the economies of scale
Estimated total cost per year (A) and cost per person treated (B) are shown. The datapoints show the economic cost of a school-based delivery programme in Uganda (including a unit cost of albendazole of US$0·02 per treatment),23
collected across six districts over 3 years.5 The cost function was fi tted (α₁=9989,
cost per eff ect) decreased (fi gure 2D–F). This decrease resulted in an increase in the cost-eff ectiveness of control— scaling up control from 10% to 75% coverage of at-risk school-age children within our projected district increased the cost-eff ectiveness in terms of preventing heavy infections by over 70% (appendix). Because an assumed incremental cost per treatment is included within the cost function, the gain in cost-eff ectiveness with scale showed some diminishing returns and approached a maximum level, because the cost per treatment cannot decrease past the assumed incremental cost per treatment, α2 (fi gure 1B).
By contrast, when the economies of scale were ignored and a constant cost per treatment was assumed—the standard method—the projected cost-eff ectiveness remained relatively constant when scaling up treatment (fi gure 2D–F); it only increased slightly in terms of the cost per prevalent case-year averted (fi gure 2E) and even decreased in terms of the cost per heavy case-year averted (fi gure 2F). Thus, this standard assumption incorrectly undervalued the cost-eff ectiveness of scaling up MDA because, when assuming the cost per treatment is
constant, the total cost per year increased linearly with the number treated (fi gure 1A). Consequently, when scaling up treatment, the increase in both the eff ects (fi gure 2) and costs were similar, hence the ratio of the two remained constant. The cost-eff ectiveness in terms of prevalent case-years and heavy case-years averted (fi gure 2E and 3F) changed with scale, because of the non-linear gain in eff ects as the coverage of at-risk school-age children increased (fi gure 2B and 2C). 0
2000 4000 6000 8000 10 000 12 000 14 000
W
orm-years averted (thousands)
0 50 100 150 200 250 300 350
Prevalent
case-years averted (thousands)
0 20 40 60 80 100 120 140
Heavy
case-years averted (thousands)
A Effectiveness B Effectiveness C Effectiveness
0 0·03 0·06 0·09 0·12 0·15
0 15 000 30 000 45 000 60 000 SAC treated per year
Cost per
worm-year averted (US$)
0 10 20 30 40
0 15 000 30 000 45 000 60 000 SAC treated per year
Cost per prevalent
case-year averted (US $)
0 2 4 6 8 10 12
0 15 000 30 000 45 000 60 000 SAC treated per year
Cost per heavy
case-year averted (US $)
D Cost-effectiveness E Cost-effectiveness F Cost-effectiveness
Cost function accounting for the economies of scale Constant cost per treatment Low
Medium High
[image:6.595.41.479.127.452.2]Transmission setting
Figure 2: Eff ectiveness and cost-eff ectiveness of school-based mass drug administration
(A–C) Eff ectiveness and (D–F) cost-eff ectiveness of school-based mass drug administration as a function of the number of at-risk SAC treated within the district are shown according to eff ectiveness measure (appendix). The number treated was calculated by varying the treatment coverage of SAC at risk of infection within the district, with treatment coverage defi ned as the proportion of the targeted population (ie, SAC) receiving treatment. In (D–F) the smaller the cost-eff ectiveness ratio, the more cost eff ective mass drug administration is deemed to be. Results assume a 50-year time horizon, a period of implementation of 10 years (ie, ten annual treatment rounds), a 3% discount rate, and a total population size of 200 000 individuals, 32% of whom were SAC. SAC=school-age children.
Worm-years averted (thousands)
Prevalent case-years averted (thousands)
Heavy case-years averted (thousands)
Low 6963 201 62
Medium 7889 74 94
High 10 460 38 102
Results assume a 10-year implementation period (ie, up to ten annual treatment rounds), a 50-year timeframe, and 75% coverage.
[image:6.595.266.476.632.701.2]the overall reduction in worm burden and the number of heavy case-years averted—both metrics that are based on infection intensity—increased with the assumed level of pre-control endemicity or transmission intensity (table). By contrast, the total number of prevalent case-years averted—a measure based only on infection prevalence— decreased as the transmission intensity increased (table). This situation arose because of the non-linear relation between mean worm burden and prevalence (fi gure 3A), created by aggregated distributions of worm numbers (a large proportion of worms were in a small proportion of individuals); thus, at higher worm burdens, large changes in mean worm burden are likely to lead to only small changes in prevalence (fi gure 3A). Furthermore, annual
eff ective in terms of reducing the overall level of transmission within the population. This fi nding is shown by looking at the eff ect of control on the local force of infection (panel)—a measure of transmission—which decreased as the assumed level of transmission intensity was increased (fi gure 3B).
Because of these relations, the higher the transmission intensity, the higher the cost-eff ectiveness of the intervention in terms of the reduction in the overall worm burden and heavy infections averted (fi gure 2D and 2F). However, counterintuitively, the cost-eff ective-ness in terms of the number of prevalent case-years averted was higher the lower the level of transmission intensity (fi gure 2E).
The increase in cost-eff ectiveness in terms of heavy infections averted as the level of assumed transmission intensity was increased shows some diminishing returns (table). This fi nding occurred because in high-trans-mission settings, treatment of school-age children only does not eff ectively control the number of heavy infections.
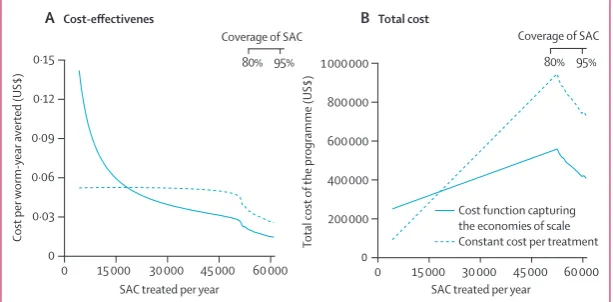
When we included a longer implementation period in areas with low transmission intensity (ie, 35 years instead of 10 years), the benefi ts of elimination within the 50-year time horizon of the analysis became apparent (fi gure 4). The potential for local elimination by chemotherapy alone is theoretically possible when worm levels become low enough for no one individual to harbour both a male and female worm, which means eggs are unfertilised and transmission is broken—ie, a transmission break-point (panel). Under these circum stances, the cost-eff ective ness increased at a faster rate as the coverage was scaled up (fi gure 4A). This fi nding occurred because, after elimination is achieved, the costs of future control are avoided. As coverage is increased, the time to elimination is reduced, generating a lower total cost (fi gure 4B). When falsely assuming a constant cost per treatment—the standard assumption—the total cost of scaling up control was overestimated (fi gure 4B).
Varying the discount rate had little eff ect on the projected cost-eff ectiveness of control (appendix) and the general conclusions remain unchanged. However, the choice of the discount rate for the costs had implications regarding the potential cost savings generated by reaching elimination (appendix); the higher the discount rate, the lower the potential cost savings.
Discussion
Because of economies of scale, the cost per treatment of MDA decreased with increasing numbers treated.
Consequently, projected cost-eff ectiveness of STH
control programmes markedly increased as they were scaled up to treat more at-risk school-age children. Although this analysis was done by investigating one district targeting primarily A lumbricoides as a case study, these conclusions can be applied more generally to
A B
0 25 50 75 100
0 5 10 15 20 25
Mean worm burden per person
0 5 10 15 20 25 30
0 2 4 6 8 10 12 14
Force of
infection
Treatment rounds
Infection prevalence (%)
Low Medium High
[image:7.595.29.331.297.455.2]Transmission setting
Figure 3: Relation between mean intensity and prevalence of infection, and projected eff ect of mass drug
administration on transmission
(A) The relation between mean intensity and prevalence of infection and (B) the projected eff ect of mass drug administration on transmission are shown. The line in (A) is described in the appendix. In (B), the force of infection is the mean number of incoming worms establishing per person per year—a metric for the amount of ongoing transmission within the model. Results assume 90% treatment coverage of school-age children. Only the fi rst 15 years of treatment are included to show the notion clearly.
0 200 000 400 000 600 000 800 000 1 000 000
0 15 000 30 000 45 000 60 000
Total cost
of
the programme (US$)
80% 95%
0 0·03 0·06 0·09 0·12 0·15
0 15 000 30 000 45 000 60 000
Coverage of SAC
SAC treated per year SAC treated per year
80% 95% Coverage of SAC
Cost per
worm-year averted (US$)
Cost function capturing the economies of scale Constant cost per treatment
A Cost-effectivenes B Total cost
Figure 4: Projected cost-eff ectiveness and total cost of an intervention in a low-transmission setting with a 35-year implementation period
[image:7.595.28.335.535.686.2]national STH programmes. This increase in cost-eff ectiveness has important impli cations for countries and donors that are con sidering scaling up MDA in line with the targets set by the WHO and the London declaration (appendix).2,4 These results also have
implications for MDA resource allocation for other NTDs that do not have widespread control.
By contrast, the standard method of assuming a constant cost per treatment undervalued the cost-eff ective ness of scaling up MDA and might even in correctly generate misleading conclusions. For example, when scaling up control in the projected district from 10% to 75% coverage of at-risk school-age children, the cost-eff ectiveness in terms of preventing heavy infections was projected to increase by over 70% when using the cost function, but decrease by 18% when assuming a constant cost per treatment (appendix). This analysis shows the funda-mental importance taking into account economies of scale can have in economic assessments, and how ignoring this aspect, which is done in most economic assessments, can have a detrimental eff ect on con clusions, potentially incorrectly aff ecting policy.28 This fi nding is particularly
relevant to NTDs because of the nature of the costs of MDA—many of which are fi xed, because the drugs themselves are often donated or inexpensive—but is also relevant to other large-scale control programmes.13
This research generated two other important con-clusions for resource allocation and programme planning. First, accounting for economies of scale when comparing the reported costs of diff erent alternative strategies is essential, since if ignored analyses might lead to incorrect assumptions regarding the relative costs of diff erent strategies, and concomitantly might lead to the use of suboptimum policies for MDA imple men-tation.29 Second, use of models that account for the
transmission dynamics of the parasite under MDA in any economic assessment, which can take into account the indirect eff ects of interventions, is desirable, as opposed to static models.30
Within this analysis, the potential costs and eff ects of expanding the coverage of school-age children beyond 95% were not considered, because the coverage would need to be extrapolated beyond the range of the data used to parameterise the cost function.5 In future studies, the
potential increase in costs and diseconomies of scale (panel)13,31,32 will be analysed as programmes are expanded
to cover harder-to-reach groups (eg, schools in remote areas and school-age children who do not attend the treatment days). The strength of these diseconomies of scale and the point at which they start to apply within a control programme will vary in diff erent areas, which is likely to have implications regarding the costs to achieve elimination and the most cost-eff ective strategy. As such, more detailed studies and cost of control measurements are needed in these groups.
In the modelled scenarios, elimination with a school-based strategy was only possible in areas with low
transmission intensity. To achieve elimination in areas with medium-to-high transmission requires an expansion of control beyond school-age children to include preschool and adults or an increased treatment frequency, or both.9,10
Although treatment of adults is likely to be more expensive initially, it will reduce the duration of programme needed, which ultimately is likely to lead to cost savings.33
In this analysis, we focused only on A lumbricoides to act as a case study. One should note that there remains uncertainty surrounding the parameterisation of the key epidemiological processes of STH transmission models. However, the fi ndings presented regarding the increase in cost-eff ectiveness preliminarily arose because of the non-linearity in the costs, and therefore these results are directly relevant to the other STHs (eg, hookworm and trichuris) and parameter estimates. However, elimination of hookworm and trichuris would not be possible in most settings with only an annual treatment programme targeting school-age children, because for hookworm most worms are harboured by adults, and for trichuris the treatment effi cacy of albendazole is lower than for
A lumbricoides.9,10,22 Consequently, treatment of school-age
children alone does not have as marked an eff ect on transmission compared with A lumbricoides.
The presented cost function relates only to a programme targeting only school-age children once per year. More cost functions were not explored because the dataset by Brooker and colleagues5 was the only
relevant one that could be identifi ed for a STH programme.8 These results highlight the need for further
cost data to be collected so that more comprehensive cost functions or predictive costing models can be developed to represent a range of diff erent settings, strategies, and potential diseconomies of scale.13,31,32 These should be
able to account for the potential diff erence between expansion of control by increasing coverage within a district, as shown herein, and expansion to new districts, because these are likely to have diff erent economies and diseconomies of scale. These cost functions should also include potential economies of scope (panel)—ie, how integration of diff erent control programmes might yield lower costs per treatment.6 The absence of cost data for
preschool children and adults constitutes a major barrier for further research regarding how best to optimise STH control and the development of further cost functions for the diff erent strategies.
A further need is for the STH specialty to decide which are the best eff ectiveness metrics by which to judge diff erent control strategies, since this is crucial when establishing the choice of intervention.8,34,35 Within this
debate, consideration of how diff erent programmatic objectives might need diff erent eff ectiveness metrics will be important.
cost-eff ectiveness of nationwide school-based helminth control in Uganda: intra-country variation and eff ects of scaling-up.
Health Policy Plan 2008; 23: 24–35.
6 Evans D, McFarland D, Adamani W, et al. Cost-eff ectiveness of triple drug administration (TDA) with praziquantel, ivermectin and albendazole for the prevention of neglected tropical diseases in Nigeria. Ann Trop Med Parasitol 2011; 105: 537–47.
7 Goldman AS, Guisinger VH, Aikins M, et al. National mass drug administration costs for lymphatic fi lariasis elimination.
PLoS Negl Trop Dis 2007; 1: e67.
8 Turner HC, Truscott JE, Hollingsworth TD, Bettis AA, Brooker SJ, Anderson RM. Cost and cost-eff ectiveness of soil-transmitted helminth treatment programmes: systematic review and research needs. Parasit Vectors 2015; 8: 355
9 Truscott JE, Hollingsworth TD, Brooker SJ, Anderson RM. Can chemotherapy alone eliminate the transmission of soil transmitted helminths? Parasit Vectors 2014; 7: 266.
10 Anderson RM, Truscott JE, Hollingsworth TD. The coverage and frequency of mass drug administration required to eliminate persistent transmission of soil-transmitted helminths.
Philos Trans R Soc Lond B Biol Sci 2014; 369: 20130435. 11 Anderson RM, Truscott JE, Pullan RL, Brooker SJ,
Hollingsworth TD. How eff ective is school-based deworming for the community-wide control of soil-transmitted helminths?
PLoS Negl Trop Dis 2013; 7: e2027.
12 Elbasha EH, Messonnier ML. Cost-eff ectiveness analysis and health care resource allocation: decision rules under variable returns to scale. Health Econ 2004; 13: 21–35.
13 Johns B, Torres TT. Costs of scaling up health interventions: a systematic review. Health Policy Plan 2005; 20: 1–13.
14 WHO. Making choices in health: WHO guide to cost-eff ectiveness analysis. Geneva: World Health Organization, 2003. http://www. who.int/choice/publications/p_2003_generalised_cea.pdf (accessed Jan 10, 2015).
15 Bill & Melinda Gates Foundation. Methods for economic evaluation project (MEEP). Appendices. Final report. http://www.nice.org.uk/Media/Default/About/what-we-do/ NICE-International/projects/MEEP-report-appendicies.pdf (accessed July 10, 2015).
16 Bishai D, McQuestion M, Chaudhry R, Wigton A. The costs of scaling up vaccination in the world’s poorest countries.
Health Aff (Millwood) 2006; 25: 348–56.
17 Hansen KS, Chapman G. Setting priorities for the health care sector in Zimbabwe using cost-eff ectiveness analysis and estimates of the burden of disease. Cost Eff Resour Alloc 2008; 6: 14. 18 Jamison DT, Breman JG, Measham AR,et al. Disease control
priorities in developing countries (2nd edn). Washington, DC: World Bank, 2006.
19 Kumaranayake L. The economics of scaling up: cost estimation for HIV/AIDS interventions. AIDS 2008; 22 (suppl 1): S23–33. 20 Pullan RL, Kabatereine NB, Quinnell RJ, Brooker S. Spatial and
genetic epidemiology of hookworm in a rural community in Uganda. PLoS Negl Trop Dis 2010; 4: e713.
21 Anderson RM, May RM. Infectious diseases of humans: dynamics and control. Oxford: Oxford Science Publications, 1991.
22 Vercruysse J, Behnke JM, Albonico M, et al. Assessment of the anthelmintic effi cacy of albendazole in school children in seven countries where soil-transmitted helminths are endemic.
PLoS Negl Trop Dis 2011; 5: e948.
23 Montresor A, Gabrielli AF, Diarra A, Engels D. Estimation of the cost of large-scale school deworming programmes with benzimidazoles. Trans R Soc Trop Med Hyg 2010; 104: 129–32. 24 International Monetary Fund. World Economic Outlook Database,
2014 http://www.imf.org/external/pubs/ft/weo/2014/02/weodata/ weoselgr.aspx (accessed Jan 9, 2015).
25 Thompson KM, Duintjer Tebben RJ. Economic evaluation of the benefits and costs of disease elimination and eradication initiatives. In: Cochi SL, Dowdle WR, eds. Disease eradication in the 21st century: implications for global health. Cambridge, MA: MIT Press, 2012: 115–30.
26 Medley GF, Guyatt HL, Bundy DA. A quantitative framework for evaluating the eff ect of community treatment on the morbidity due to ascariasis. Parasitology 1993; 106: 211–21.
in this context can produce counterintuitive and misleading conclusions, showing treatment to be more cost-eff ective in lower versus higher transmission areas, which poorly represents the eff ect of treatment on disease burden, which is related to heavy infections. This fi nding was also reported by Guyatt and colleagues.34
The best metric for assessment of the eff ect on morbidity within models might be heavy case-years averted, which can take into account the fact that a certain worm burden can have diff erent health consequences depending on the host’s age—just looking at the overall reduction in worm burden does not account for this. However, the numerical thresholds at which worms cause disease are surrounded with uncertainty, and probably depend on several host-specifi c factors.35
Furthermore, translating egg counts—how intensity is measured in practice—to number of worms can be diffi cult.36 By contrast, when assessing interventions
aimed at reducing transmission, metrics based on morbidity or heavy infections will be misleading, undervaluing the potential need to expand treatment to other age groups or increase the treatment frequency to reduce transmission.
These results support those of previous modelling studies9–11 that showed that when the programmatic aim
is to reduce transmission, as opposed to morbidity, targeting school-age children alone is unlikely to be suffi cient to achieve the desired results.9–11,33,37
Contributors
HCT did the analysis and wrote the fi rst draft of the manuscript. JET coded the model and did the parameter estimation. JET, FMF, TDH, SJB, and RMA contributed to the design of the study and writing of the manuscript. All authors read and approved the fi nal version of the manuscript.
Declaration of interests
RMA is a non-executive director of the board of GlaxoSmithKline. All other authors declare no competing interests.
Acknowledgments
HCT is supported by the London Centre for Neglected Tropical Disease Research through funding from GlaxoSmithKline. TDH and JET are supported by the Bill & Melinda Gates Foundation (#OPP1033751) and the Partnership for Child Development. SJB is supported by a Wellcome Trust Senior Fellowship in basic biomedical science (098045). RMA is supported by the Bill & Melinda Gates Foundation. We thankMartin Walker (Imperial College London, London, UK) for his comments on the preliminary versions of the results presented in this paper.
References
1 Uniting to Combat NTDs. Delivering on promises and driving progress. 2014 executive summary. http://unitingtocombatntds.org/ sites/default/fi les/document/executive_summary_v11_fi nal_ singles.pdf (accessed Jan 10, 2015).
2 Uniting to Combat NTDs. London declaration on neglected tropical diseases. Ending the neglect and reaching 2020 goals. 2013. http://unitingtocombatntds.org/downloads/press/ntd_event_ london_declaration_on_ntds.pdf (accessed Jan 10, 2015). 3 Uniting to Combat NTDs. From promises to progress: the fi rst
anniversary report on the London declaration on NTDs. 2013. http://unitingtocombatntds.org/resource/promises-progress-fi rst-report-london-declaration-ntds (accessed Jan 10, 2015).
27 Chan MS, Medley GF, Jamison D, Bundy DA. The evaluation of potential global morbidity attributable to intestinal nematode infections. Parasitology 1994; 109: 373–87.
28 Jacobs P, Baladi JF. Biases in cost measurement for economic evaluation studies in health care. Health Econ 1996; 5: 525–29. 29 Mansley EC, Dunet DO, May DS, Chattopadhyay SK, McKenna MT.
Variation in average costs among federally sponsored state-organized cancer detection programs: economies of scale?
Med Decis Making 2002; 22 (5 suppl): S67–79.
30 Turner HC, Walker M, French MD, Blake IM, Churcher TS, Basáñez MG. Neglected tools for neglected diseases: mathematical models in economic evaluations. Trends Parasitol 2014; 30: 562–70. 31 Johns B, Baltussen R. Accounting for the cost of scaling-up health
interventions. Health Econ 2004; 13: 1117–24.
32 Bishai D, Johns B, Lefevre A, Nair D, Simons E, Dabbagh A. Measles eradication versus measles control: an economic analysis.
Vaccines Vaccin 2012; S3: 002.
33 Turner HC, Truscott JE, Bettis AA, et al. An economic evaluation of expanding hookworm control strategies to target the whole community. Parasit Vectors 2015; 8: 570.
34 Guyatt HL, Bundy DA, Evans D. A population dynamic approach to the cost-eff ectiveness analysis of mass anthelmintic treatment: eff ects of treatment frequency on Ascaris infection.
Trans R Soc Trop Med Hyg 1993; 87: 570–75.
35 Brooker S. Estimating the global distribution and disease burden of intestinal nematode infections: adding up the numbers—a review.
Int J Parasitol 2010; 40: 1137–44.
36 Hall A, Holland C. Geographical variation in Ascaris lumbricoides
fecundity and its implications for helminth control. Parasitol Today
2000; 16: 540–44.