RESEARCH ARTICLE
GENETIC VARIABILITY AND CORRELATION STUDIES FOR GRAIN IRON CONCENTRATION AND
YIELD RELATED TRAITS IN RECOMBINANT INBRED LINES OF RICE (
Oryza Sativa
.L) GROWN
UNDER AEROBIC CONDITION
1,2
Rakhi Soman,
1,2Naveen kumar Gande,
1Rajeswari Ambati,
1Pavan J. Kundur,
1Ashwathanarayana, R.,
3Berhanu Dagnaw Bekele and *
1Shashidhar H. E.
1
Department of Plant Biotechnology, University of Agricultural Sciences, GKVK, Bangalore-560065,
Karnataka, India
2
Department of Biotechnology, Karpagam University, Coimbatore - 641021, Tamilnadu, India
3Department of Biotechnology, University of Gondar, P. O. Box: 196, Gondar, Ethiopia
ARTICLE INFO ABSTRACT
The present investigation was conducted to estimate genetic variability parameters and correlations that exist for grain iron concentration and yield attributing characters and also to identify transgressant lines based on grain iron concentration in rice. One hundred and sixty recombinant inbred lines (RILs) of IRRI38 X Jeerigesanna were grown under aerobic condition at University of Agricultural Science, Bangalore in augumented experimental design during wet seasons of 2011 and 2012.Grain iron concentration of RILs ranged from 7 to 24ppm. Nine transgressant lines were identified based on high iron concentration in grains, ranging from 14-24ppm. Analysis of variance revealed significant differences for all the traits. Grain iron concentration and grain yield per plant showed high phenotypic and genotypic coefficients of variation. Number of productive tillers per plant (r=0.55) and number of tillers per plant (r=0.46) exhibited significantly positive correlation with grain yield per plant. Grain iron concentration showed negative correlation (r = -0.004) with grain yield per plant. Path coefficient analysis indicated that number of productive tillers per plant (0.869) and number of tillers per plant (0.744) have positive direct effect on grain yield per plant. Grain iron concentration (-0.012) showed negative direct effect on grain yield. Therefore, breeding for high iron concentration and high yield should be executed separately.
Copyright © 2014 Rakhi Soman et al. This is an open access article distributed under the Creative Commons Attribution License, which permits unrestricted use, distribution, and reproduction in any medium, provided the original work is properly cited.
INTRODUCTION
Rice is considered as the grain of life for billions of people throughout the world. Being a staple food for most of the Asians, rice contains little micronutrients in the edible portion. Major nutritional problems in rice consuming countries comprise malnutrition and deficiencies of iron, zinc and vitamin A. Iron deficiency is the most common nutritional disorder in the world affecting over 4 billion people, with more than 2 billion people mainly in developing countries, actually being anemic (WHO, 2011). According to WHO (2008) an estimated 41% of pregnant woman and 27% of preschool children worldwide have anaemia. It often leads to impaired physical growth, mental development, and learning capacity (Cakmak et al, 2010). Although supplements added to food or taken in tablet form are effective in preventing and controlling iron deficiency, such treatments are difficult to implement in developing countries due to associated costs and small number
*Corresponding author: Shashidhar H. E.
Department of Plant Biotechnology, University of Agricultural Sciences, GKVK, Bangalore-560065, Karnataka, India
of primary health care programs. Hence there is an urgent and compelling need to develop rice varieties with improved content of micronutrients using biofortification. Iron is essential for photosynthesis, respiration and chlorophyll biosynthesis in plants and in humans.
It is a component in heme, the Fe-sulfur cluster, and an important catalytic centre in many enzymes. In normal healthy adults, some 0.5-2 mg of iron is lost each day due to blood loss and the constant exfoliation of iron-containing epithelial cells that line the gastrointestinal and urinary tract, skin and hair. Therefore, the same amount of iron from dietary sources is required each day to replace the lost iron and maintain body iron homeostasis (Sharp et al., 2007). Biofortification -breeding staples with high micronutrient content, has evolved as a new strategy to address micronutrient malnutrition (Virk and Barry 2009) and nutritional security. It relies on conventional plant breeding and biotechnology and holds great promises for improving the nutritional status and health of poor population in both rural and urban areas of the developing countries. Several studies have examined the feasibility of biofortification approach for improving the micronutrient (iron
ISSN: 0975-833X
International Journal of Current Research Vol. 6, Issue, 03, pp.5869-5874, March, 2014
INTERNATIONAL JOURNAL OF CURRENT RESEARCH
Article History:
Received 15thDecember, 2013 Received in revised form 10thJanuary, 2014
Accepted 14thFebruary, 2014 Published online 31stMarch, 2014
Key words: Biofortification, Rice, Micronutrients, Iron, Variability and Correlation.
RESEARCH ARTICLE
GENETIC VARIABILITY AND CORRELATION STUDIES FOR GRAIN IRON CONCENTRATION AND
YIELD RELATED TRAITS IN RECOMBINANT INBRED LINES OF RICE (
Oryza Sativa
.L) GROWN
UNDER AEROBIC CONDITION
1,2
Rakhi Soman,
1,2Naveen kumar Gande,
1Rajeswari Ambati,
1Pavan J. Kundur,
1Ashwathanarayana, R.,
3Berhanu Dagnaw Bekele and *
1Shashidhar H. E.
1
Department of Plant Biotechnology, University of Agricultural Sciences, GKVK, Bangalore-560065,
Karnataka, India
2
Department of Biotechnology, Karpagam University, Coimbatore - 641021, Tamilnadu, India
3Department of Biotechnology, University of Gondar, P. O. Box: 196, Gondar, Ethiopia
ARTICLE INFO ABSTRACT
The present investigation was conducted to estimate genetic variability parameters and correlations that exist for grain iron concentration and yield attributing characters and also to identify transgressant lines based on grain iron concentration in rice. One hundred and sixty recombinant inbred lines (RILs) of IRRI38 X Jeerigesanna were grown under aerobic condition at University of Agricultural Science, Bangalore in augumented experimental design during wet seasons of 2011 and 2012.Grain iron concentration of RILs ranged from 7 to 24ppm. Nine transgressant lines were identified based on high iron concentration in grains, ranging from 14-24ppm. Analysis of variance revealed significant differences for all the traits. Grain iron concentration and grain yield per plant showed high phenotypic and genotypic coefficients of variation. Number of productive tillers per plant (r=0.55) and number of tillers per plant (r=0.46) exhibited significantly positive correlation with grain yield per plant. Grain iron concentration showed negative correlation (r = -0.004) with grain yield per plant. Path coefficient analysis indicated that number of productive tillers per plant (0.869) and number of tillers per plant (0.744) have positive direct effect on grain yield per plant. Grain iron concentration (-0.012) showed negative direct effect on grain yield. Therefore, breeding for high iron concentration and high yield should be executed separately.
Copyright © 2014 Rakhi Soman et al. This is an open access article distributed under the Creative Commons Attribution License, which permits unrestricted use, distribution, and reproduction in any medium, provided the original work is properly cited.
INTRODUCTION
Rice is considered as the grain of life for billions of people throughout the world. Being a staple food for most of the Asians, rice contains little micronutrients in the edible portion. Major nutritional problems in rice consuming countries comprise malnutrition and deficiencies of iron, zinc and vitamin A. Iron deficiency is the most common nutritional disorder in the world affecting over 4 billion people, with more than 2 billion people mainly in developing countries, actually being anemic (WHO, 2011). According to WHO (2008) an estimated 41% of pregnant woman and 27% of preschool children worldwide have anaemia. It often leads to impaired physical growth, mental development, and learning capacity (Cakmak et al, 2010). Although supplements added to food or taken in tablet form are effective in preventing and controlling iron deficiency, such treatments are difficult to implement in developing countries due to associated costs and small number
*Corresponding author: Shashidhar H. E.
Department of Plant Biotechnology, University of Agricultural Sciences, GKVK, Bangalore-560065, Karnataka, India
of primary health care programs. Hence there is an urgent and compelling need to develop rice varieties with improved content of micronutrients using biofortification. Iron is essential for photosynthesis, respiration and chlorophyll biosynthesis in plants and in humans.
It is a component in heme, the Fe-sulfur cluster, and an important catalytic centre in many enzymes. In normal healthy adults, some 0.5-2 mg of iron is lost each day due to blood loss and the constant exfoliation of iron-containing epithelial cells that line the gastrointestinal and urinary tract, skin and hair. Therefore, the same amount of iron from dietary sources is required each day to replace the lost iron and maintain body iron homeostasis (Sharp et al., 2007). Biofortification -breeding staples with high micronutrient content, has evolved as a new strategy to address micronutrient malnutrition (Virk and Barry 2009) and nutritional security. It relies on conventional plant breeding and biotechnology and holds great promises for improving the nutritional status and health of poor population in both rural and urban areas of the developing countries. Several studies have examined the feasibility of biofortification approach for improving the micronutrient (iron
ISSN: 0975-833X
International Journal of Current Research Vol. 6, Issue, 03, pp.5869-5874, March, 2014
INTERNATIONAL JOURNAL OF CURRENT RESEARCH
Article History:
Received 15thDecember, 2013 Received in revised form 10thJanuary, 2014
Accepted 14thFebruary, 2014 Published online 31stMarch, 2014
and zinc) content of staple crops including rice and found that substantial useful genetic variation exists in key staple crops, nutritional quality traits are highly heritable in some crops, mineral rich traits are sufficiently stable across a wide range of growing environments and traits for high micronutrient content can be combined with superior agronomic and high yield characteristics (Brar et al., 2011). To release a variety commercially, various screening steps are required. With this viewpoint the present study was done to (a) screen a RIL population for grain Fe concentration in brown rice, (b) analyze the statistical correlation between grain Fe concentration and yield related traits and (c) identify transgressant lines containing high Fe concentration in grains.
MATERIALS AND METHODS
160 recombinant inbred lines including their parental genotypes IRRI38 and Jeerigesanna were used for the present study. All genotypes were grown in the experimental field of University of Agricultural Science, Bangalore under aerobic condition (Shashidhar et al., 2007) using Augmented Block design (Federer, 1961) during wet seasons 2011 and 2012. RILs and checks were raised by direct seeding with a spacing of 30 cm between the rows and 15 cm between the plants. The field management followed the recommended package of practices of UAS, Bangalore. Soil was fertilized with 5 t ha-1of FYM and NPK in the ratio of 100:50:50 kg/ha. Nitrogen was supplied in the form of urea at basal, 30 and 60 days after sowing as 50%, 25% and 25% respectively. P was provided as single super phosphate (16% P2O5) and K as muriate of potash (60% K2O). Plants were grown in available rainfall conditions and irrigation was done once in five days in the absence of rainfall. The data were recorded from middle rows for days to 50% flowering, days to maturity, plant height (cm), number of tillers per plant, number of productive tillers per plant, biomass per plant (g) and grain yield per plant (g) at respective stages of growth.
Sample preparation and iron concentration analysis
Seeds were harvested and hand threshed to avoid any metal contamination. Dehusking was done manually. Whole grains were collected and washed quickly with 0.1N HCl and then with sterile double distilled water to remove any surface contaminants and dried in hot air oven at 70oC for 72 h. Five grams of each sample were used for analysis. The iron content of seed samples was estimated by energy dispersive X-ray florescence spectrometry (EDXRF) at M. S. Swaminathan Research Foundation, Chennai. EDXRF was carried out using Oxford Instruments X-Supreme 8000 fitted with a 10 place autosampler (Paltridge et al., 2012). Measurement conditions
were as recommended by the users’ manual for analysis of Fe.
Calibration of instrument was done using standard samples of high, medium and low Fe containing genotypes. Total analysis time for each sample was 180 s which included 60 s acquisition times for the separate Zn and Fe conditions as well as 66 s
‘dead time’ during which the EDXRF established each
measurement condition. Scans were conducted in sample cups assembled from 21 mm diameter Al cups combined with polypropylene inner cups sealed at one end with 4 μm Poly-4
XRF sample film. Cups containing samples were gently shaken to evenly distribute grains. In 21 mm cups, minimum depths equated to≥ 4 g of grain for Zn analysis, and ≥ 2 g of grain for
Fe analysis, so sample mass was fixed at 4 g. X-Supreme 8000 scans a circle of 21 mm diameter with the sample spinner on.
Statistical Analysis
The analysis of variance for all the traits was tabulated using the software program AUGMENT 1 (Agrawal and Sapra, 1995). Genetic variability and correlation studies were computed using MS-Excel and SPSS 16.0 (SPSS Inc.) respectively. Path-coefficient analysis was analyzed with GENRES statistical software package (GENRES, 1994).
RESULTS
[image:2.595.313.554.409.518.2]160 RILs along with their parental genotypes IRRI38 and Jeerigesanna were analyzed for Fe concentration in brown rice in wet season of 2011 and 2012.The mean Fe concentration ranged from 7.20 ppm to 24.00 ppm with an average value of 11.30 ppm in both years. IRRI38 and Jeerigesanna showed 8.00 ppm and 13.60 ppm of Fe concentration in brown rice, respectively. Transgressant lines (Table 1) were selected from the present study based on high Fe concentration in grains. It has been observed that these RILs showed consistent values for higher Fe accumulation in grains ranging from 14-24 ppm in both seasons with relatively better grain yield.
Table 1. Transgressant lines selected from RILs based on grain iron concentration
RILs Mean grain iron concentration (ppm)
Mean grain yield per plant(g)
IRJS32 24.00 8.00
IRJS5 22.84 3.75
IRJS197 20.72 11.46
IRJS210 17.91 6.34
IRJS137 15.93 4.85
IRJS107 15.80 9.66
IRJS104 14.83 3.84
IRJS228 14.61 7.25
IRJS148 14.36 3.53
ppm:parts per million, g:grams
Analysis of Variance: Highly significant differences among
the RILs were observed for grain iron concentration and other yield related traits indicating presence of sufficient amount of variability for all the characters among the genotypes studied in wet season of 2011 and 2012.
Table 2. Estimates of genetic parameters for different traits in RILs
Trait Season Min. Max. Mean ± S.E GCV (%) PCV (%) h2 (%) GAM (%) DF WS11 82.00 119.00 98.06±0.60 30.97 31.59 96.1 62.54
WS12 73.00 118.00 88.53±0.70 7.16 29.02 6.08 3.63 DFF WS11 87.00 125.00 104.48±0.62 6.94 10.33 45.14 9.61 WS12 75.00 124.00 97.36±0.81 10.43 11.80 78.08 18.98 DM WS11 117.00 160.00 138.27±0.67 5.94 7.97 55.48 9.11
WS12 110.00 160.00 135.43±0.67 6.21 7.27 72.88 10.91 PH WS11 54.60 122.60 79.66±1.02 15.48 24.94 38.52 19.79 WS12 36.00 98.40 62.98±0.88 17.67 19.08 85.75 33.70 NT WS11 7.00 29.80 13.88±0.29 25.78 39.65 42.29 34.54 WS12 3.60 26.80 11.49±0.33 35.81 46.77 58.63 56.49 NPT WS11 5.20 27.20 12.18±0.27 26.60 39.03 46.45 37.34 WS12 2.60 20.60 9.60±0.30 39.16 45.81 73.07 68.96 BP WS11 18.20 116.20 49.51±1.52 38.50 42.65 81.51 71.61 WS12 4.20 69.60 23.84±0.93 411.00 470.56 76.29 739.49 GY(g) WS11 2.00 32.40 9.83±0.49 63.05 71.09 78.64 115.17 WS12 0.20 32.00 4.65±0.38 103.06 109.16 89.13 200.43
Fe WS11 4.1 31.2 9.34±0.22 31.01 29.05 87.73 56.05
WS12 8.2 37.8 13.28±0.26 25.47 24.88 95.44 50.08 HI WS11 2.20 71.10 20.69±0.92 56.30 63.17 79.43 103.36
WS12 0.60 68.40 18.50±1.03 69.09 92.08 56.30 106.79
[image:3.595.69.529.339.447.2]DF: Days to flowering, DFF: Days to 50% flowering, DM: Days to maturity, PH: Plant height (cm), NT: Number of tillers per plant, NPT: Number of productive tillers per plant, BP: Biomass per plant (g), GY: Grain yield per plant (g), Fe: Grain iron concentration (ppm), HI: Harvest Index, WS11: Wet season 2011, WS12: Wet season 2012, PCV: Phenotypic coefficient of variation; GCV: Genotypic coefficient of variation; h2: Heritability in broad sense, GAM: Genetic advance as percent mean
Table 3. Phenotypic correlation coefficients for different traits in RILs (n=160)
DF DFF DM PH NT NPT BP GY HI Fe
DF 1 0.87** 0.69** -0.23** -0.27** -0.34** 0.01 -0.31** -0.37** 0.13 DFF 0.87** 1 0.68** -0.24** -0.35** -0.40** 0.01 -0.36** -0.38** 0.09 DM 0.64** 0.67** 1 -0.26** -0.39** -0.43** 0.02 -0.30** -0.32** 0.14 PH -0.18* -0.30** -0.29** 1 -0.02 0.06 0.29** 0.15 -0.01 -0.01 NOT -0.37** -0.41** -0.31** 0.33** 1 0.92** 0.39** 0.33** 0.11 -0.04 NPT -0.48** -0.54** -0.40** 0.42** 0.91** 1 0.44** 0.46** 0.22** -0.06 BP -0.31** -0.34** -0.20* 0.57** 0.59** 0.59** 1 0.33** -0.18* 0.11 GY -0.45** -0.47** -0.29** 0.36** 0.46** 0.55** 0.59** 1 0.82** -0.004
HI -0.42** -0.43** -0.28** 0.14 0.22** 0.36** 0.16* 0.81** 1 -0.1 Fe -0.03 -0.04 -0.16* -0.13 -0.08 -0.1 -0.14 -0.04 0.05 1
*Significant at 5%, ** significant at 0.01%. Above half diagonal, values on the table indicate correlation coefficients in wet season 2011.Below half diagonal, values on the table indicate correlation coefficients in wet season 2012. Note: DF: Days to flowering, DFF: Days to 50% flowering, DM: Days to maturity, PH: Plant height (cm), NT: Number of tillers per plant, NPT: Number of productive tillers per plant, BP: Biomass per plant (g), GY: Grain yield per plant (g), Fe: Grain iron concentration (ppm), HI: Harvest Index.
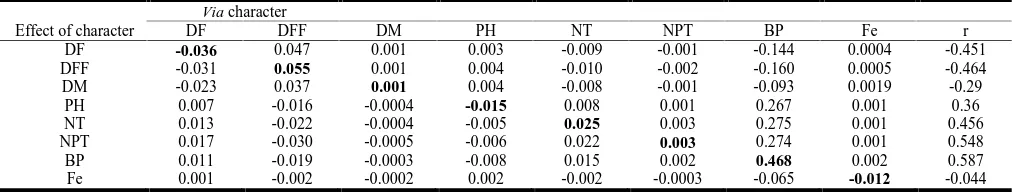
Table 4. Path coefficient analysis for different traits of RILs grown in wet season 2011(n=160)
Via character
Effect of character DF DFF DM PH NT NPT BP Fe r
DF 0.056 -0.241 -0.029 0.012 0.174 -0.292 0.006 0.003 -0.312 DFF 0.048 -0.276 -0.029 0.012 0.225 -0.344 0.001 0.002 -0.36
DM 0.038 -0.187 -0.043 0.013 0.249 -0.373 0.003 0.003 -0.296 PH -0.013 0.067 0.011 -0.050 0.016 0.055 0.059 -0.0003 0.146 NT -0.015 0.096 0.016 0.001 -0.651 0.803 0.078 -0.001 0.327 NPT -0.019 0.109 0.018 -0.003 -0.601 0.869 0.090 -0.002 0.462 BP 0.002 -0.001 -0.001 -0.014 -0.248 0.383 0.205 0.003 0.327 Fe 0.007 -0.025 -0.006 0.0006 0.027 -0.054 0.022 0.024 -0.004
Diagonals bold indicate direct effects
Table 5. Path coefficient analysis for different traits of RILs grown in wet season 2012(n=160)
Via character
Effect of character DF DFF DM PH NT NPT BP Fe r
DF -0.036 0.047 0.001 0.003 -0.009 -0.001 -0.144 0.0004 -0.451 DFF -0.031 0.055 0.001 0.004 -0.010 -0.002 -0.160 0.0005 -0.464 DM -0.023 0.037 0.001 0.004 -0.008 -0.001 -0.093 0.0019 -0.29
PH 0.007 -0.016 -0.0004 -0.015 0.008 0.001 0.267 0.001 0.36 NT 0.013 -0.022 -0.0004 -0.005 0.025 0.003 0.275 0.001 0.456 NPT 0.017 -0.030 -0.0005 -0.006 0.022 0.003 0.274 0.001 0.548 BP 0.011 -0.019 -0.0003 -0.008 0.015 0.002 0.468 0.002 0.587 Fe 0.001 -0.002 -0.0002 0.002 -0.002 -0.0003 -0.065 -0.012 -0.044
[image:3.595.46.552.508.606.2] [image:3.595.45.551.648.744.2]with respect to all the characters studied in RILs grown in wet season of 2011 and 2012 were shown in Table 2. The characters under study exhibited high, moderate and low PCV and GCV values. PCV and GCV were highest(>20%) for grain iron concentration (25.47P, 24.88G), grain yield per plant (42.65P, 38.5G), number of tillers per plant (46.77P, 35.81 G) number of productive tillers per plant (45.81 P, 39.16 G), biomass per plant (71.08P, 63.04G) and harvest index (63.17P, 56.3G). Moderate values (10-20%) of PCV and GCV were tabulated for days to 50% flowering (11.8P, 10.43G) and plant height (19.08P, 17.67G). Low values of PCV and GCV were recorded for days to maturity (7.27P, 6.21G). High heritability coupled with high genetic advance as percent mean were observed for days to flowering (h2- 96.1,GAM-62.54), plant height (h2-85.75, GAM- 33.7), number of productive tillers per plant (h2- 73.07, GAM-68.96), biomass per plant (h2- 78.64, GAM-115.16), grain yield per plant (h2- 81.51, GAM-71.61), harvest index (h2- 79.43, GAM-103.36) and grain iron content (h2- 87.73, GAM-56.05). High heritability coupled with moderate genetic advance as percent mean were observed for days to maturity (h2- 72.88, GAM-10.91) and days to 50% flowering (h2- 78.08, GAM- 18.98).
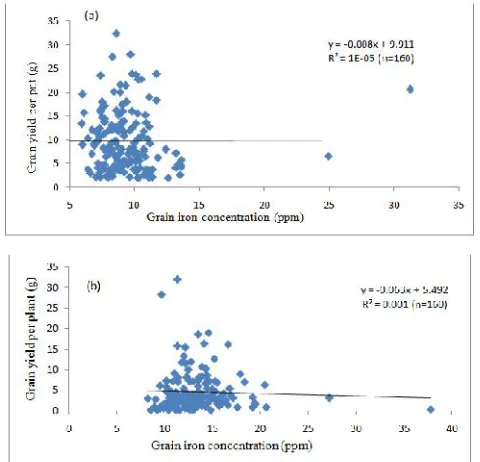
Correlation for grain Fe concentration and yield related traits
Highly significant and positive correlation were observed for number of productive tillers per plant with number of tillers per plant (r = 0.92), biomass per plant (r = 0.59) and grain yield per plant (r = 0.55). Also, grain yield per plant showed significant positive correlation with number of tillers per plant (r = 0.46) and biomass per plant (r = 0.59) whereas grain Fe concentration showed non-significant correlation with all the biometric characters studied (Table 3). Assessment of the relationship between grain Fe concentration and grain yield per plant using linear regression also showed negative correlation between these traits (Fig 1 a and b).
Fig. 1a & b. Relationship between grain iron concentration and grain yield per plant in RILs a) Grown in wet season 2011 and b) Grown in
wet season 2012. n = Number of recombinant inbred lines
Path coefficient analysis
In wet season 2011, the number of productive tillers per plant (0.869) and in wet season 2011, the number of productive tillers per plant (0.869) and in wet season 2012, harvest index (0.744) showed highest positive direct effect on, showed highest positive direct effect on grain yield per plant followed by biomass per plant (0.117) and days to fifty percent flowering (0.055). Among the indirect effects, the number of tillers per plant had highest positive indirect effect on grain yield per plant via number of productive tillers per plant (0.803) and biomass per plant (0.275) in wet season 2011 and 2012 respectively. Grain Fe concentration showed low direct effect (0.024, -0.012) and negative indirect effect on grain yield per plant via other characters in both seasons respectively.
DISCUSSION
Generating and exploiting genetic variability are two important unavoidable factors for crop improvement. According to Allard (1960), the potentiality of a breeding process depends on the extent of variability generated in different quantitative traits as it indicates the extent of recombination for effective selection. Crop improvement programmes in majority of the self pollinated crops depends mainly on hybridization (Manickavelu et al., 2006).In the present study, RILs were developed as a result of hybridization of an early maturing, semi-dwarf variety IRRI38 (a line from IRRI, Philippines) with a late maturing, tall, local line Jeerigesanna and forwarded to F8 generation with single seed descent method without any selection. Hence they exhibited genetic variability which observed earlier in the population. The RILs obtained also exhibited variability in grain Fe concentration and grain yield per plant adapting to aerobic condition. Considerable genetic variation observed among RILs in ANOVA (analysis of variance) for all the agronomic characters including grain Fe concentration, suggested that the parents used in the cross were genetically different. The Fe concentrations showed significant transgressive segregations with values either more or lesser than those of the parents. In this study, nine best stable transgressive segregants for grain Fe concentration (>14ppm) were identified by the phenotypic evaluation of RILs in wet seasons of 2011 and 2012 (Table 1).
[image:4.595.45.285.483.714.2]action of genes. High heritability coupled with high genetic advance as percent mean recorded for the characters indicated that genotypes plays most important role than the environment in determining the phenotype suggesting predominance of additive gene effects in the inheritance of the traits. Hence, simple selection in the segregating generation would be fairly effective for their improvement. Concomitant results were reported by Balan et al (1999), Bidhan et al. (2001) and Gangashetty et al. (2013). The traits which expressed high heritability coupled with moderate genetic advance suggested that these traits were primarily under genetic control and selection for these traits can be achieved through their phenotypic performance. Highly significant and positive correlations existing between different traits can be used to conduct indirect selection of a desired complex trait in a breeding program. Similar results for highly significant and positive correlation for grain yield per plant with number of tillers per plant was also reported by Akinwale et al. (2011). Non-significant correlation of grain Fe concentration with grain yield per plant was reported by Nagesh et al. (2012) supporting our data. Xia H et al. (2013) also reported negative correlation of maize grain Fe concentration with grain yield.
Path coefficient analysis reveals the direct and indirect effects of various quantitative traits and grain Fe concentration on grain yield per plant. The results given in Table 4 and 5 reveals the highest positive direct effect of number of productive tillers per plant and harvest index on grain yield per plant. Similar results were also reported by Panwar et al. (2007), Nagesh et al. (2012) and Gopikannan et al. (2013) for highest positive effect of number of productive tillers per plant on grain yield per plant. Supriyo (2010) elucidated high direct effect of harvest index on grain yield in Boro rice. In the present study, grain Fe concentration showed low to negative effects on grain yield in two seasons consistently. Nagesh et al. (2012) reported negative direct effect of grain Fe concentration on grain yield per plant which is in accordance with our data. Also, Chakraborthi et al. (2009) reported the absence of direct and indirect effect of grain Fe concentration on grain yield in maize. These findings indicated that grain Fe concentration had no contribution towards grain yield and hence this trait cannot be used as selection criteria for improvement in grain yield. Instead selection based on number of productive tillers per plant, harvest index and biomass per plant can be adopted for enhancement of grain yield as it showed positive direct effect on grain yield per plant.
Conclusion
Overall, the present study revealed high genetic variability among the RILs for grain Fe concentration and yield attributing characters. Superior transgressant lines showing promising improvement in grain Fe concentration have been identified. Grain Fe concentration showed negative correlation with grain yield per plant. Hence breeding for high Fe concentration in grains and enhancement of grain yield should be executed separately. Number of productive tillers per plant had a higher direct effect on grain yield per plant whereas grain yield per plant had a negative direct effect on grain yield.
Acknowledgement
The authors acknowledge the Department of Biotechnology, New Delhi, India for the financial support (grant number
Ab/Ac: 8270) and University of Agricultural Science, GKVK, Bangalore, India for providing facilities to accomplish this study. We thank M. S. Swaminathan Research Foundation, Chennai, India for their support in estimation of iron using XRF and Karpagam University, Coimbatore, India for their constant support during the research period.
REFERENCES
Agrawal. R.C. and Sapra. R.L. 1995. AUGMENT 1: A microcomputer based program to analyze augmented randomized complete block design. Indian J. Plant Genet. Res. 8:61-69.
Akinwale. M.G., Gregorio. G., Nwilene. F., Akinyele. B.O., Ogunbayo. S.A. and Odiyi. A.C. 2011. Heritability and correlation coefficient analysis for yield and its components in rice (Oryza sativa L). Afr. J. Plant Sci., 5: 207-212. Allard, R.W. 1960. Principles of Plant Breeding.1stEdn. John
Wiley and Sons Inc., New York.
Ashok. K.T., Singh. S. K., Amita Sharma and Bhati. P.K. 2013. Appraisal of genetic variability for yield and its component characters in rice (Oryza sativa L.). Biolife, 1(3):84-89. Balan A., Muthiah A.R., and Boopathi S.N.M.R., 1999,
Genetic variability, character association and path co-efficient analysis in rainfed rice under alkaline condition. Madras Agric. J., 86: 122-124.
Bidhan R., Hossain M., Hossain F., and Roy A.2001. Genetic variability in yield components of rice (Oryza sativa L.),
Envt. and Ecol. 19: 186-189.
Bisne. R., Sarawgi. A.K. and S.B. Verulkar. 2009. Study of heritability genetic advance and variability for yield contributing characters in rice. Bangladesh. J. Agril. Res., 34: 175-179.
Brar. B., Jain. S., Singh. R. and Jain. R.K. 2011. Genetic diversity for iron and zinc contents in a collection of 220 rice (Oryza sativa. L) genotypes. Indian J. Genet., 71(1):67-73.
Cakmak I., Wolfgang H., Pfeiffer and Bonnie McClafferty. 2010. REVIEW: Biofortification of Durum Wheat with Zinc and Iron. Cereal Chemistry. 87(1):10-20.
Chakraborti, M., Hossain, F., Kumar, R., Gupta, H. S., & Prasanna, B. M., 2009. Genetic evaluation of grain yield and kernel micronutrient traits in maize. Pusa AgriScience, 32:11-16.
Chakraborty. R and Chakraborty. S., 2010.Genetic variability and correlation of some morphometric traits with grain yield in bold grained rice (Oryza sativa L.) gene pool of Barak valley. Am. Eurasian J.Sustain. Agric.4(1): 26-29.
Chakraborty. S, Das. P.K, Guha. B., Sarmah. K.K., Barman. B. 2010. Quantitative genetic analysis for yield and yield components in boro rice (Oryza sativa L.). Not Sci Biol 2(1), 117-120.
Federer. W.T., 1961.Augmented designs with one way elimination of heterogeneity. Biometrics, 20: 540-552.
Gangashetty. P.I., Salimath. P.M., Hanamaratti. N.G.2013. Genetic variability studies in genetically diverse non-basmati local aromatic genotypes of rice (Oryza sativa L.).Rice Genomics and Genetics. 4(2):4-8.
Gopikannan.M. and S.K. Ganesh .2013. Inter-Relationship and Path analysis in rice (Oryza sativa L.) under sodicity,
Indian Journal of Science and Technology.6(9).
Govindraj M., Selvi. B., Rajarathinam S. and Sumathi. P.,2011. Genetic variability and heritability of grain yield components and grain mineral concentration in India’s
pearl millet (Pennisetum glaucum. (L) R. Br.) accessions. African Journal of Food, Agriculture, Nutrition and Development .11(3):4758-4771.
http://www.who.int/nutrition/topics/ida/en, 2011.
Manickavelu A., Gnanamalar. R.P., Nadarajan N. and Ganesh S.K. 2006. Genetic variability studies on different genetic populations of rice under drought condition. J. Plant Sci., 1(4): 332-339.
Nagesh, V. Ravindrababu, G. Usharani and T. Dayakar Reddy, 2012.Grain iron and zinc association studies in rice (Oryza sativa L.) F1 progenies. Arch. Appl. Sci. Res. 4(1):696-702. Paltridge, N. G., Palmer, L. J., Milham, P. J., Guild, G. E., &
Stangoulis, J. C. 2012. Energy-dispersive X-ray fluorescence analysis of zinc and iron concentration in rice and pearl millet grain. Plant and soil, 361(1-2), 251-260. Panwar, A., Dhaka, R.P.S. and Kumar, V. 2007. Path analysis
of grain yield in rice. Advances in Plant Science.20: 27 –
28.
Priyanka.Y., Rangare. N.R., John Anurag. P. and Chaurasia. A.K. 2010. Quantitative Analysis of rice (Oryza sativa L) in Allahabad Agro Climate Zone. Journal of Rice Research.3 (1): 16-18.
Ravindra Babu. V., Shreya. K. Kuldeep Singh Dangi., Usharani. G. and Nagesh P.2012. Genetic variability studies for qualitative and quantitative traits in popular rice (Oryza sativa L.) hybrids of India. International Journal of Scientific and Research Publications, 2(6):121-125. Sharp. P., Srai. S.K. 2007. Molecular mechanisms involved in
intestinal iron Absorption. World J Gastroenterol; 13(35): 4716-4724.
Shashidhar. H.E., 2007. Aerobic rice: An efficient water management strategy for rice production. Food and Water Security in Developing Countries.pp:131-139.
Supriyo. C., Pradip. K.D, Biswajit. G., Kalyan K.S., Bhubaneswar. B. Quantitative Genetic Analysis for yield and yield components in Boro rice (Oryza sativa L.) Virk. P. A. R. M. I. N. D. E. R., & Barry. G. 2009. Biofortified
rice—towards combating human micronutrient deficiencies. SABRAO J. Breed. Genet, 41.
de Benoist B, McLean E, Egli I, Cogswell M, eds.2008. World Health Organization, Centres for Disease Control and Prevention. Worldwide prevalence of anaemia 1993-2005. Geneva, World Health Organization.
Xia Hai Yong, Zhao JianHua, Sun JianHao. Xue YanFang, Eagling Trstan, Bao XingGuo, Zhang FuSuo & LI long. 2013. Maize grain concentrations and above- ground shoot acquisition of micronutrients as affected by intercropping with turnip, faba bean, chickpea and soyabean. Sci China
Life Sci.56:823-834.