http://www.scirp.org/journal/jsemat ISSN Online: 2161-489X ISSN Print: 2161-4881
DOI: 10.4236/jsemat.2018.82004 Apr. 25, 2018 37 J. Surface Engineered Materials and Advanced Technology
Simulation of Hydrophobicity Evaluation
and Structural Optimization
Design Method for
Micro-Array Units
Yang Shen
1*, Ge Guo
2, Yafeng Zhang
3*, Yuan Lu
1, Xin Wang
11Army Artillery Air Defense Academy, Chinese People’s Liberation Army, Hefei, China
2Department of Border Defence Command, Army Academy of Border and Coastal Defence in Urumqi,
Urumqi, China
3Department of Equipment Support, Automobile NCO College, Army Military Transportation University, Bengbu, China
Abstract
In recent years, researches published on hydrophobic materials increase ra-pidly, wherein the method for changing hydrophobicity by modifying a mi-cro-array structure on the surface of the material also has been proposed. Of course, if it is possible for us to quantitatively analyse and evaluate hydropho-bicity of different structures of one certain material at first, this task will greatly optimize the design of actual structures. In this work, we used the al-gorithm for Laminar Two-Phase Flow, Horizontal-set method integrated in COMSOL to build two single-pore simulation structures in different shapes and simulated the behaviour of the liquid transition from Cassie-state to Wenzel-state during the impregnation process. After that, the intrinsic con-tact angle of Structure T (a porous structure with a T-shaped sectional profile) was obtained under a certain pressure which maintained liquids in Cas-sie-state. Meanwhile, two equilibrium states of the liquid-air interface as well as two different patterns of the equilibrium state disrupting were found in Structure R (a porous structure with a Chamfered T-shaped sectional profile). Simulation results show that the modelling method can be applied for simu-lating the hydrophobicity of different porous structures and optimizing the procedures for the design of the micro-array efficiently.
Keywords
Hydrophobic Materials, Micro-Array, Laminar Two-Phase Flow, Horizontal-Set Method, COMSOL
How to cite this paper: Shen, Y., Guo, G., Zhang, Y.F., Lu, Y. and Wang, X. (2018) Simulation of Hydrophobicity Evaluation and Structural Optimization Design Method for Micro-Array Units. Journal of Surface Engineered Materials and Advanced Tech-nology, 8, 37-48.
https://doi.org/10.4236/jsemat.2018.82004
Received: March 28, 2018 Accepted: April 22, 2018 Published: April 25, 2018
Copyright © 2018 by authors and Scientific Research Publishing Inc. This work is licensed under the Creative Commons Attribution International License (CC BY 4.0).
DOI: 10.4236/jsemat.2018.82004 38 J. Surface Engineered Materials and Advanced Technology with the better hydrophobic property, one method which has been studied and adopted is to manufacture a micro-array on the surface.
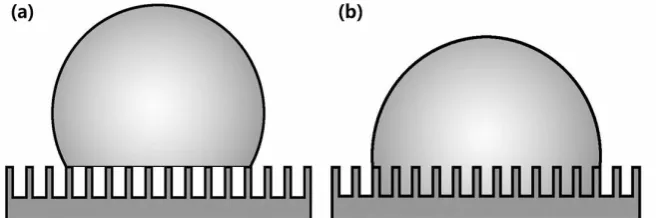
The design idea of the hydrophobic surface micro-array is adapted from the natural existence of the hydrophobic surface while a variety of hydrophobic ma-terial surfaces have been designed and manufactured. To study the behaviour of droplets spreading on a solid surface, Cassie and Wenzel firstly classified the infil-tration state into Cassie-state and Wenzel-state. Cassie-state is an ideal hydro-phobic state that the liquid is sheared up by a rough surface micro-structure [2]; nevertheless, the liquid can not fill up the pit on the surface but form compound contact because of the air trapped with the surface (shown in Figure 1(a)). Wenzel-state is that the liquid can completely fill up a rough surface while the actual contact area is larger than the apparent contact area (shown in Figure 1(b)) [3].
[image:2.595.209.539.591.700.2]Scholars have scientifically explained the hydrophobicity of various mi-cro-structures through mathematical modelling, which made hydrophobic theory continuously improve. B. Emami et al. proved that the cylindrical pore maximized the critical pressure [4]. Rene Hensel et al. fitted the microscopic structure on the surface of the Springtails skin and calculated the surface infiltra-tion of the liquid [5]. In addition, they proved that both the Mushroom-shaped cross-sectional pore and the Chamfered T-shaped cross-sectional hole had ex-cellent hydrophobicity. By transforming the concave structure of a Chamfered T-shaped hole into a convex structure and basing on a micro-fabrication process, Tingyi Liu et al. obtained an array of surface micro-structures, which made the hydrophilic silica surface exhibit excellent super-hydrophobic charac-teristics [6]. Takahiro Koishi et al. simulated the infiltration behaviour of water droplets composed of a large number of water molecules on the surface of a
DOI: 10.4236/jsemat.2018.82004 39 J. Surface Engineered Materials and Advanced Technology modified micro-array based on molecular dynamics simulations [7]. Jie Xiao et al. simulated the adhesion behaviour of water droplets on the surface of the modified micro-array when there was wind blowing [8]. It could be said that further improvement of theories mentioned above could provide an important reference for the design of hydrophobic micro-array.
Apparent contact angle is a macroscopic representation of the droplet infiltra-tion behaviour influenced by intrinsic contact angle near each unit of the array, which can reflect hydrophobic of the material. Therefore, it can provide guiding significance for grasping the whole retention of droplets on the surface and a ba-sis for the surface design. Necessarily, to tracing the liquid-gas transitional sur-face, we used Horizontal-set method integrated in COMSOL to define horizon-tal-set function φ (always regarded as the volume fraction of the liquid phase in the transitional region) transferring from the liquid phase (φ = 1) to the gas phase (φ = 0). The gas-liquid transitional surface can be calculated by Equation (1) [9].
(
1)
t
ϕ ϕ γ ε ϕ ϕ ϕ ϕ
ϕ
∂ + ⋅∇ = ∇ ⋅ ∇ − − ∇
∂ u ∇ (1)
In the equation, ε represents the thickness of defined transition surface; γ represents reinitialization parameter whose value is generally set as the maxi-mum flow velocity of the liquid; u represents the fluid velocity.
Figure 2 shows a surface micro-pore model of the array applied for the simu-lation analysis. It can be seen that the plane of the model is a concave structure; actually, the structure is prepared on the whole surface of the materials generally with the nether base closed. When sufficient amount of fluid a minority of mi-cro-units are covered under sufficient amount of fluid, the pressure in the pore will go larger as the increase of the fluid entering, which generally makes the material hydrophobic. However, in order to provide some convenience for the design of the non-pore convex array, the nether base of the pore will not be closed but connect to the air (shown in Figure 2(b)) and the structural profile is T-shaped (shown in Figure 2(c)). When the droplet is on the surface, the final stability of droplets will be affected by its gravity, the gas pressure in the pore, and the infiltration of the solid-liquid surface. If droplets are finally in Cas-sie-state (shown in Figure 3(a)), the liquid will flow as Figure 3(b) and Figure 3(c) show. When the liquid enters into the cylindrical pore and the liquid gravi-ty, capillary force, Young’s pressure, and air pressure in the pore all reaches an equilibrium state, the liquid will form stable droplets in the pore. The other sec-tion profile in this paper is Structure R, of which the nether surface is not closed.
2. Simulation Details
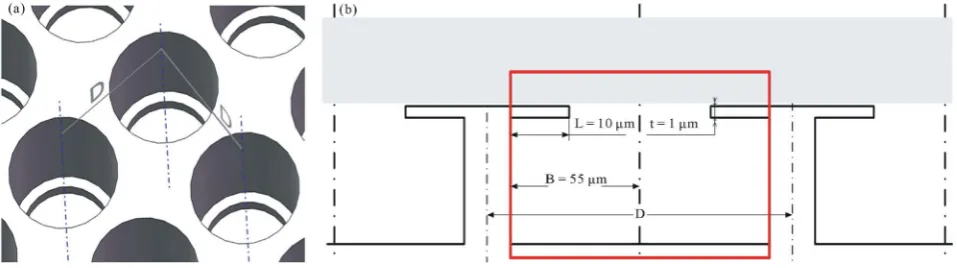
DOI: 10.4236/jsemat.2018.82004 40 J. Surface Engineered Materials and Advanced Technology Figure 2. (a) Top view of the surface of the array; (b) Partial enlarged drawing of the back of the array; (c) Sectional drawing of the structure.
Figure 3. (a) Shape of the droplet in Cassie-state; (b) Original state between the droplet and the pore; (c) Stable state after the droplet entering into the pore.
Figure 4. (a) View of the nether surface of the array; (b) Sizes of the microarray unit.
[image:4.595.59.538.398.532.2]DOI: 10.4236/jsemat.2018.82004 41 J. Surface Engineered Materials and Advanced Technology
2.1. The establishment of the Structure T model
Figure 5 and Figure 6 separately shows the rotating symmetrical three-dimensional model and the two-dimensional model (inflexion-point 1 marked at the end of the structure) of one unit of the array. We defined the target liquid as water and different contact angles of the humid wall to represent for different materials at first. Then, if only considering the gravity of droplets and the inlet pressure or-der of 102/Pa, we defined the water pressure at the inlet; However, we observed that the order was so small as to make the result in conformity with the present literature, which further explained merely considering the gravity was not accu-rate. So we set the value to a larger order of 102/Pa at last [5]. When the apparent contact angle was larger than 90˚, the droplet was a fixed volume.
[image:5.595.210.538.358.689.2]When applying Horizontal-set method to analyse the interface between the liquid and the gas, we defined the thickness of the liquid-gas transition surface ε as 5 × 10⁻⁷ m. As the thickness value of the liquid-gas transition surface was larger, whether inflexion-point 1 is the right angle or the round angle had no difference [10]. Considering the manufacturing process of the structure while to observe three-phase contact line, we set inflexion-point 1 as a chamfer of which the radius was 0.2 μm.
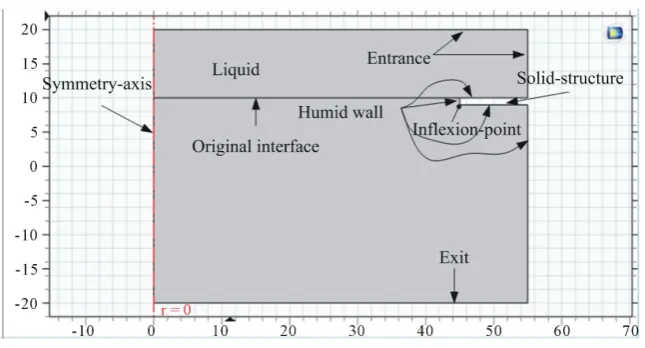
DOI: 10.4236/jsemat.2018.82004 42 J. Surface Engineered Materials and Advanced Technology Figure 6. 2-D view of the model.
2.2. The Establishment of Structure R Model
Figure 7(a) and Figure 7(b) separately shows the rotating symmetrical three-dimensional model and the two-dimensional model. The model estab-lishment process is similar to Structure T. The angular thickness of Structure R t equals 1 μm, the angular height h equals 4 μm and the length of the structure edge L equals 10 μm. The nether left corner is marked as inflexion-point 1, and the nether right corner is marked as inflexion-point 2.
3. Results and Discussions
3.1. The Results of Structure T Simulation
In the Structure T simulation model, we set the value of the inlet boundary pressure to be 1000 Pa and gradually increased intrinsic contact angle by the step distance of 0.5˚. The simulation results showed that three-phase contact line would firstly cross inflexion-point 1, after some reciprocating motion, it would finally keep balance at inflexion-point 1 when the intrinsic contact angle equalled 18.36˚ (shown in Figure 8, where blue represents the liquid and red represents the air).
When intrinsic contact angle was decreased to 17.86˚, the origin inlet boun-dary pressure would be larger so that the droplet could not form Cassie-state on the surface at all. Thus, three-phase contact line would firstly go forward to a longer distance and then backwards to inflexion-point 1; after that, it would move to the right boundary of the nether surface and continue to move. This implies three-phase contact line moved to the right boundary, thus the liq-uid-gas interface was unable to achieve an equilibrium state (shown in Figure 9, where blue represented the liquid and red represented the air).
DOI: 10.4236/jsemat.2018.82004 44 J. Surface Engineered Materials and Advanced Technology Figure 8. Oscillation of three-phase contact line near inflexion-point 1 at the angle of 18.36˚: (a) Time of 5.9 × 10⁻⁶ s; (b) Time of
54.62 × 10⁻⁵ s; (c) Time of 5.28 × 10⁻⁵ s; (d) Time of 1.21 × 10⁻⁴ s.
contact angle equalled 18.36˚; Also, its humid distance would be shorter after going cross inflexion-point 1 (shown in Figure 10, where blue represented the liquid and red represented the air).
3.2. The Results of Structure R Simulation
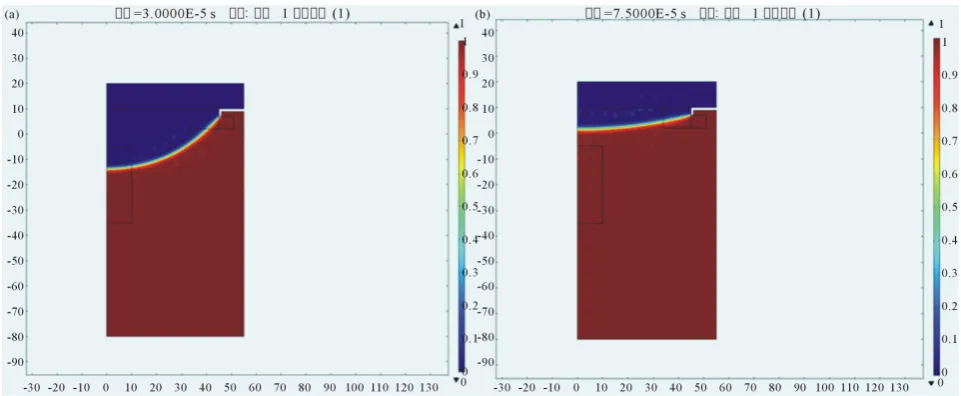
It could be seen that the equilibrium state at inflexion-point 1 was similar to that of Structure T in spite of different increasing thicknesses. As for inflexion-point 2, the inlet pressure was set to 1000 Paand intrinsic contact angle of the humid wall was 17.86˚. Owing to the thickness of the angle was smaller than the humid distance of three-phase contact line passing over inflexion-point 1 in Structure T, we observed three-phase contact line moved to inflexion-point 2 (not passed over it) then returned to inflexion-point 1; After that, it would not sustain oscil-lation until balance. Continuously reducing contact angle to 1˚ and 0.01˚, we observed the equilibrium state near inflexion-point 1 (shown in Figure 11 and Figure 12).
DOI: 10.4236/jsemat.2018.82004 45 J. Surface Engineered Materials and Advanced Technology Figure 9. Motion of three-phase contact line from inflexion-point 1 at the angle of 17.86˚: (a) Time of 4.5 × 10⁻⁵ s; (b) Time of
7.95 × 10⁻⁵ s; (c) Time of 1.03 × 10⁻⁴ s; (d) Time of 1.17 × 10⁻⁴ s; (e) Time of 1.43 × 10⁻⁴ s; (f) Time of 1.57 × 10⁻⁴ s.
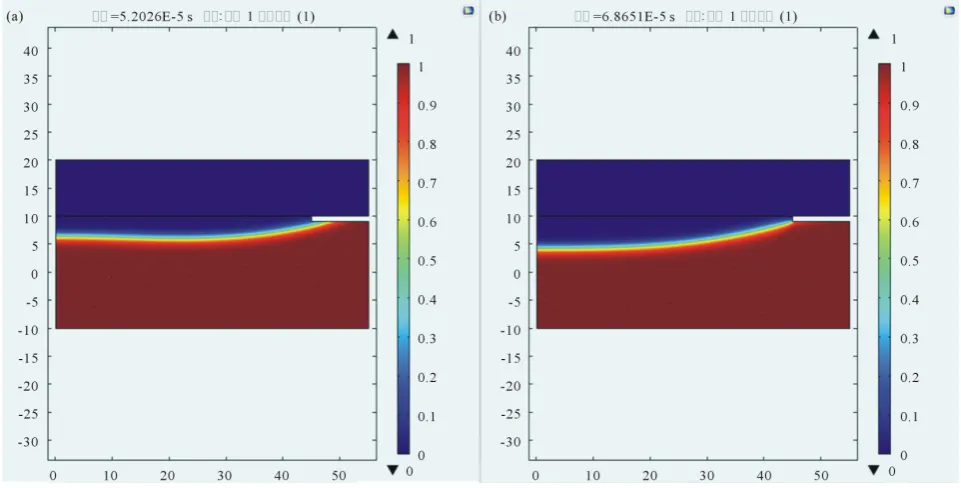
Figure 10. Motion of three-phase contact line from inflexion-point 1 at the angle of 18.86˚: (a) Time of 5.203 × 10⁻⁵ s; (b) Time of
[image:9.595.57.538.451.695.2]DOI: 10.4236/jsemat.2018.82004 46 J. Surface Engineered Materials and Advanced Technology Figure 11. Motion of three-phase contact line from inflexion-point 1 at the angle of 1˚: (a) Time of 4.0 × 10⁻⁵ s; (b) Time of 1.03 ×
10−4 s.
Figure 12. Motion of three-phase contact line from inflexion-point 1 at the angle of 0.01˚: (a) Time of 3.0 × 10⁻⁵ s; (b) Time of 7.5
× 10−5 s.
(shown in Figures 13(a)-(c)). When the inlet pressure reached to 2000 Pa, three-phase contact line could not cross inflexion-point 2 because of the gravity of the droplet, but returned to inflexion-point 1 then achieved an equilibrium state. When the inlet pressure reached to 2500 Pa, three-phase contact line would go across inflexion-point 2, and moved upward along with the inner wall of the chamfer, but could not achieve the equilibrium state. When the inlet pressure reached to 3000 Pa, the interface of the liquid-gas would contact the structural side wall and could not achieve the equilibrium state because of the large radius of the droplets.
4. Conclusions
[image:10.595.58.539.299.497.2]DOI: 10.4236/jsemat.2018.82004 47 J. Surface Engineered Materials and Advanced Technology Figure 13. Different states under pressures of 2000 Pa, 2500 Pa and 3000 Pa.
Figure 14. 2-D model for hydrophobicity comparison.
critical intrinsic contact angle by the inlet pressure valuing 18.36˚. Another, the inlet pressure needs to reduce with the decreasing of intrinsic contact angle.
2) As for the same material, the inlet pressure of Structure R whose liquid-gas interface reached to an equilibrium state was much larger than that of Structure T [6].
5. Future Prospects
Because the macroscopic wettability is affected by the solid/air ratio of the drop-let in contact with the engineered solid surface, we will further consider the spacing between adjacent pores and make clear how the intrinsic contact and surface tension are formulated.
DOI: 10.4236/jsemat.2018.82004 48 J. Surface Engineered Materials and Advanced Technology
bility of Air-Water Interface on Superhydrophobic Surfaces Comprised of Pores with Arbitrary Shapes and Depths. Applied Physics Letters, 100, 1-11.
https://doi.org/10.1063/1.3673619
[5] René, H., Ralf, H., Sebastian, A., et al. (2013) Wetting Resistance at Its Topographi-cal Limit: The Benefit of Mushroom and Serif T Structures. Langmuir: The ACS Journal of Surfaces & Colloids, 29, 1100-1112. https://doi.org/10.1021/la304179b
[6] Liu, T. and Kim, C.J. (2014) Repellent Surfaces. Turning a Surface Super repellent even to Completely Wetting Liquids. Science, 346, 1096-1100.
https://doi.org/10.1126/science.1254787
[7] Takahiro, K., Kenji, Y., Shigenori, F., et al. (2009) Coexistence and Transition be-tween Cassie and Wenzel State on Pillared Hydrophobic Surface. Proceedings of the National Academy of Sciences of the United States of America, 106, 8435-8440.
https://doi.org/10.1073/pnas.0902027106
[8] Jie, X. and Santanu, C. (2012) Design of Anti-Icing Coatings Using Supercooled Droplets as Nano-to-Microscale Probes. Langmuir, 28, 4434-4446.
https://doi.org/10.1021/la2034565
[9] Solved with COMSOL Multiphysics 5.0, Filling of a Capillary Channel: Level Set and Phase Field Models.
[10] Berthier, J., Loe-Mie, F., Tran, V., et al. (2009) On the Pinning of Interfaces on Mi-cropillaredges. Journal of Colloid and Interface Science, 338, 296-303.