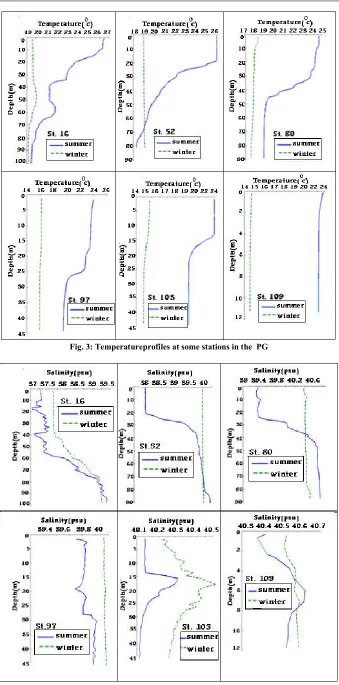
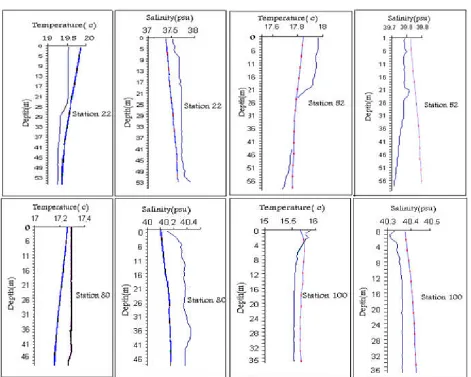
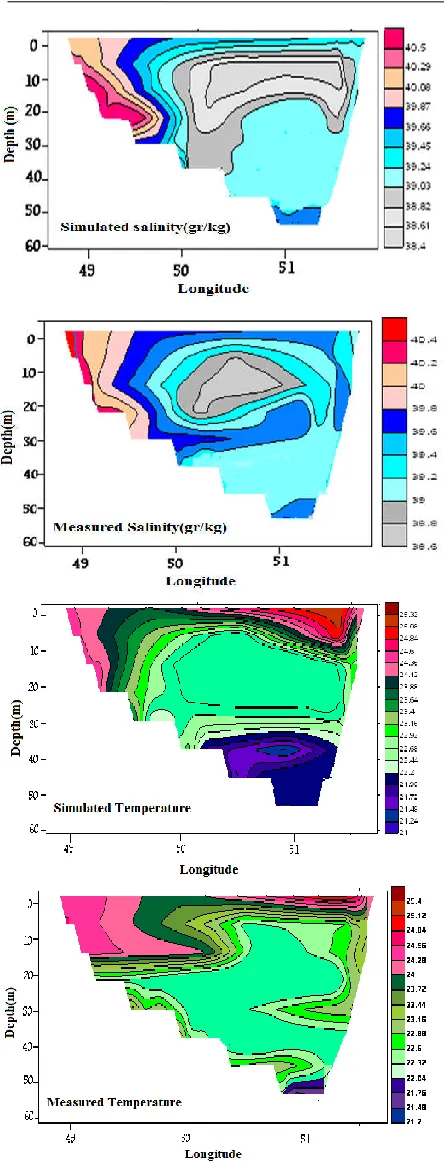
A numerical study of thermocline (case study: persian gulf)
Full text
Figure


Related documents
5.13 R134a frictional pressure drop in diabatic conditions for a range of heat fluxes on the Turbo-B5 and Gewa-B5 tubes plotted with outlet vapour quality to inspect the onset
Recommended Citation : Jack VanDerhei, “The Impact of Automatic Enrollment in 401(k) Plans on Future Retirement Accumulations: A Simulation Study Based on Plan Design Modifications
The STBF results for the optimized fillet geometry design showed an improvement in mean gear tooth bending fatigue strength exceeding 10%, based on limited testing—i.e., six
In the formal analysis, we consider an interbank market with heterogeneous banks and asymmetric observability of individual liquidity positions.. It is shown that an aggregate
With this thesis, we have attempted to tease out aspects of local labour market effects on commuting by asking two main questions: “to what extent does commuting enforce the
Time series of monthly mean cloud properties of Cloud_cci datasets, with thin lines being (from top to bottom) time series of monthly mean cloud fraction (CFC), liquid cloud
Three selected images are shown in Figure 6D-F, in which two principal effects are observed: creation of bubbles when the medium started evaporating (Figure 6E), and expansion and
