http://www.scirp.org/journal/jpee ISSN Online: 2327-5901
ISSN Print: 2327-588X
DOI: 10.4236/jpee.2017.511007 Nov. 30, 2017 80 Journal of Power and Energy Engineering
Numerical Design and Performance Analysis of
a Tug Boat Propulsion System
Samson Nitonye, Sidum Adumene, Ukpokpo Umorami Howells
Department of Marine Engineering, Rivers State University, Port Harcourt, Nigeria
Abstract
The aim of this project is to design and analyze the propulsion system for a tugboat for optimum performance. In so doing, certain approved procedures were followed; these procedures included getting the desired tugboat dimen-sion, using ITTC methods, Gertlers charts, Bp charts etc. to estimate the bare hull resistance of the tugboat, estimating the effective power that must be em-ployed to overcome this tug resistance. Numerical software code was devel-oped to determine the various performance indicators of the propulsion sys-tem. The effective power was used as a basis for selecting the main engine and designing of a suitable propeller capable of propelling the tugboat for the var-ious sea state were evaluated. Propeller cavitation was also put into considera-tion during this design. Hence in matching the engine to the propeller a series of calculations were done across a speed range of 300 - 500 rpm in other to ef-fectively ascertain the engine-propeller matching point. The result shows that the point of engine-propeller matching is at 335 rpm and 2550 KW respec-tively. This provides a guide for the selection of a main engine with an ac-ceptable sea service margins. All designs were done in accordance to classifi-cation organization and regulations.
Keywords
Tugboat, Propulsion System, Engines, Resistance, Effective Power, Speed
1. Introduction
The word Propulsion originated from the Latin words pro,which means before or forward, and pellere,whichmeans to drive. Propulsion systems comprise of all the components used in generating power, transmitting these power to the propeller via a shaft and reduction gear (as shown in Figure 1 and Figure 2), which in turn converts this power to thrust used in moving a vessel forward. How to cite this paper: Nitonye, S.,
Adu-mene, S. and Howells, U.U. (2017) Numer-ical Design and Performance Analysis of a Tug Boat Propulsion System. Journal of Power and Energy Engineering, 5, 80-98. https://doi.org/10.4236/jpee.2017.511007
Received: October 20, 2017 Accepted: November 27, 2017 Published: November 30, 2017
Copyright © 2017 by authors and Scientific Research Publishing Inc. This work is licensed under the Creative Commons Attribution International License (CC BY 4.0).
DOI: 10.4236/jpee.2017.511007 81 Journal of Power and Energy Engineering Figure 1. Propeller-Nozzle arrangement [5].
Figure 2. Propeller Shaft arrangement [6].
[image:2.595.66.536.307.482.2]con-DOI: 10.4236/jpee.2017.511007 82 Journal of Power and Energy Engineering ditions and during vessel breakdown etc. The importance of tugboat cannot be overemphasized in a region like the Niger Delta with vast coastal lines [4].
The effectiveness of a tug boat is characterized by its ability to tow and ma-neuver easily, which is a major concern in the marine industry. Most important factor is propulsive design is the interaction between the propeller and the noz-zle with the hull [5]. This research will seek for ways of solving that problem. It is also believed that this research work will be significant in terms of designing tugboats with low fuel consumption and operating cost.
1.1. Propulsion Systems and Design Parameters for Tugboats
Robert Wilson invented the screw propeller “after watching a soldier demon-strate on how paddle wheels could move a boat faster than oars, but in rough seas the paddle wheels became less effective was perplexed, again on seeing a windmill in operation made him wonder if a design like the blades of a windmill could be used to drive a boat”. By the time he left school at age nine, he had de-vised a model boat, which was propelled by rotating skulls. The forerunner of the screw propeller. Wilson later constructed a model boat and experimented with different numbers and designs of blades. He varied the blade’s area and pitch, always comparing them with his model paddle wheels [7].According to the society of Naval Architects and Marine Engineers “The de-sign of a marine propeller is almost invariably carried out by one or two me-thods. Although each method covers a number of procedures differing in details. In the first one, the design is based upon charts giving the results of open water efficiencies on a series of model propellers. These cover variations in a number of the design parameters such as pitch ratio, blade area, number of blades and section shapes: A propeller which conforms to the characteristics of any particu-lars series can be rapidly designed and drawn to such the required ship condition. The second method involves a loaded propeller prone to cavitation, or has to work in a very uneven wake pattern, when it is desirable to carry out a detailed design using circulation theory, they further stated that, this involves finding the chord width, section shape, pitch and efficiency at a number of radii to suit the average circumferential wake values and give optimum efficiency and protect cavitation [8].
1.2. Different Vessels and Their Propulsion Systems
1.2.1. Propulsion Systems for Naval Vessels (Warship)mili-DOI: 10.4236/jpee.2017.511007 83 Journal of Power and Energy Engineering tary operations and the diesel engines for cruising. Each is capable of delivering power to a controllable pitch propeller [9].
1.2.2. Propulsion Systems for Ferries (Double Ender)
The double ender ferry is another vessel with a unique propulsion system. It has an interesting design; one propeller and rudder at one end of the vessel. They are usually equipped with diesel engines to produce power. They are all coupled to a gear box by two air operated clutches. The shafts are quite long since they run through both ends of the vessel via the centerline; and are clutched as well, to allow both engines to drive one shafts or both with controllable pitch propellers, and two rudders, these types of vessels are very responsive with a service speed that is relatively high. These vessels are used for transporting large quantities of vehicles and passengers on short runs in calm waters [10].
1.2.3. Propulsion Systems for Icebreakers Vessels
Ice breakers are vessels used for icebreaking in deep waters, the pacific and At-lantic oceans. They require large horse power for their propulsion systems due to the work they perform. Icebreakers usually encounter shock loading from hit-ting big piece of ice; as such diesel engines were not really ideal as their prime movers. Hence, the diesel electric propulsion system allows these shocks to be filtered by the electrical machinery. The propulsion systems for icebreakers con-sist of medium speed engines, alternating current (AC) generators, and electrical motors driving two fixed pitch propellers. Fixed pitch propellers are used be-cause they are more durable and less likely to fail during ice breaking [11].
1.2.4. Propulsion System for a Cruise Ship
Cruise ships are mostly leisure vessels with large hotel loads and power require-ments. They are built for high degree of reliability with efficient systems with modern technology systems. Their propulsion systems are usually diesel-electric driven. The engines are mostly four-stroke medium speed engines due to their bigger size to power ratio. The propulsion system is made up of electrical motors which are built into pods controlled by cyclo-converters. The pods hang below the ship hull increasing their efficiency. Some cruise ships are installed with up to nine or ten identical medium speed diesel engines. All these engines supply a common electrical bus and the power needed for propulsion is simply tapped from the bus and delivered to the propellers [12].
1.2.5. Propulsion Systems for Special or Research Vessels
DOI: 10.4236/jpee.2017.511007 84 Journal of Power and Energy Engineering high speed of the engines and allow the propeller to turn at a more efficient slower speed. The controllable pitch propellers basically provide these vessels with great maneuverability and the quick response they require [13].
1.2.6. Propulsion System for LNG Vessels
LNG vessels with a boiling point of −161.5˚C at atmospheric pressure, is highly volatile and thus demands a containment system that can maintain a tempera-ture near or below its boiling point. However, a certain percentage of vapors called boil off gas that accumulate will increase the tank pressures. This increase in pressure if not released could lead to explosions. To solve this problem, the boil off gas is piped into the engine room for propulsion purpose. The propul-sion system for LNG consist of using boil off gases as fuels in boilers and the high pressure from steam turbines is used for propulsion. In recent times boil off gas are been adapted for use in diesel engines. Boil of gasses are also used for power generation and an electric motor is then connected to the propeller for propulsion [14].
1.2.7. Propulsion System for Tugboats
The power of a tug boat depends entirely on the propulsion system installed. Today the primary source of propeller power especially for tug boats is the diesel engine, the power required and rate of propeller revolution however depends on the shape and size of the tug hull and the design of the propeller. The term pow-er is used in the identification of marine diesel engines and intpow-ernal combustion engines in which the word “power” is referring to indicated power (Pi) and the brake power (Pb) generated by the engine. Generally the power generated by the combustion process in the engine cylinder is transmitted by the mechanical movement of the crankshaft to move the ship propeller via the propeller shaft [15].
Tugboat engines produces power ranging from 500 - 2500 KW (680 - 3400 HP). Since tugboats are designed to be highly maneuverable, different kinds of propulsion systems have been developed. Earlier tugboats used paddle wheels as their main propulsor, these days paddle wheels have been replaced with propel-lers such as the cycloid propeller, z-drive propeller, steer prop, etc. The propul-sion system of a tug boat consist mainly of the prime mover (diesel engine) with a reduction gear attached, and a shaft line connecting the gear box to the pro-peller which provides the thrust for propelling the tugboat. We effectively design the propulsion system of a tug boat, and show clearly the relationship between the prime mover, reduction gear box, shaft and the propeller, and how they re-late to the overall propulsion system of the tugboat, effectively select or design a suitable propeller for the prime mover etc [6][16].
DOI: 10.4236/jpee.2017.511007 85 Journal of Power and Energy Engineering to aid the maneuvering. It has been proven that the diesel electric propulsion show a less efficiency when compare with the diesel mechanical drive. Further observation revealed that the propulsive losses is higher in a diesel electric drive system that the diesel mechanicals [19][20]. In most modern propulsion sys-tems, research shows that a hybrid propulsion system proved to be more eco-nomically viable, especially in fuel consumption. To aid the performance of such complex configuration, computational control systems that monitor the system characteristic are installed [21]. Also for an effective yaw manoeuvres of the ves-sel, the thrusters are often grouped at the bow and stern of the vessels. The thrust output of the thrust is greatly influences by the propeller axis. Although, if the propeller axis coincides, the thrust is greatly reduced and therefore affect the advance coefficient of the propulsor [19][21]. This work therefore present a de-sign analysis of a mechanical drive tug boat propulsion system for extreme oper-ating conditions and optimal performance.
2. Materials and Methods
2.1. Research Methods
The methodology used in this research is the analytical method, Mathematical and engineering formulas, graphs and charts were also used in the design of the propulsion system for the tug boat at the end of the design C++ software was then
used for result validation and iterations.
2.1.1. Tug Resistance Estimation
The estimation of the resistance of any vessel can be done by various methods which are ITTC method, ATTC method, Gertlers chart method, Guldhammer, Harwld method, Mumford’s equations etc. however, for the purpose of this de-sign only the ITTC method and Gertlers chart method will be considered be-cause of their high power performance factor, the vessel tested by being broken down into separate pieces and other advantages [22]. We know every method has advantages and disadvantages concerning resistance estimation. Table 1 shows the design parameters for the tug boat and Table 2 shows the Model en-gine data.
Total tug resistance
2
1 2
T T w w s
R =C × ×
ρ
×S ×V [22] (1)But
T F R A
C =C +C +C (2)
Again,
(
)
20.75
log 2
F
e C
R =
− , (3)
s e
V L
R
γ ×
DOI: 10.4236/jpee.2017.511007 86 Journal of Power and Energy Engineering Table 1. Design parameters for the tug boat [23].
S/No
1 Length between perpendiculars (LPP) 42.12 m (138.19 ft)
2 Length over all (LOA) 45.72 m (150.0 ft)
3 Design draft T(keel) 5.73 m (18.8 ft),
4 Moulded Breath (MB) 10.05 m (33.0 ft),
5 Moulded depth (MD) 4.79 m (15.7 ft),
6 Gross Tonnage 279 Tonnes
7 Block Coefficient (CB) 0.500
Table 2. Model engine data [27].
Model Cycle Cylinders (mm) Bore Stroke (mm) Piston speed Mean (rev/min) Speed (kw/cyl) Output Out range (kw) Bmep (bar) (g/kwh) Sfoc
320NA 4 6v 114 127 10.2 153-262 16.9 211-220
3208TA 4 4v 114 127 10.1 2400-2800 40.5 153-264 16.9 213-245
3204NA 4 6v 114 127 10.1 2000-2200 18.8 173-265 16.9 213-246
3206T 4 6v 137 165 7.4 1800-2100 67.2 153-270 16.9 206-217
3406TA 4 6v 137 165 7.4 1200-1350 38.5 153-271 16.9 206-217
3516C 4 6v 114 784 9.2 1200-1800 35 1230-2525 16.9 206-222
3516TA 4 16v 170 190 7.2 1800 130.5 2088 16.1 200-208
3516TA 4 12v 170 190 8.2 130.5 895-1242 14.7 204-216
For maximum speed of hull
1.34
S
pp V
L = (4)
And Vs= Lpp×1.34
Hence 9
1170709486 10 e
R = × and CF =0.015011
R
C is gotten from Gertler’s chart using Froude’s number s n
V F
Lg = ,
16 0.514 150 9.81 n
F = ×
×
But CB
L B L ∇ =
× ×
At CB=0.500, ∇ =0.500 150 33 18.8× × ×
Similarly, 3 3
46530 150
L ∇ =
0.015011 0.64 0.004
T C
⇒ = + +
[image:7.595.56.547.271.429.2]DOI: 10.4236/jpee.2017.511007 87 Journal of Power and Energy Engineering 2
f
1.7 pp t
S L d
d ∇ × +
= (5)
Now substituting all the values into Equation (1), the value for RT can now be estimated.
2.1.2. Estimating Force of the Tug
The effective force needed to tow the tug at a given speed in smooth water is known as the resistance. This is given as FT =RT, and the power needed to overcome this resistance is the effective power (PE).
E T s
P =R ×V [24] (6)
But E D
D P P
η = (7)
And E D D P P η =
Similarly, D S
S P P
η = (8)
For the purpose of this design the engines will be located aft, then ηS = 0.98 or 98%.
Again, the engine brake power (PB) is given by,
S G
B P P
η = (9)
where ηG is the efficiency of the gearing system to be used, and for this design a mechanical gearing system will be used hence,
0.93 or 93%
G η = Engine speed = 1800rpm, PI =2525 kW
Since the engine is a high speed one, a reduction gear will be used.
Let N! = engine speed and N2 = propeller speed and the gear ratio I=4.5.
!
2
I N
N
= (10)
Hence, 2
1800 . 4.5
N =
2.2. Propeller Design
Preliminary calculated values for a twin screw propeller,
1) W=0.55CB−0.20 (11)
2) 1.67 2.3 B 1.5
B WL C
t C w
C
= − + ×
[24] (12) But CWL =CB+0.10 (13)
3) Va= −
(
1 w)
×Vs (14)DOI: 10.4236/jpee.2017.511007 88 Journal of Power and Energy Engineering
1 1
T s
E H
D a
R V
P t
P T V w
η = = × = −
× − [25] (15)
( )
0.52.5 D p
a N P B
V
= (16)
From Equation (16), we substitute different values of N to get the corres-ponding value of, using the value for ηO as a constant, I will be able to estimate the advance coefficient (δ ) and pitch to diameter ( P
D) ratio for a given blade number and blade area ratio. The following speeds from 300 - 500 rpm were used to calculate the values for pitch diameter, shaft power etc.
The result of all the parameters calculated so far is presented with respect to the range of speed. Also, a graph of shaft power vs number of revolution is pre-sented in Figure 3, so as to obtain the maximum possible diameter of the propeller needed for this design.
2.3. Design Calculation
For the chosen speed of 380 rpm,(
)
( )
0.52.5
380 2744
16
Bp= × (17)
Form the Bp−
δ
charts (4.55B) 198 δ =But Va.
D N δ × =
2.3.1. Correction of Diameter
0.94
D= D
a D N
V
[image:9.595.217.531.325.707.2]δ = × (19)
DOI: 10.4236/jpee.2017.511007 89 Journal of Power and Energy Engineering Now using Bp=19.44, and δ =186 from the Bp−
δ
4.55B series chart we obtain,
0.59
o
η = , P 0.69
D= and
E D D P P η =
From these parameters calculated in order to choose the correct blade area, it is necessary to apply the cavitations criterion. Table 3 shows the values for esti-mating cavitations criterion.
Values are gotten.
2.3.2. Cavitation Criterion (σ)
(
)
1(
)
20.7 0.7
2
O V
R P P P V R
σ
= = − = × [26] (20)But PO−PV =14.45 0.45+ h (21)
From simple cavitation diagrams, the value of TC corresponding to 0.24146 is 0.10.
0.10
C T ∴ =
( )
22 1 1 2 2 C R R T
Ap psl T
T l V
Ap l V
⇒ = = × × ×
× × (22)
2.3.3. Estimating the Thrust of the Tug
(
1)
T
R = − ×t T [24] (23)
1 T R T t ⇒ = −
But T 6.4976
Ap=
The disk area π 2
4
o D
A = (24)
0.90899 P D A A ⇒ =
Hence, 37937.7 0.91 41736
P
D A
A = = (25)
2.4. Calculation of Normal Propeller Curve
[image:10.595.209.539.674.727.2]To obtain the propeller curve, the power-speed relationship of the propeller will be used, which is also referred to as the propeller law.
Table 3. Values for estimating cavitations criterion [10].
Blade area ratio 0.40 0.55 0.70
Pitch ratio 0.98 1.0 0.99
DOI: 10.4236/jpee.2017.511007 90 Journal of Power and Energy Engineering 3
P=kn (26)
In order to linearize the above equation so as to make it easy for calculations, we take log of both sides of the equations,
3
logP logkn
⇒ = (27)
logP logk 3logn
∴ = + (28)
k can be determined by using the already calculated values for shaft power (PS) and speed (n) already obtained;
Hence, logP=logk+3logn
Making k the subject of the equation
logk=logP−3log .n
2.5. Calculation of Nominal Main Engine Curve
To obtain the main engine curve the power speed relationship of brake power is used and it is known as the main engine curve characteristics and is given below,
P= ×T ω [22] (29)
where P = brake power, T = thrust and ω = angular speed = 2πn
But from the propeller curve characteristics where the equilibrium position occurs, the power of the propeller equals power of the main engine at that speed.
Therefore, 3
k
T P n
P= × = =ω
3. Discussion of Results and Findings
The construction of the propulsion system for water borne craft requires esti-mating the hull resistance of the craft first, so as to enable us design an effective vessel with low resistance and maximize efficiency. In this design, we estimated the tug resistance (RT), which accounted for the total resistance of the tug in operation, and the effective power (PE) needed to overcome this resistance was evaluated.
Figure 3 indicates that the power supplied by the main engine is effectively put to use at (A) as this is the highest point of the graph. At point A the main engine will supply a power of 2088 KW (2799 hp) to effectively overcome the tug resistance and propel the ship forward, at a speed of 380 rpm. It is evident from the graph that from point 0 to A shows a corresponding increase in propeller rpm as the shaft power increase, but from point A to B shows a clear pattern of increase in propeller rpm even as the shaft power gradually decreases. Hence it can be deduced that for maximum efficiency and optimum system performance, the shaft power should be 2088 KW at a propeller rpm of 380 and having a di-ameter of 7.24 ft (2.2 m) as shown in Table 4.
DOI: 10.4236/jpee.2017.511007 91 Journal of Power and Energy Engineering Table 4. Values for shaft power and corresponding propeller rpm.
RPM 300 310 320 330 340 350 360 370 380 390 400 410 420 430 440 450 460
S
P 1896 1927 1957 1980 1990 2022 2042 2056 2088 2053 2000 1994 1988 1957 1979 2207 2167
reduction gear is used so that at any point in time the propeller is not over loaded. Also during matching, there must be power equality between the main engine and propeller for optimum propulsive efficiency. The matching must be done in such a way that engine power is equal to propeller power (PI =PD).
Equilibrium of operations is based on
1) Speed balance: This requires that the propeller speed must be equal to en-gine speed, by using a reduction gear for high speed enen-gines. Hence, rotational speed of engine is equal to rotational speed of propeller multiplied by the gear ratio (N1=N2×I).
2) Torque balance: Requiring that the torque necessary to rotate the propeller must be delivered into the shaft line. i.e. power = torque × angular speed (P= ×T ω).
3) Power compatibility: This requires that power generated by engine is equals power utilized by propeller plus power losses in the shaft line bearing. In practice, the propeller and the engine layout diagram are the basic tools of matching analysis.
The engine selected must be able to operate the propeller when loaded and when unloaded. In achieving this, the propeller law was used and values are shown in Table 5.
Figure 4 clearly shows the relationship between the engine and the propeller. The point C is where the straight line and the curve meet, this point is called the matching point, this is the point where all the power produced by the engine is effectively been absorbed by the propeller. In this design the suitable propeller rpm is 380rpm with engine power of 2837 kw and a propeller power of 2088 kw. In matching propeller to engine, we use the plots obtained for various propeller at maximum speed and try to match it to the different engine power from test bed. For a propeller to rotate at N1, it will require a power P1 and to maintain the engine at N2 we require a power of P2, it means that the higher the engine speed the higher the power produced. When an engine is operating beyond the maximum continuous rating (MCR) for more than 5mins the engine trips off. In practice however, the propeller/engine curve is converted into a linear graph byintroducing log to the power from the propeller law as shown in Equation (26) and (27).
DOI: 10.4236/jpee.2017.511007 92 Journal of Power and Energy Engineering Table 5. Rotational speed to brake power and shaft power.
N 300 310 320 330 340 350 360 370 380 390 400 410
3logN 7.431 7.474 7.515 7.555 7.594 7.6322 7.6689 7.7046 7.7394 7.7730 7.8062 7.838 logN 2.477 2.491 2.505 2.519 2.544 2.5563 2.5682 2.5798 2.2.579 2.5110 2.6020 2.612 logK −4.31 −4.31 −4.32 −4.32 4.318 −4.318 −4.318 −4.318 −4.318 −4.318 −4.318 −4.32 logP 3.113 3.156 3.197 3.238 3.276 3.31428 3.3508 3.380 3.3421 3.4554 3.4881 3.520
(kW)
B
P 1396 1541 1695 1858 1889 2062 2243 2433 2638 2850 3077 3313
(kW)
S
P 1896 1927 1957 1980 1990 2022 2042 2056 2088 2053 2000 1994
Figure 4. Graph of engine-propeller matching.
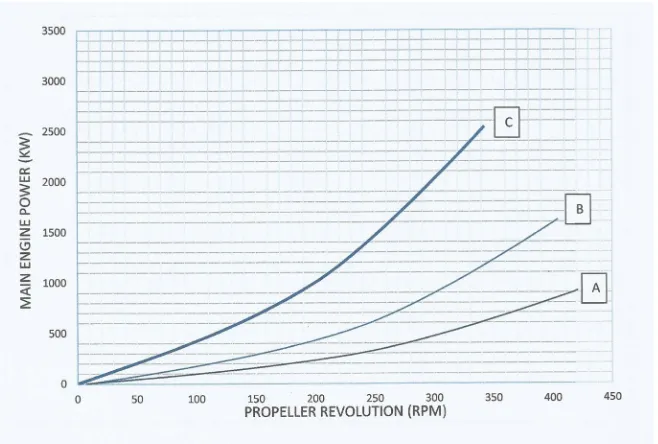
movement, fouling is also a factor that increases the resistance of the tug hull. Normally when estimating the necessary propeller power and speed, we use theoretical calculations for loaded ship and often experimental tank tests, both assuming optimum operating conditions, i.e. clean hull and good weather. The combination of speed and power obtained is mostly referred to as propeller de-sign point PD as shown by the curves on the graph below. Figure 6 show the propeller curve at three different engine rating (note: A indicates the Normal Continuous rating, B shows the Maximum Intermittent rating while C is the Maximum Continuous rating). The plot indicates a progressive increase in the rpm to a point of maximum rpm, then decrease gradually. This gives a guide on the propeller loading even at different operating state of the engine.
4. Conclusions
This work is to effectively and meticulously design the propulsion system of a twin-screw tugboat. The process for achieving this involves the effective match-ing and selection of the main engine and the propeller while puttmatch-ing into con-sideration the dimension of the tug boat.
DOI: 10.4236/jpee.2017.511007 93 Journal of Power and Energy Engineering Figure 5. Graph of main engine and propeller at different sea state.
Figure 6. Different engine curve characteristics.
DOI: 10.4236/jpee.2017.511007 94 Journal of Power and Energy Engineering part of tugboat owners. It is expected that this twin screw tugboat has 24 days maximum endurance, service speed of 16 knots, and a total number of 10 crew members but most times we see boat owners trying to overcrowd the boats.
References
[1] Nordtun, T. (2009) Electric Propulsion System s for Offshore Support Vessels. Wartsila.
[2] Herdzik, J. (2010) Problems of Propulsion Arrangement Choice of Multi-Mode Vessels. Journal of Kones, 17, 12-19.
[3] Minsaas, K. and Steen, S. (2008) Propeller Theory. Sit Tapir, Trondheim.
[4] Nitonye, S. (2017) Design Calculations for Equipment and Components Specifica-tion for Lubricating oil System of a Tug Boat. International Journal of Advances in Engineering and Technology, 10, 449-462. http://www.ijaet.org/
[5] Phani Krishna, A.H. (2013) Tug Boats Propulsion.
www.navalarch.weebly.com/near-coastal-vessels/tug-boats-propulsion
[6] Machinery Spaces (2015) Ship Propeller Shaft—Thrust Blocks and Shaft Bearings.
http://www.machineryspaces.com/cooling.html
[7] Smith, E.C. (1905) A Short History of Naval and Marine Engineering. University Press, Cambridge.
[8] Lewis, V. and Edward, Ed. (1989) Principle of Naval Architecture, Society of Naval Architects and Marine Engineers.
[9] Pike, J. and Sherman, R. (1999) US Navy Propulsion Systems.
http://www.fas.org/man/dod-101/sys/ship/eng/
[10] Martinez, I. (1995) Marine Propulsion, “Selecting an Efficient Propulsion System”. Isodiro Martinez Enterprise.
[11] Nielsen, J.R. and Marinussen, H. (2010) Optimising Propulsion Systems for AHTS Vessels. Ship & Offshore, 2, 10-13.
[12] Sciberras, E.A. and Norman, R.A. (2012) Multi-Objective of a Hybrid Propulsion System for Marine Vessels. IET Electrical Systems in Transportation, 2, 148-157.
https://doi.org/10.1049/iet-est.2011.0011
[13] Øyan, E. and Steen, S. (2012) Speed and Powering Prediction for Ships Based on Model Testing. Department of Marine Technology, Norwegian University of Science and Technology.
[14] Balu, S. (2011) Modern Electrical Propulsion Systems for LNG Tankers (Unpub-lished).
[15] Samson, N. (2017) Numerical Analysis for the Design of the Fuel System of a Sea Going Tug Boat in the Niger Delta. World Journal of Engineering Research and Technology, 3, 161-177. http://www.wjert.org
[16] Lloyd’s Register of Shipping (1976) Lloyd’s Rules and Regulations for the Construc-tion and ClassificaConstruc-tion of Steel Ships. Lloyd’s Publisher.
[17] Samson, N. (2015) Stress and Resistance Analysis for the Design of a Work Barge, International Journal of Scientific and Engineering Research, (IJSER) India, 6, 1064974. http://www.ijser.org
DOI: 10.4236/jpee.2017.511007 95 Journal of Power and Energy Engineering [19] Diesel Electric Drives, MAN, 2010.
[20] A Supplement to International Tug or OSV, Cummins, USA 2012.
[21] The Development of Ulstein Hybrid Propulsion Concept and Installation on Olym-pic Zeus and OlymOlym-pic Hera Ulstein 2009.
[22] Samson, N. and Adumene, S. (2015) Comparative Modeling of Hull Form Resis-tance for Three Ocean Going Vessels Using Methodical Series. International Journal of Engineering and Technology, (IJET) Germany,4, 489-496.
http://www.sciencepubco/index.php/IJET.com
https://doi.org/10.14419/ijet.v4i4.4948
[23] Dimensions Info because Size Matters (2015) Tug Boat Dimension.
www.dimensioninfo.com/tug-boat-sizes
[24] Krishnankutty, P. (2015) Ship Resistance and Propulsion. Indian Institute of Tech-nology, Madras.
[25] Bose, N., Billet, M., Andersen, P., Atlar, M., Duge, C., Ferrando, M., Qian, W. and Shen, Y. (1999) Final Report and Recommendations to the 22nd ITTC from the Specialist Committee on Unconventional Propulsors. Proceedings from the 22nd ITTC.
[26] Lindgren, H., Aucher, M., Bowden, B., Gross, A., Minsaas, K., Muntjewerf, J., Ta-mura, K. and Wermter, R. (1978) Report of Performance Committee. 15th ITTC Proceedings, 15th International Towing Tank Conference in the Hauge, The Neth-erlands.
DOI: 10.4236/jpee.2017.511007 96 Journal of Power and Energy Engineering
Nomenclature
E
A : Expanded area (of the propeller blade)
M
A : Midship area
O
A : Area of propeller disc
P
A : Projected area (of the propeller blade)
P
B : Taylor’s propeller coefficient
A
C : Correlation Allowance
B
C : Block coefficient
F
C : Friction resistance coefficient
M
C : Midship coefficient
R
C : Residual resistance coefficient
T
C : Coefficient of total hull resistance in calm water
WL
C : Wave resistance coefficient
D: Propeller Diameter
g: Acceleration due to gravity
K: Propeller constant
PP
L Length Perpendicular
B
M : Brake torque
S
M : Shift torque
N: Revolutions
B
P : Brake power
D
P : Delivered power
E
P : Effective power
I
P: Indicated power
S
P : Shaft power
T
P : Thrust power Q: Propeller torque
O
Q : Propeller torque in open water
T
R : Total ship resistance
w
S : Wetted Surface Area
T: Thrust deduction fraction
A
V : Speed of advance
S
V : Ship speed
M
B : Moulded breath
w
ρ : Density of water
G
η : Efficiency of gear
H
η : Hull efficiency
o
η : Open water efficiency
s
DOI: 10.4236/jpee.2017.511007 97 Journal of Power and Energy Engineering
Appendix
#include <iostream> #include <iomanip> #include <cmath> using namespace std;
int main() {
cout << "A program to determine the effect of speed variation on the power" << endl;
cout << endl;
cout << "P = K*n^3" << endl;
cout << "Where P is the shaft power" << endl; cout << "K is a constant" << endl;
cout << "n is the speed" << endl; {
double k = 0.0000480839; double n;
double P;
for (int a; a<22; a = a+1)
{
cout << "Enter the value of speed" << endl; cin >> n;
cout << endl; P = pow(n,3)*k;
cout << P << endl; cout << endl; }
}
![Figure 2. Propeller Shaft arrangement [6].](https://thumb-us.123doks.com/thumbv2/123dok_us/45878.504642/2.595.219.530.73.268/figure-propeller-shaft-arrangement.webp)
![Table 1. Design parameters for the tug boat [23].](https://thumb-us.123doks.com/thumbv2/123dok_us/45878.504642/7.595.56.547.271.429/table-design-parameters-tug-boat.webp)

![Table 3. Values for estimating cavitations criterion [10].](https://thumb-us.123doks.com/thumbv2/123dok_us/45878.504642/10.595.209.539.674.727/table-values-for-estimating-cavitations-criterion.webp)