ORIGINAL RESEARCH
SPINE
T1
and T2 Mapping of the Intervertebral Disk: Comparison of
Different Methods of Segmentation
R. Menezes-Reis, C.E.G. Salmon, C.S. Carvalho, G.P. Bonugli, C.B. Chung, and M.H. Nogueira-Barbosa
ABSTRACT
BACKGROUND AND PURPOSE: Intervertebral disk biochemical composition could be accessed in vivo by T1and T2 relaxometry. We found no studies in the literature comparing different segmentation methods for data extraction using these techniques. Our aim was to compare different manual segmentation methods used to extract T1and T2 relaxation times of intervertebral disks from MR imaging. Seven different methods of partial-disk segmentation techniques were compared with whole-disk segmentation as the reference standard.
MATERIALS AND METHODS: Sagittal T1and T2 maps were generated by using a 1.5T MR imaging scanner in 57 asymptomatic volunteers 20 – 40 years of age. Two hundred eighty-five lumbar disks were separated into 2 groups: nondegenerated disk (Pfirrmann I and II) and degenerated disk (Pfirrmann III and IV). In whole-disk segmentation, the disk was segmented in its entirety on all sections. Partial-disk segmentation methods included segmentation of the disk into 6, 5, 4, 3, and 1 sagittal sections. Circular ROIs positioned in the nucleus pulposus and annulus fibrosus were also used to extract T1and T2, and data were compared with whole-disk segmentation
RESULTS:In the nondegenerated group, segmentation ofⱖ5 sagittal sections showed no statistical difference with whole-disk segmen-tation. All the remaining partial-disk segmentation methods and circular ROIs showed different results from whole-disk segmentation (P⬍ .001). In the degenerated disk group, all methods were statistically similar to whole-disk segmentation. All partial-segmentation methods, including circular ROIs, showed strong linear correlation with whole-disk segmentation in both the degenerated and nondegenerated disk groups.
CONCLUSIONS: Manual segmentation showed strong reproducibility for T1and T2 and strong linear correlation between partial- and whole-disk segmentation. Absolute T1and T2 values extracted from different segmentation techniques were statistically different in disks with Pfirrmann grades I and II.
ABBREVIATIONS:AAF⫽anterior annulus fibrosus; AF⫽annulus fibrosus; CROI⫽circular ROIs; ICC⫽intraclass correlation coefficient; NP⫽nucleus pulposus; PAF⫽posterior annulus fibrosus; PDS⫽partial-disk segmentation; WDS⫽whole-disk segmentation
M
R imaging is considered the best noninvasive method to study intervertebral disks. MR imaging allows the visualiza-tion of clearly different anatomic disk subregions, including the nucleus pulposus (NP) and the annulus fibrosus (AF).1,2How-ever, routine clinical images provide a qualitative or semiquanti-tative assessment made by an expert.3The need for a better
un-derstanding of physiologic and pathologic processes in the disk
led to the application of quantitative techniques in MR imaging such as T1and T2 mapping.3,4
For the extraction of quantitative data from a given region of interest, it is necessary to perform segmentation procedures that involve selecting the region to be analyzed.5This segmentation
can be manual, semiautomatic, or automatic. In studies assessing the lumbar intervertebral disk composition, different authors used different methods to perform disk segmentation with subse-quent data extraction. The most common method in the litera-ture with regard to T1and T2 is to acquire small regions of interest that are anatomically based.6-9Authors have used
stan-dard ROIs, delineating subregions within the intervertebral disk to extract quantitative data specifically from the NP and AF.6,7
Additional intermediate ROIs on boundaries between the nucleus and annulus have also been used.8,9In the latter, intermediate
ROIs were implemented to compensate for the increased steps for segmentation in each image. These studies analyzed a limited
Received June 30, 2014; accepted after revision August 15.
From the Division of Radiology (R.M.-R., G.P.B., C.S.C., M.H.N.-B.), Ribeira˜o Preto Medical School, and Department of Physics (C.E.G.S.), Ribeira˜o Preto Philosophy and Sciences School, University of Sa˜o Paulo, Sa˜o Paulo, Brazil; and Department of Radiology (C.B.C.), VA San Diego Healthcare System, San Diego, California.
Please address correspondence to Rafael Menezes-Reis, MD, Radiology Division, Ribeira˜o Preto Medical School, University of Sa˜o Paulo–USP, Av Bandeirantes, 3900, Ribeira˜o Preto, Sa˜o Paulo, Brazil, 14049-090; e-mail: rafaelmenezesreis@ gmail.com
Indicates open access to non-subscribers at www.ajnr.org
number of MR imaging sections. The segmentation using a few MR imaging sections and regional ROIs allows the extraction of data more quickly than segmenting the whole intervertebral disk. Other authors chose to perform the segmentation of the disk as a whole, with the region of interest covering the NP and AF simul-taneously.10,11The use of segmentation of only the central MR
imaging sagittal section to extract quantitative data from the in-tervertebral disk is also very common in the literature.12,13
The intervertebral disk structure is nonuniform with differ-ences in hydration and collagen content between NP and AF. Therefore, the extraction of different T1and T2 relaxation times may be expected depending on the segmentation method used.10,14Despite the potential importance of using different
seg-mentation methods in the evaluation of the intervertebral disk composition, we have not found studies comparing the accuracy, reliability, and reproducibility of the results generated by different segmentation methods. Our hypothesis is that partial segmenta-tion of intervertebral disks, especially through standard geometric regional ROIs, will result in the extraction of different T1and T2 relaxation times compared with full segmentation.
MATERIALS AND METHODS
Population Sample
This study was approved by the institutional review board. The volunteers were recruited through institutional review board–ap-proved local advertisement and were selected on the basis of the inclusion criteria. We recruited 57 asymptomatic adults (25 men and 32 women), with a mean age of 26.54⫾5.0 years (range, 20 – 40 years); mean height, 1.69⫾0.08 m (1.53–1.90 m); mean weight, 67.52⫾13.85 kg (range, 46.5–105 kg); and mean body mass index, 23.5⫾3.4 kg/m2(range, 15.9 –30.3 kg/m2). The
in-clusion criteria for the volunteers were the following: 20 – 40 years of age with an Oswestry Dysfunction Index score⬍10. Volunteers with persistent low back pain for at least 6 months; an Oswestry Dysfunction Index score⬎10; or previous spinal pathology, sig-nificant scoliosis, or surgery were excluded from the study.
All 5 lumbar disks of the 57 volunteers were studied; therefore, we evaluated 285 disks. The intervertebral disks were graded ac-cording to the Pfirrmann et al classification.14After classification
by the Pfirrmann grading system, we divided the intervertebral disks into 2 subgroups: nondegenerated (grades I and II)⫽224 disks and degenerated (grades III and IV)⫽ 61 disks. In our sample, we found no grade V intervertebral disks according to the Pfirrmann et al classification.
MR Imaging
All MR imaging examinations were performed by using a 1.5T scanner (Achieva; Philips Healthcare, Best, the Netherlands). We used a 16-channel spine coil (SENSE-SPINE; Philips). Volunteers were kept still in a supine position with the lower limbs extended and relaxed. The study protocol included a 2D fast spin-echo sequence with the following characteristics: orientation⫽ sagit-tal, FOV⫽22⫻22 cm, thickness⫽4 mm, number of sections⫽ 16, matrix⫽256⫻256 and no intersection gap. For the segmen-tation process, we acquired a T2-weighted sagittal sequence, with TE⫽120 ms and TR⫽3900 ms. Spin-echo sequences were ac-quired to generate quantitative T1and T2 maps. We used the
following parameters—T2 multiecho sequence: TE⫽20/40/60/ 80/100/120/140/160 ms and TR ⫽ 3000 ms; T1multilocker times sequence: TE⫽20 ms, TR⫽2000 ms, Tlock⫽2/10/20/ 40/60 ms. The total MR imaging acquisition time was 13 minutes.
Image Evaluation
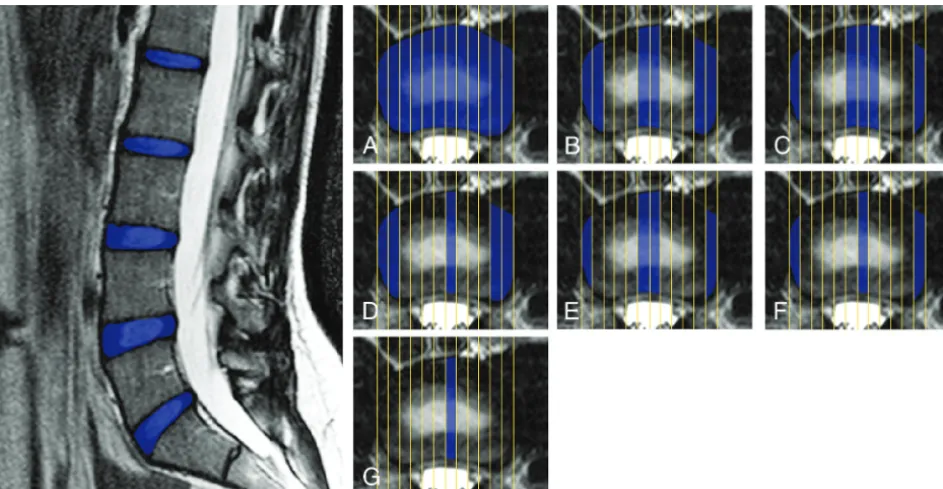
The Display software (McConell Brain Imaging Center, Mon-treal, Quebec, Canada) was used for image analysis and segmen-tation. The segmentation process was performed on the sagittal plane according to the illustrations in Figs 1 and 2. The segmen-tation of 285 disks was performed by 2 independent and blinded observers, taking care not to include regions of subchondral bone. They were previously trained for 2 months in manual spinal MR imaging segmentation and were supervised by a senior radiologist with 15 years’ experience in musculoskeletal radiology and spine MR imaging. First, full manual segmentation of the whole inter-vertebral disk, encompassing NP and AF, for each disk in all 12 sections was performed for all lumbar disks of each volunteer (whole-disk segmentation [WDS]). Partial-disk segmentation (PDS) methods were performed by using 6 different techniques according to the illustration in Fig 1 by using the following: 6 sections (PDS-6), 5 sections (PDS-5A and PDS-5B), 4 sections (PDS-4), 3 sections (PDS-3), and only 1 central section (PDS-1). Extraction of T1and T2 relaxation times was also performed by using 3 circular ROIs (CROI) placed on the NP, anterior annulus fibrosus (AAF), and posterior annulus fibrosus (PAF) by using 3 distinct sagittal sections as shown in Fig 2. The most central region of the NP was marked by using a region of interest with an area of 26.77 mm2. This region was labeled regardless of the presence or
absence of a nuclear cleft. ROIs with 12.75 mm2each were used in
the regions of AAF and PAF. We placed ROIs on the most anterior and posterior regions of the annulus, avoiding selecting the tran-sition regions between the AF and NP.
The main researcher was the first observer, responsible for the segmentation of all 285 lumbar disks. One hundred disks were randomly selected for intra- and interobserver reproducibility analysis, 50 from the degenerated group and 50 from the nonde-generated group. These disks were segmented a second time by the first and second observer with an interval of 2 months after the first segmentation.
Statistical Analysis
The analysis of intra- and interobserver variability was performed by the intraclass correlation coefficient (ICC) with 99% confi-dence intervals for all lumbar levels.
San Diego, California). To calculate the ICC, we used SPSS, Ver-sion 20 (IBM, Armonk, New York).
RESULTS
The values of T2 and T1relaxation times of the regions of the disk are shown in Table 1. In the nondegenerated group, in both T2 and T1mapping, the methods PDS-6 and PDS-5B showed the average nearest to WDS, also with a lower SD. In the segmen-tation techniques with fewer sections, the average relaxation times extracted were more distanced from the results obtained with WDS and had a larger SD. In the degenerated disk subgroup, on the other hand, the values obtained from both T2 and T1 map-pings were similar and did not differ statistically between the WDS, PDS, and CROI.
In Tables 2 and 3 are the results of intraclass correlation coef-ficients and confidence intervals for each technique in the
nonde-generated and denonde-generated groups. The ICC was higher for T1and T2 in the NP and whole disk than for AAF and PAF. These results of intraobserver and inter-observer reproducibility were similar be-tween degenerated and nondegenerated disk groups.
The ANOVA test for T2 relaxometry and the Friedman test for T1 relaxom-etry were used to evaluate whether the re-laxation times obtained by different seg-mentation methods were similar. Our results showed statistically significant differences between the results of differ-ent segmdiffer-entation techniques of nonde-generated cases (T2: P ⬍ .0001, F ⫽ 74.33; T1: P ⬍ .0001, Friedman ⫽ 299.2). The exception occurred for the PDS-6 and PDS-5B methods, in which relaxation times extracted for both T2 and for the T1were not statistically different from those of WDS. The degenerated group showed a different behavior, in which there was no statistical difference among WDS, PDS, and CROI for both T2 (P⫽.45,F⫽0.97) and T1mapping (P⫽ .14, Friedman⫽64.41).
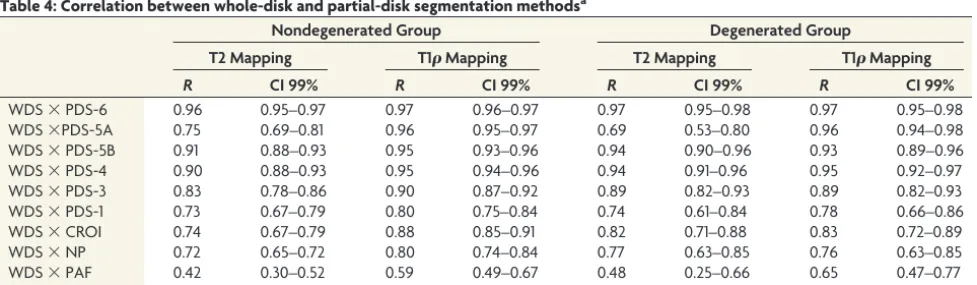
Table 4 presents the correlations between the partial-segmen-tation methods and WDS. TheRvalues were higher in the meth-ods that used more sections. Comparing T1and T2 mapping, one could see that the values of T2 relaxation times were discretely more scattered compared with those of T1relaxation times. In both mappings, the number of sections used decreased and the confidence intervals were larger. All methods also showed a sig-nificant positive correlation with WDS (Table 4) (P⬍.0001). The
FIG 1. On the left is a sagittal T2-weighted image representing the segmented region of the intervertebral disk. On the right is the number of sections used in partial segmentation methods.A, Whole-disk segmentation.B, Partial-disk segmentation using 6 sections (PDS-6).C, Partial-disk segmentations using 5 sections, method A (PDS-5A).D, Partial disk segmentation using 5 sections, method B (PDS-5B).E, Partial-disk segmenta-tion using 4 secsegmenta-tions (PDS-4).F, Partial disk segmentation using 3 sections (PDS-3).G, Partial-disk segmentation using 1 central section (PDS-1).
[image:3.594.57.529.46.290.2] [image:3.594.54.375.346.497.2]values were much higher in NP compared with AF in the nonde-generated group for the both T1and T2 relaxometry. In the degenerated disk group, the relaxation times of NP and AF had a more similar behavior in relation to the whole disk. This result was more evident for T1mapping.
DISCUSSION
In this research, we studied different techniques of extraction of T2 and T1relaxation times from the lumbar intervertebral disks and compared various PDS methods with the WDS. Our results suggest that the choice of the segmentation method can influence
the absolute results obtained. For practical reasons, most previous studies have used small geometric ROIs for degenerative disk dis-ease.9,15We did not find any previous study in vivo that explored
the segmentation of the intervertebral disk to its full extent. Our results (Tables 2 and 3) showed a high intra- and interob-server reproducibility for T2 and T1, both for the nondegener-ated and degenernondegener-ated groups. The intra- and interobserver ICCs were stronger for NP and WDS. AF ICC values were moderate because the placement of ROIs in AF tends to be a bit more diffi-cult. This is especially true in cases of severely degenerated disks, when the border zone between the NP and AF becomes indistinct with progressive incorporation of nucleus pulposus material into the interior of the annular lamellae.16-18
PDS-6 and PDS-5B results for T2 and T1were statistically similar to those of WDS in the nondegenerated group. Our results suggest that about 50% of the disk structure needs to be segmented so that the results would be comparable with those extracted via WDS on inter-vertebral disks with Pfirrmann grades I and II. As previously described in the literature,3,11,19 if the extraction of T2
and T1 emphasizes the central
sec-Table 1: Values of the T2 and T1relaxation times (ms) expressed as average and SD for each experimental method (nⴝ285 disks)
Method
T2 Mapping T1Mapping
[image:4.594.54.376.201.341.2]Nondegenerated Degenerated Nondegenerated Degenerated WDS 118.3⫾13.30 104.3⫾14.95 49.04⫾6.82 48.48⫾9.36 NP 129.7⫾22.55 99.07⫾25.53 52.06⫾10.39 46.10⫾12.05 PAF 110.3⫾28.42 96.70⫾72 42.70⫾9.5 46.56⫾15.01 AAF 104.2⫾22.63 99.98⫾21.87 47.60⫾10.04 41.74⫾13.84 CROI 114.6⫾16.78 101.8⫾17.58 49.00⫾7.0 47.77⫾8.58 PDS-6 118.1⫾13.62 105.3⫾14.30 49.70⫾7.23 48.59⫾9.18 PDS-5A 121.8⫾17.31 103.6⫾22.75 48.72⫾7.07 48.67⫾9.05 PDS-5B 116.0⫾14.50 105.7⫾15.06 49.81⫾7.20 49.16⫾9.40 PDS-4 123.0⫾14.11 107.5⫾14.76 49.57⫾7.14 48.81⫾8.75 PDS-3 121.6⫾15.89 108.5⫾16.36 45.7⫾11.91 49.80⫾9.42 PDS-1 128.6⫾17.60 105.6⫾15.76 48.92⫾7.21 49.26⫾14.41
Table 2: ICCs and 99% CIs for intra-and interobserver analysis of quantitative techniques (nⴝ50) used in the nondegenerated group
T2 Mapping T1Mapping
Intraobserver Interobserver Intraobserver Interobserver
ICC CI ICC CI ICC CI ICC CI
NP 0.97 0.96–0.99 0.97 0.94–0.99 0.96 0.96–0.99 0.97 0.96–0.98
AAF 0.80 0.75–0.87 0.77 0.72–0.90 0.91 0.64–0.97 0.83 0.70–0.93
PAF 0.85 0.72–0.91 0.78 0.64–0.86 0.79 0.64–0.87 0.80 0.79–0.93
[image:4.594.51.534.366.447.2]Whole disk 0.92 0.87–0.95 0.92 0.85–0.95 0.98 0.96–0.99 0.93 0.72–0.96
Table 3: ICCs and 99% CIs for intra- and interobserver analysis of quantitative techniques (nⴝ50) used in the degenerated group
T2 Mapping T1Mapping
Intraobserver Interobserver Intraobserver Interobserver
ICC CI ICC CI ICC CI ICC CI
NP 0.94 0.90–0.96 0.96 0.94–0.97 0.98 0.93–0.99 0.98 0.93–0.99
AAF 0.87 0.39–0.73 0.81 0.70–0.88 0.83 0.64–0.95 0.82 0.41–0.93
PAF 0.79 0.46–0.77 0.66 0.48–0.79 0.79 0.56–0.86 0.80 0.47–0.90
Whole disk 0.92 0.87–0.95 0.86 0.77–0.91 0.98 0.96–0.99 0.93 0.65–0.99
Table 4: Correlation between whole-disk and partial-disk segmentation methodsa
Nondegenerated Group Degenerated Group
T2 Mapping T1Mapping T2 Mapping T1Mapping
R CI 99% R CI 99% R CI 99% R CI 99%
WDS⫻PDS-6 0.96 0.95–0.97 0.97 0.96–0.97 0.97 0.95–0.98 0.97 0.95–0.98
WDS⫻PDS-5A 0.75 0.69–0.81 0.96 0.95–0.97 0.69 0.53–0.80 0.96 0.94–0.98
WDS⫻PDS-5B 0.91 0.88–0.93 0.95 0.93–0.96 0.94 0.90–0.96 0.93 0.89–0.96
WDS⫻PDS-4 0.90 0.88–0.93 0.95 0.94–0.96 0.94 0.91–0.96 0.95 0.92–0.97
WDS⫻PDS-3 0.83 0.78–0.86 0.90 0.87–0.92 0.89 0.82–0.93 0.89 0.82–0.93
WDS⫻PDS-1 0.73 0.67–0.79 0.80 0.75–0.84 0.74 0.61–0.84 0.78 0.66–0.86
WDS⫻CROI 0.74 0.67–0.79 0.88 0.85–0.91 0.82 0.71–0.88 0.83 0.72–0.89
WDS⫻NP 0.72 0.65–0.72 0.80 0.74–0.84 0.77 0.63–0.85 0.76 0.63–0.85
WDS⫻PAF 0.42 0.30–0.52 0.59 0.49–0.67 0.48 0.25–0.66 0.65 0.47–0.77
WDS⫻AAF 0.40 0.28–0.51 0.58 0.48–0.66 0.50 0.27–0.67 0.54 0.33–0.70
[image:4.594.60.531.474.554.2] [image:4.594.54.543.581.723.2]tions, it may overestimate the glycosaminoglycan content of the disk.
In the degenerated disk group, partial segmentation methods and CROI showed results similar to those of the full segmenta-tion. This outcome may have occurred by the accentuated loss of proteoglycans and water and replacement by type I collagen in NP.20Thus, in degenerated disks, the relaxation time of NP
came very close to that of AF because the disk composition be-comes more homogeneous.15,21
In cases of severe scoliosis, disk degeneration may occur un-evenly in different regions of the disk.22-24The presence of
volun-teers with scoliosis could potentially affect our results of compar-ison between different segmentation techniques, but it did not occur because we had no case of scoliosis. Panoramic radiographs were available for each case due to another research project in progress from our group. The presence of osteophytes should also be considered carefully so that the segmentation does not encom-pass these regions.25Other accentuated postural changes,
verte-bral fractures, listhesis, or extruded disk herniation could also result in uneven disk degeneration,24,26so that using only central
sagittal sections for data extraction could result in a different com-position assessment of the disk. Our sample had no volunteer with deformities, fractures, or disk herniation.
Our results support the use of partial segmentation methods in the study of intervertebral disk composition because PDS and CROI methods showed, in general, excellent correlation to the WDS method (Table 4). However, the comparison among results of different studies that used different segmentation methods should be done with caution.15,27Our results demonstrate that
the use of different segmentation techniques may result in mea-surement of different values of intervertebral disk relaxation times.
Regarding the comparison of our results with the literature, the NP T2 relaxation times were very close to those reported in previous studies.9,28,29For the AF T2, our results were similar to
those of Stelzeneder et al28and Welsch et al,29and slightly higher
than those of Trattnig et al.9With respect to the T1relaxation
times, the values encountered for the NP and AF in our study were lower than those found in the literature.12,30-32We hypothesize
that at least in part, this difference may be due to different mag-netic field strengths, because most of the previous studies used 3T MR imaging.12,31,32In common with authors of other studies, we
found that a greater degree of degeneration implies lower T2 and T1relaxation times.
When we compared the individual relaxation times of NP, AAF, and PAF, all 3 regions showed statistical correlation with the WDS values. In the nondegenerated group, the NP values had a stronger correlation with WDS, suggesting that their influence on the relaxation time of the whole disk is larger than that from AF, as has already been described in the literature.19,20The annulus
fi-brosus also follows the uniform changes of the whole disk, but less than the nucleus.33However, in the degenerated group, the
relax-ation times of NP and AF showed a more similar behavior in relation to the whole disk. Antoniou et al21used MR imaging
quantitative techniques and also a mechanical test to study the intervertebral disks and found similarities in the NP and AF be-havior over the degenerative processes. This finding shows that both regions are affected evenly, especially at the beginning of
the degeneration. This phenomenon was more evident in T1 mapping because this method has proved more affinity with loss of proteoglycan content, which has been suggested as a major trigger of the degenerative process, resulting in a low relaxation time.12,13
Most studies in the literature preferred segmentation of NP and AF individually.28-32,34In intervertebral disks with Pfirrmann
grades I and II, segmenting these structures separately usually makes it possible to distinguish them better. If the degeneration increases to grades III and IV, this distinction becomes more difficult.14Thus, a relative advantage of performing segmentation
of the whole area or the whole volume of the disk is to enable a more secure comparison among disks with different degrees of degeneration.
A relative limitation of our study is that we included only young and asymptomatic volunteers; therefore, the results may not be extended to the symptomatic population. We also did not have Pfirrmann grade V intervertebral disks. This probably is not an important practical limitation in the research field because composition studies from quantitative MR imaging are less likely to be applied to severely degenerated disks.
Numerous researchers have used quantitative MR imaging to improve the understanding of intervertebral disk degeneration. During the past 10 years, the use of quantitative MR imaging techniques, especially T2 and T1relaxometry, have allowed the evaluation of the intervertebral disk composition in vivo. How-ever, the lack of standardization for data collection may impair the comparison of results from different studies. Despite the growing importance of relaxometry for in vivo evaluation of in-tervertebral disk biochemical composition and disk degeneration, we did not find studies concerned with the comparison of differ-ent segmdiffer-entation techniques. When one envisions future research about the etiology and risk factors for disk degeneration, the
stan-dardization of T2 and T1 mapping may assume a great
importance.
CONCLUSIONS
Manual segmentation showed strong reproducibility for degen-erated and nondegendegen-erated disks. The segmentation methods we compared showed excellent linear correlation with each other. Absolute T1and T2 values extracted from different segmenta-tion techniques were statistically different in intervertebral disks with Pfirrmann grades I and II.
ACKNOWLEDGMENTS
The authors acknowledge the funding support from CNPq, CAPES and FINEP.
Disclosures: Rafael Menezes-Reis—RELATED:Grant: Coordenac¸a˜o de Aperfeic ¸oa-mento de Pessoal de Nível Superior,Comments: Masters scholarship;Support for Travel to Meetings for the Study or Other Purposes: Council for Scientific and Technological Development,Comments: support provided by CNPq. Camila Silva de Carvalho—RELATED:Grant: scientific initiation scholarship from R-USP,Comments: from August 1, 2012, to July 31, 2013, $400.00. Gustavo P. Bonugli—UNRELATED:Board Membership: Coordenac¸a˜o de Aperfeic¸oamento de Pessoal de Nível Superior. Christine B. Chung—UNRELATED:Grants/Grants Pending: National Institutes of Health,*Comments: NIDCR TMJ grant. Marcello H. Nogueira-Barbosa—RELATED:
REFERENCES
1. Maus TP, Aprill CN.Lumbar diskogenic pain, provocation diskogra-phy, and imaging correlates.Radiol Clin North Am2012;50:681–704 2. Wassenaar M, van Rijn RM, van Tulder MW, et al.Magnetic reso-nance imaging for diagnosing lumbar spinal pathology in adult pa-tients with low back pain or sciatica: a diagnostic systematic review.
Eur Spine J2012;21:220 –27
3. Lotz JC, Haughton V, Boden SD, et al.New treatments and imaging strategies in degenerative disease of the intervertebral disks. Radiol-ogy2012;264:6 –19
4. Majumdar S.Magnetic resonance imaging and spectroscopy of the intervertebral disc.NMR Biomed2006;19:894 –903
5. Pham DL, Xu C, Prince JL.Current methods in medical image seg-mentation.Annu Rev Biomed Eng2000;2:315–37
6. Mwale F, Iatridis JC, Antoniou JQuantitative MRI as a diagnostic tool of intervertebral disc matrix composition and integrity.Eur Spine J
2008;17(suppl 4):432– 40
7. Marinelli NL, Haughton VM, Anderson PA.T2 relaxation times cor-related with stage of lumbar intervertebral disk degeneration and patient age.AJNR Am J Neuroradiol2010;31:1278 – 82
8. Haneder S, Apprich SR, Schmitt B, et al.Assessment of glycosamino-glycan content in intervertebral discs using chemical exchange satu-ration transfer at 3.0 Tesla: preliminary results in patients with low-back pain.Eur Radiol2013;23:861– 68
9. Trattnig S, Stelzeneder D, Goed S, et al.Lumbar intervertebral disc abnormalities: comparison of quantitative T2 mapping with con-ventional MR at 3.0 T.Eur Radiol2010;20:2715–22
10. Michopoulou S, Costaridou L, Vlychou M, et al. Texture-based quantification of lumbar intervertebral disc degeneration from conventional T2-weighted MRI.Acta Radiol2011;52:91–98 11. Chan WC, Sze KL, Samartzis D, et al.Structure and biology of the
intervertebral disk in health and disease.Orthop Clin North Am
2011;42:447– 64, vii
12. Blumenkrantz G, Li X, Han ET, et al.A feasibility study of in vivo T1rho imaging of the intervertebral disc.Magn Reson Imaging
2006;24:1001– 07
13. Auerbach JD, Johannessen W, Borthakur A, et al.In vivo quantifica-tion of human lumbar disc degeneraquantifica-tion using T1(rho)-weighted magnetic resonance imaging.Eur Spine J2006;15(suppl 3):S338 – 44 14. Pfirrmann CW, Metzdorf A, Zanetti M, et al.Magnetic resonance classification of lumbar intervertebral disc degeneration.Spine (Phila Pa 1976)2001;26:1873–78
15. Stelzeneder D, Welsch GH, Kova´cs BK, et al.Quantitative T2 evalu-ation at 3.0T compared to morphological grading of the lumbar intervertebral disc: a standardized evaluation approach in patients with low back pain.Eur J Radiol2012;81:324 –30
16. Sharma A, Parsons M, Pilgram T.Temporal interactions of degen-erative changes in individual components of the lumbar interverte-bral discs: a sequential magnetic resonance imaging study in pa-tients less than 40 years of age.Spine (Phila Pa 1976)2011;36: 1794 – 800
17. Del Grande F, Maus TP, Carrino JA.Imaging the intervertebral disk: age-related changes, herniations, and radicular pain.Radiol Clin North Am2012;50:629 – 49
18. Issy AC, Castania V, Castania M, et al.Experimental model of
inter-vertebral disc degeneration by needle puncture in Wistar rats.Braz J MedBiol Res2013;46:235– 44
19. Antoniou J, Pike GB, Steffen T, et al.Quantitative magnetic reso-nance imaging in the assessment of degenerative disc disease.Magn Reson Med1998;40:900 – 07
20. Zuo J, Joseph GB, Li X, et al.In vivo intervertebral disc character-ization using magnetic resonance spectroscopy and T1imaging: association with discography and Oswestry Disability Index and Short Form-36 Health Survey.Spine (Phila Pa 1976)2012;37:214 –21 21. Antoniou J, Epure LM, Michalek AJ, et al.Analysis of quantitative magnetic resonance imaging and biomechanical parameters on hu-man discs with different grades of degeneration.J Magn Reson Im-aging2013;38:1402–14
22. Ding WY, Yang DL, Cao LZ, et al.Interverterbal disc degeneration and bone density in degenerative lumbar scoliosis: a comparative study between patients with degenerative lumbar scoliosis and pa-tients with lumbar stenosis.Chin Med J (Engl)2011;124:3875–78 23. Homminga J, Lehr AM, Meijer GJ, et al.Posteriorly directed shear
loads and disc degeneration affect the torsional stiffness of spinal motion segments: a biomechanical modeling study.Spine (Phila Pa 1976)2013;38:E1313–19
24. Gervais J, Pe´rie´ D, Parent S, et al.MRI signal distribution within the intervertebral disc as a biomarker of adolescent idiopathic scoliosis and spondylolisthesis.BMC Musculoskelet Disord2012;13:239 25. Igbinedion BO, Akhigbe A.Correlations of radiographic findings in
patients with low back pain.Niger Med J2011;52:28 –34
26. Iguchi T, Nishida K, Ozaki T, et al.Grade three disc degeneration is a critical stage for anterior spondylolisthesis in lumbar spine.Eur Spine J2012;21:2134 –39
27. Borthakur A, Maurer PM, Fenty M, et al.T1magnetic resonance imaging and discography pressure as novel biomarkers for disc degeneration and low back pain.Spine (Phila Pa 1976)2011;36: 2190 –96
28. Stelzeneder D, Welsch GH, Kova´cs BK, et al.Quantitative T2 evalu-ation at 3.0T compared to morphological grading of the lumbar intervertebral disc: a standardized evaluation approach in patients with low back pain.Eur J Radiol2012;81:324 –30
29. Welsch GH, Trattnig S, Paternostro-Sluga T, et al.Parametric T2 and T2* mapping techniques to visualize intervertebral disc degenera-tion in patients with low back pain: initial results on the clinical use of 3.0 Tesla MRI.Skeletal Radiol2011;40:543–51
30. Zobel BB, Vadala` G, Del Vescovo R, et al.T1magnetic resonance imaging quantification of early lumbar intervertebral disc degen-eration in healthy young adults. Spine (Phila Pa 1976)2012;37: 1224 –30
31. Wang YX, Zhao F, Griffith JF, et al.T1rho and T2 relaxation times for lumbar disc degeneration: an in vivo comparative study at 3.0-Tesla MRI.Eur Radiol2013;23:228 –34
32. Wang YX, Zhao F, Yuan J, et al.Accelerated T1rho relaxation quan-tification in intervertebral disc using limited spin-lock times.
Quant Imaging Med Surg2013;3:54 –58
33. Pattappa G, Li Z, Peroglio M, et al.Diversity of intervertebral disc cells: phenotype and function.J Anat2012;221:480 –96
34. Niu G, Yang J, Wang R, et al.MR imaging assessment of lumbar intervertebral disk degeneration and age-related changes: apparent diffusion coefficient versus T2 quantitation.AJNR Am J Neuroradiol