University of Warwick institutional repository: http://go.warwick.ac.uk/wrap
A Thesis Submitted for the Degree of PhD at the University of Warwick
http://go.warwick.ac.uk/wrap/34713
This thesis is made available online and is protected by original copyright. Please scroll down to view the document itself.
Ultimate Strength of Composite Beams by
Nadia Julia Molenstra
A dissertation submitted to the University of Warwick
in partial fu1fi1ment for the degree of Doctor in Philosophy
Declaration
I hereby declare that the work embodied in this thesis is the result of my own investigations except where reference has been made to published literature.
This work has not been submitted in candidature for any other degree.
Acknowledgements
I would like to express my sincere thanks to Prof. R.P. Johnson for his support and criticism throughout the course of my research. My appreciation is also extended to Dr. W. Lewis for her advice on the numerical side of the work.
I am indebted to the University of Warwick, the Building Research Establish-ment and 'het Nationaal Fonds voor Wetenschappelijk Onderzoek' in Belgium for their financial support which made this research possible.
I would like to convey my gratitude to my colleagues Roger Fan and Zoubir Benterkia for their encouragement and the many useful discussions.
Synopsis
The study of composite beams is characterised by the connection between the two components: the concrete slab and the steel girder. In this thesis, two different problems, related to this connection were studied: the problem of partial interaction in composite beams of long spans with low degrees of shear connection, and the problem of transverse flexibility of the stud connection 'joint' between the concrete slab and the steel beam as part of a discrete inverted U-frame. This thesis is therefore divided into two separate parts.
The study of beams with partial shear connection and solid slabs or slabs with metal decking is considered in the first part. Such beams, with a uniform stud spacing over each shear span, with spans longer than 10 m - generally propped during construction, and with low degrees of shear connection, could fail prematurely and suddenly in shear rather than gradually in bending, due to the limited slip deformation capacity of the studs in shear. In order to investigate the behaviour of simply supported and continuous composite beams with different degrees of shear connection, different geometry and different shear spans under design ultimate loading conditions, a numerical computer simulation program was written. The program takes account of the relative displacement between the slab and the beam and the non-linear behaviour of steel, concrete and stud connectors. A data bank of maximum slip results for different beams is obtained for ultimate beam loads designed to the interpolation method in Eurocode 4. The computer simulation gives a conservative but safe assessment of the suitability of the degree of interaction for a specific design ultimate load . The results were used to formulate a tentative design method for composite beams with solid slabs and partial shear connection.
Contents
1 General Introduction
1I Partial interaction of composite beams
42 The problems of Partial Interaction
52.1 Origin of partial interaction ... 5
2.2 Review of research background to present Codes of Practice 6 2.2.1 Background to present Partial Interaction design methods 6 2.2.2 Experimental evidence ... 9
2.2.3 Theoretical evidence ... 12
2.2.4 Missing link between Codes and Research ... 13
2.3 Literature survey on the Physical Partial Interaction models and theirmathematical solutions ... 14
2.3.1 Elastic Partial Interaction Model ... 14
2.3.2 Elasto-Plastic Partial Interaction model without uplift 15 2.3.3 Elasto-plastic Partial Interaction model with uplift . 16 2.4 Aim and scope of research ... 17
3 Physical simulation, numerical solution and validation of the
so-lution
25
3
.1 The physical model ... 253.1.1 Scope of the model ... 25
3.1.2 Assumptions for the model ... 27
3.2.1 The structure of the programme ...31
3.2.2 The numerical solution to the mathematical formulation 32 3.2.3 Reasons for instability ...40
3.3 Validation of numerical results ...41
3.3.1 Validation of the assumption of continuous shear transfer . 41 3.3.2 Experimental validation of the analyses produced by the programme...45
3.3.3 Conclusion on the Validation ...50
4 Analyses of composite beams with Partial Interaction 79 4.1 Study of the slip under ultimate loading conditions ...79
4.1.1 Elastic analytical solution for maximum slip ...79
4.1.2 Comparison between ye and 'yr-values ...80
4.1.3 Parameters affecting the maximum slip, 'y.m ...81
4.2 The experimental load-slip curve ...86
4.2.1 Load-slip behaviour of studs in solid slabs ...87
4.2.2 Load-slip behaviour of studs in slabs with metal decking . 92 4.2.3 Choice of load-slip curves for numerical 'experiments' . . . 97
4.2.4 Influence of load-slip curves on numerical results ...98
4.3 Analyses of continuous composite beams ...99
4.3.1 Interpretation of draft Eurocode 4 ...99
4.3.2 Numerical 'experiments' on 15 continuous beams ...102
4.3.3 Comparison of maximum slip in continuous and simply sup-portedbeams ...104
4.4 Analyses of simply supported beams ...105
4.4.1 Existing design approaches ...105
4.4.2 Numerical 'experiments' on 110 beams ...106
4.5 Prediction equation for the maximum slip ...110
4.5.1 Exponential curve-fitting for fm along hot rolled sections with solid concrete slab ...111
4.5.3 Proposal of expression for Ym for beams with 50 and 75
shearconnection ...115
4.6 Systematic influence of steel Grade and connector strength on the maximum slip along simply supported beams ...116
4.6.1 Influence of structural steel Grade on ... 117
4.6.2 Influence of the stud shear strength on the slip distribution 118 4.7 Comparison between interpolation and equilibrium methods . 118 4.7.1 Comparison of the two methods in Eurocode 4 ...119
4.7.2 Comparison of equilibrium method in Eurocode 4 and BS 5950:Pt.3...120
4.7.3 Conclusions on the use of the equilibrium method ...121
5 Conclusions on Partial Interaction design 202 5.1 Summary of partial interaction design in Euro and British Codes. 202 5.2 A tentative proposal for Euro and British Composite Codes . . . 203
II Transverse flexibility of inverted Uframe steel
-conrete stud connections
208
6 The problem of transverse flexibility of inverted U—frames 209 6.1 Review of U—frame action ...2096.1.1 Historical background to U—frame design ...209
6.1.2 Application of U-frame approach to composite plate girder bridges...210
6.1.3 Bases of and criticism on the current design formulae . . . 210
6.2 Design of composite plate girder with inverted U-frame action . . 214
6.2.1 Alternatives for the current design methods for U-frames inBS 5400:Pt.3...214
6.2.2 Design example of a vertically stiffened plate girder as part ofa U-frame ...216
6.3 Objective of Experimental work ...218
6.3.1 Choice of test layout ...218
7 Tests on inverted U-frame connections 229
7.1 Introduction ...229
7.2 Test Specimen ...229
7.2.1 Choice of Specimen ...229
7.2.2 Detailing of the test specimen ...230
7.2.3 Construction of test specimen ...231
7.3 The test rig ...232
7.4 INSTRUMENTATION ...233
7.4.1 Measurements taken ...233
7.4.2 Instruments used ...234
7.5 Testing Procedure ...235
7.6 Auxiliary tests ...236
7.6.1 Material properties ...236
7.6.2 Tests on instrumentation ...237
7.6.3 Test on specimen BM1 ...237
7.7 Test results ...237
7.7.1 Introduction ...237
7.7.2 Formation of the crack pattern ...238
7.7.3 Relative transverse rotation and flexibility of the connection 241 7.7.4 Strains in stud connectors ...242
7.7.5 Auxiliary tests ...244
8 Analysis and discussion of test results 292 8.1 Introduction ...292
8.2 Degree of uncertainty in the experimental results ...293
8.2.1 Degree of uncertainty in the value of the transverse force andmoment ...293
8.2.2 Degree of uncertainty in the values of the relative rotations ofthe connections ...293
8.2.3 Degree of uncertainty in the values of the forces in the studs 294 8.3 Global behaviour of the test specimen ...295
8.5 Prediction of the initial cracking load and failure load using a shear failuremodel ...298 8.5.1 Recent developments in shear failure concepts for concrete
beams...299 8.5.2 Prediction of the load at initial cracking and prediction of
the failure load for all test specimens ...302 8.6 Prediction of the elastic transverse flexibility of the connection . . 309
8.6.1 Calculation of the elastic transverse flexibility for all tested specimens...309 8.6.2 Prediction of the transverse elastic flexibility of the
connec-tion using different models ...310 8.6.3 Prediction of the transverse flexibility - analogy with the
prediction of the M - 9 relationship for steel beam-column connections...311 8.7 Scope of the test results: behaviour of a real bridge girder . . 314 8.7.1 Validity of and for a real structure . . 314 8.7.2 Scope of the flexibility of the connection ...315 8.7.3 Global behaviour of the connection in a real bridge . . 316
9 Conclusions on the transverse flexibility of steel - concrete stud
connection in inverted U-frames 345
9.1 Improvements needed on the different design aspects of inverted U-frames ...345 9.2 Improvement suggested for the current stiffness calculation of
in-verted U-frames in the Bridge Code ...346
Bibliography 350
Appendices 361
I Partial shear interaction in both Eurocode 4 and BS 5950:Pt.3 . 361 II Manual for the usage of programme EPPIB ...367 III Simplified deflection calculations ...379
W Tables with numerical results of values for the maximum slip along
List
of
Figures
3.1 Equilibrium of an infinitesimal section of a composite beam. . . 62 3.2(a) Range of stress-strain curve of concrete...63 3.2(b) Comparison of stress-strain curves according to References [48]
and [50] within the strain range -0.0035 to 0...63 3.3(a) Bilinear stress-strain curve used for structural steel...64 3.3(b) Average experimental tn-linear stress-strain curve for structural
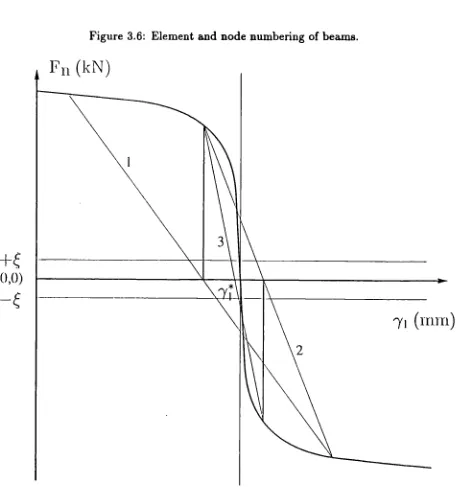
steel...64 3.4 Compatibility of an infinitesimal section of a composite beam. 65 3.5 Flow chart diagram of the total computer programme...66 3.6 Element and node numbering of beams...67 3.7 Relationship between the value of the slip -y', at one end of the
beam, and the value of the longitudinal shear force F, at the otherend...67 3.8 Two qualitative longitudinal interface shear distributions,
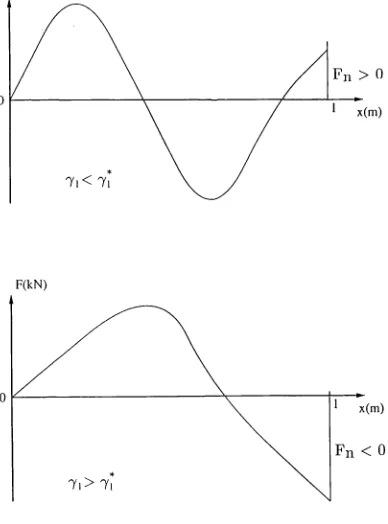
with-out a correlation between F and -y ...68 3.9 Two qualitative longitudinal interface shear distributions, with
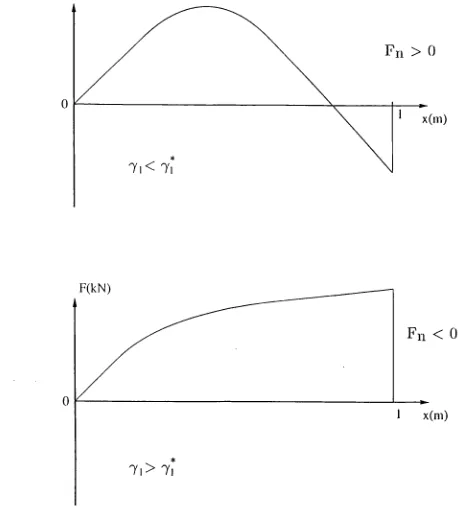
acorrelation between F and Yi...69
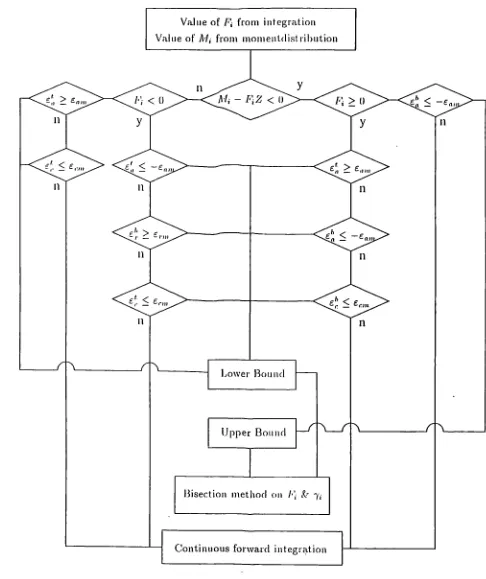
3.10 Flow chart diagram of strain limitations that cause convergence of the forward integration method...70 3.11 Twelve different types of stress distributions within the steelprofile. 71 3.12 Choice of axes and nodes for the half numerical - half analytical
method of calculating Fa and M0... 72 3.13 Error made with numerical - analytical method...72
3.15 Six different stud distributions for the same number of studs along a simply supported beam...74 3.16(a) Stud lay-out and loading conditions on beam
P1
of Table 3.5. 75 3.16(b) Stud lay-out and loading conditions on beamP3
of Table 3.5. 75 3.16(c) Stud lay-out and loading conditions on beamP2
of Table 3.5. 75 3.17(a) Stud lay-out and loading conditions on beams B2 ,
B3
& B4
ofTable3.5...76 3.17(b) Stud lay-out and loading conditions on beam
A6
of Table 3.5. . 76 3.17(c) Stud lay-out and loading conditions on beamsT1
toT3
of Table3.5...76 3.18 Slip distributions for beam
P2
of Table 3.5...77 3.19(a) Comparison of experimental and calculated ( P11; - - - P12)strain distributions at two different load levels at x = 2.15 m for beam
P1
of Tables 3.5 and 3.6 assuming discrete and continuous sheartransfer...78 3.19(b) Comparison of experimental and calculated strain distributionsat two different locations on the beam
P2
of Tables 3.5 and 3.8. 78 3.19(c) Comparison of experimental and calculated (Pj; - - —
P32)strain distributions at two different load levels at x = 2.15 m for beam
P3
of Tables 3.5 and 3.7 assuming discrete and continuous sheartransfer...784.1(a) Geometry and dimensions of cross section of composite beam withmetal decking...151 4.1(b) Geometry and dimensions of cross section of composite beam
withoutmetal decking...151 4.2 Relationship between the maximum slip and the thickness of the
concrete slab for beams Bi and B2 of Table 4.1...152 4.3 Relationship between the maximum slip along beam Bi and the
cross-sectional area of concrete slab for different concrete strength. 152 4.4 The longitudinal interface force is the lesser value of the
longi-tudinal force in the steel profile and in the concrete slab...153 4.5 Relationship between the maximum slip along beams Bi & B2
and the web slenderness of their steel profiles...153
4.6 Relationship between the maximum slip along beams Bi and B2 and the ratio of the bottom flange to the top flange...154 4.7 Relationship between the maximum slip along beams Bi and B2
and the area of their concrete slabs...154 4.8 Relationship between the maximum slip along beams Bi and B2
and the concrete strength of the slab...155 4.9 Relationship between the maximum slip along beams B1 and B2
and the Grade of structural steel...155 4.10 Variation of the shear strength of 19 mm diameter studs with
the characteristic cylinder strength of the concrete in which they areembedded...156 4.11 Comparison between the Standard Push-Out test and Oehlers'
push-out test...157 4.12 Load-slip curves of stud connectors in solid slabs...158 4.13 re-entrant and open trough types of metal decking profiles. . 159 4.14 Influence of the longitudinal position of the studs from the sides
of the trough on the shear strength of the studs...159 4.15 Influence of transverse position of more than one stud per trough
on the shear strength of the studs...160 4.16 The two-hinge failure mechanism of studs in slabs with metal
decking spanning perpendicular to the span of the beam, as de-scribed by Lungerhausen [76]...161 4.17 Different load-slip curves of studs embedded in different types
of slabs, as found by Lungerhausen [76]...161 4.18 Comparison of the elastic stiffness of the load-slip curves of studs
in solid slabs and slabs with metal decking running perpendicular tothe span of the beam...162 4.19 Numerical exponential model of the experimental load-slip curves
of studs in solid slabs, characterised by an asymptotic value for the shear strength and by two points: one at 0.5Q 33 and one at 0.99Qas...163 4.20 Comparison of commonly used numerical exponential load-slip
4.21 Six different exponential load-slip curves characterised by the same asymptotic shear strength, different elastic stiffnesses and different values of the slip at 0.99Qaj...165 4.22 Moment envelope type 1 for two span continuous composite
beams with sagging bending in both spans...166 4.23 Moment envelope type 2 for two span continuous composite
beams, where the second span remains permanently in hogging bending...167 4.24 Comparison of theoretical shear flow diagrams for two span
con-tinuous composite beams subject to a uniform distributed load anda point load...168 4.25(a) Comparison of moment and deflection distributions along beams
CB11and CB12 of Table 4.7...169 4.25(b) Comparison of shear force and slip distributions along beams
CB11 and CB12 of Table 4.7...170 4.26(a) Comparison of moment and deflection distributions along beams
CB11and CB13 of Table 4.7...171 4.26(b) Comparisons of shear force and slip distributions along beams
CB11 and CB13 of Table 4.7 ...172 4.27 Comparisons between moment, deflection, shear force, slip and
strain distributions at 50% interaction along beam CB1 of Table 4.7 and beam CB - SB1 of Table 4.8...173 4.28 Comparisons between moment, deflection, shear force, and slip
distributions at 50% interaction along beam CB1O of Table 4.7 and beam CB - SB10 of Table 4.8...175 4.29 Elevation and plan view of beams with prefabricated slabs,
leav-ing limited space for the positionleav-ing of stud connectors...177 4.30 Span limitations on beams with rolled steel sections and solid
concrete slabs in function of the connector ratio and of different slipcapacity limits...178 4.31 Elevation and plan view of beams with composite slabs, where
4.32 Span limitations on beams with rolled steel sections and com-posite slabs spanning perpendicular to the span, in function of the connector ratio and of different slip capacity limits...180 4.33(a) Influence of replacing a solid slab by a slab with metal decking
of identical overall thickness, for beam SRM-25 of Table IV.2. . 181 4.33(b) Influence of replacing a solid slab by a slab with metal decking
of identical overall thickness, for beam SRM-30 of Table IV.2. . 182 4.34 Influence of replacing a solid slab by a slab with metal decking
of identical thickness for beam SRM-29 of Table IV.2...183 4.35 Span limitations on beams with welded sections and solid
con-crete slabs in function of the connector ratio and of different slip capacitylimits...184 4.36 Load-slip curves of studs which vary in strength but not
signifi-cantly in tangential stiffness...185 4.37 Influence of the design method, the Grade of steel, and the
con-nector ratio on the maximum slip along beam SEBC 8 of Tables 4.16 and 4.18...186 4.38 Influence of the design method, the Grade of steel, and the
con-nector ratio on the maximum slip along beam SEBC 17 of Tables 4.16 and 4.18...187 4.39 Influence of the design method, the stud shear strength, and
the connector ratio on the maximum slip along beam EBC 2 of Tables4.17 and 4.19...188 4.40 Influence of the design method, the stud shear strength, and
the connector ratio on the maximum slip along beam EBC 8 of Tables4.17 and 4.19...189 4.41 Relationship between the percent of slip increase with the
per-cent of load increase of a number of beams from Table 4.18 for varyingconnector ratios...190 4.42 Influence of the design method and the connector ratio on the
maximum slip along beam SEBC 13 of Table 4.18...191 4.43 Comparison between moment, shear force and slip distributions
4.44 Comparison between moment, shear force and slip distributions along beam SEBC 16 at different degrees of interaction for the
two design methods of Eurocode 4...195
4.45 Moment, shear force and slip distributions along beam EBC 3 (= SEBC 6) at different degrees of interaction for the equilibrium methodin BS5950:Pt.3...198
4.46 Moment, shear force and slip distributions along beam EBC 10 (= SEBC 16) at different degrees of interaction for the equilib-rium method in BS5950:Pt.3...200
5.2 Relationships between the degree of shear connection and the load-factor at different constant maximum slips...207
5.1 Limitations on the span of beams with solid slabs in function of the connector ratio and different characteristic slip capacity limits.206 6.1 Cross-section of half 'through'-type riveted railway bridges. . . 220
6.2 U-frame of half 'through'-type bolted bridge girders...220
6.3 Inverted U-frame of composite bridge girders...221
6.4 Deflection breakdown for U-frame of half 'through'-type bridge 221 6.5 Theoretical rotations of the transverse member of the inverted U-frame or series of U-frames at the intersection with the longi-tudinalbridge beams...222
6.6 Strut analogy for the compression flange of the half 'through'-typebridge girder...223
6.7 Test layout simulating all forces in the real bridge girder...224
6.8 Chosen test layout, ignoring the longitudinal forces...225
6.9(a) Transverse cracks caused by longitudinal bending...226
6.9(b) Longitudinal cracks caused by transverse bending...226
6.10 Mechanical modelling of the test layout...227
6.11 Influence of different support conditions on mechanical model. . 228
7.1 Test specimen as that part of a longitudinal bridge girder which acts as an inverted U-frame...247
7.4 Slotted and non-slotted stud configurations for the different test specimens...250 7.5 Plate of fabricated steelwork for test specimen BM3...251 7.6 Plate of fabricated steelwork for test specimen BM4...252 7.7 Detailing arrangements of the transverse reinforcement in the
slabs of the different test specimens...253 7.8 Two different detailing arrangements of the longitudinal
rein-forcement in the slabs of the different test specimens...254 7.9 Casting sequence of the 5 different batches of concrete needed
to cast the slabs of the test specimens...249 7.10 Plate of the test rig with test specimen BM7 mounted...255 7.11 Schematic representation on elevation of test lay-out and
mea-surements on specimens BM2 to BM7...256 7.12 Schematic representation on plan of test lay-out and
measure-ments on specimens BM2 to BM7...257 7.13 Reduction of the lateral movement at point T, due to spherical
bearings...258 7.14(a) Details of spherical bearings at both ends of the slab...259 7.14(b) Hinge at the top of the channels ...259 7.15 Schematic representation on plan and on elevation of test lay-out
and measurements on specimen BM1...260 7.16 Dimensions of coupons for tensile testing taken from the top
flangeand of the studs...261 7.17 Moment and shear force diagram under total applied loads for
specimenBM5...262 7.18 Main crack pattern in the slab of test specimen BM2, with
in-dication of load cycle (Roman numeral) and load levels and dis-placementlevels...263 7.19 Main crack pattern in the slab of test specimen BM3, with
in-dication of load cycle (Roman numeral) and load levels and dis-placementlevels...264 7.20 Main crack pattern in the slab of test specimen BM4, with
7.21 Main crack pattern in the slab of test specimen BM5, with in-dication of load cycle (Roman numeral) and load levels and
dis-placementlevels...266 7.22 Main crack pattern in the slab of test specimen BM6, with
in-dication of load cycle (Roman numeral) and load levels and
dis-placementlevels...267 7.23 Main crack pattern in the slab of test specimen BM7, with
in-dication of load cycle (Roman numeral) and load levels and dis-placementlevels...268 7.24 Plate of the pull-out failure of the studs in test specimen BM2 269 7.25(a) Plate of side-elevation R of the connection of test specimen BM3,
asindicated on Fig. 7.12...270 7.25(b) Plate of side-elevation L of the connection of test specimen BM3,
asindicated on Fig. 7.12...271 7.26(a) Plate of side-elevation R of the connection of test specimen BM4,
asindicated on Fig. 7.12...272 7.26(b) Plate of side-elevation L of the connection of test specimen BM4,
asindicated on Fig. 7.12...273 7.27(a) Plate of side-elevation R of the connection of test specimen BM5,
asindicated on Fig. 7.12...274 7.27(b) Plate of side-elevation L of the connection of test specimen BM5,
asindicated on Fig. 7.12...275 7.28(a) Plate of side-elevation R of the connection of test specimen BM6,
asindicated on Fig. 7.12...276 7.28(b) Plate of side-elevation L of the connection of test specimen BM6,
asindicated on Fig. '7.12...277 7.29(a) Plate of side-elevation R of the connection of test specimen BM7,
asindicated on Fig. 7.12...278 7.29(b) Plate of side-elevation L of the connection of test specimen BM7,
asindicated on Fig. 7.12...279 7.30 Relationship between the applied transverse moment and the
7.31 Relationship between the applied transverse moment and the rotations of the slab, the stiffener and the connection, around theX-axis for test BM3...281 7.32 Relationship between the applied transverse moment and the
rotations of the slab, the stiffener and the connection, around theX-axis for test BM4...282 7.33 Relationship between the applied transverse moment and the
rotations of the slab, the stiffener and the connection, around theX-axis for test BM5...283 7.34 Relationship between the applied transverse moment and the
rotations of the slab, the stiffener and the connection, around theX-axis for test BM6...284 7.35 Relationship between the applied transverse moment and the
rotations of the slab, the stiffener and the connection, around theX-axis for test BM7...285 7.36 Relationship between the applied transverse moment and the
tensile forces in the shanks of the studs of test specimen BM2. . 286 7.37 Relationship between the applied transverse moment and the
tensile forces in the shanks of the studs of test specimen BM5. . 287 7.38 Relationship between the applied transverse moment and the
tensile forces in the shanks of the studs of test specimen BM4. . 288 7.39 Relationship between the applied transverse moment and the
tensile forces in the shanks of the studs of test specimen BM7. . 289 7.40 Relationship between the applied transverse moment and the
tensile forces in the shanks of the studs of test specimen BM6. . 290 7.41 Average value of the Young's modulus of the shank steel from
sixcoupon tests...291
8.1 The difference between the applied forces to the studs
F,,
and the calculated forces F3h from the strain measurements in the shanksof the studs...329 8.2 Three qualitative curves representing the relationship betweenthe transverse moment and the relative rotation of the connection.329 8.3 Truss analogy of the internal force distribution within the test
8.4 The action and reaction (RF3 ) forces on the connection, due to the transverse force F ... 331 8.5 Moment and shear force distributions in the concrete slabs, tested
for their shear resistance...331 8.6 Size effect on the nominal shear strength of concrete at failure,
aspresented in Ref. [99]...332 8.7 Different transverse spacings of the studs, and corresponding
stress distributions over the steel-concrete interface...333 8.8 Lever arm between the resultant forces in the effective stiffener 334 8.9 Punching shear failure surface underneath a stud head of a stud
in tension, according to Ref. [112]...335 8.10 Transverse moment - relative rotation curves upto first visible
shear cracking for all six test specimens...336 8.11 Three dimensional representation of the interaction between slab
and top flange, modelling the studs as springs and the contact pressure as a higher order curve...337 8.12 Two dimensional model of the interaction between slab and top
flange as an equivalent plate on elastic foundations...338 8.13 Finite Element mesh of the connection of the test specimen. . . 339 8.14 Variation of the transverse flexibility of the connection at the
position of the vertical web stiffener with the longitudinal stud spacing at two different load levels...340 8.15 Influence of the relative position of the studs to the vertical web
stiffener on the transverse flexibility...341 8.16 Variation of the transverse flexibility of the connection at the
position of the vertical web stiffener with the transverse stud spacing either side of the web at two different load levels...342 8.17 Relevant parameters for the flexibility of a bolted beam - column
flush end plate steel connection...343 8.18 Relevant parameters for the flexibility of a steel beam - concrete
column embedded stud anchor connection...343 8.19 Steel beam - concrete slab connection of the tested specimens. 343 8.20 Qualitative representation of the progressive increase of the
9.1 Variation of the transverse flexibility of a stud connection, with N < 12, at the position of a two sided vertical web stiffener with the longitudinal spacing of the studs...349 1.1 Ideal plastic load - slip behaviour of the stud connectors...364 1.2 Qualitative graph of the relationship between the load ratio and
the connector ratio for both interpolation and equilibrium meth-ods...364 1.3(a) Strain and stress diagram of composite cross-section with partial
interaction in sagging bending with the plastic neutral axis in thetop steel flange...365 1.3(b) Strain and stress diagram of composite cross-section with partial
interaction in sagging bending with the plastic neutral axis in the web of the steel profile...365 1.4(a) Strain and stress diagram of composite cross-section with
par-tial interaction in hogging bending with the plastic neutral axis outside the concrete slab...366 1.4(b) Strain and stress diagram of composite cross-section with partial
interaction in hogging bending with the plastic neutral axis in theconcrete slab...366 11.1 Different slab geometries as defined by EPPIB...377 11.2 Geometry and loading as defined by EPPIB...378 V.1 Cross-section through a three span composite plate girder bridge
withinverted U-frame action...405 V.2 Most severe transverse position of HB-vehicle load for maximum
loadingon the inner girder...405 V.3(a) Load configuration for maximum bending over the internal
sup-port...406 V.3(b) Load configuration for maximum shear force at the internal
sup-port...406 V.4 Cross-section of an unstiffened girder in the hogging bending
region with indication of the elastic neutral axis...407 V.5 Theoretical model of resultant force distribution over the top
flangeof the plate girder...407 V.6 Transverse load configuration which produces maximum shear
List of Tables
2.1 Comparisons of design values for M, F and N from three dif-ferent Codes of Practice, of a number of beams from Ref. [11]. 18 2.2(a) Results of tests on simply-supported composite beams...19 2.2(b) continued ...20
3.1 Coefficients for polynomial stress-strain curves of concrete. . . 51 3.2 Error made with Newton-Coates integration for different and
qcombinations...52 3.3 Geometry of three beams used in the study of the differences
between continuous and discrete shear transfer...53 3.4 Results of study of shear transfer, given as differences between
results (R) for first and second layout, percent; i.e. as 100(R1
-R2
)/R1
...
533.5(a) Geometry and material properties of beam used for the experi
-mental validation of the numerical programme...54 3.5(b) continued ...55 3.6 Measured and calculated slip distributions and maximum
deflec-tionsfor beam
P1
in 3.5 ...56 3.7 Measured and calculated slip distributions and maximumdeflec-tionsfor beam
P3
in 3.5 ...57 3.8 Measured and calculated slip distributions and maximumdeflec-tionsfor beam
P2
of 3.5 ...58 3.9 Measured and calculated slip distributions and Tmaximumde-flections for beams B
2
,B3
andB4
in 3.5 ...59 3.10 Measured and calculated values of the slip, the maximum3.11 Measured and calculated values of the slip and the deflection along beams T1 , T2 and T3 of 3.5 ...61 3.12 Measured and calculated values of the curvature and the strains
in the extreme fibres of the concrete slab and the steel profile along beams T1 , T2 and T3 of 3.5 ...61
4.1 Geometry and material properties of beams Bi and B2, used in the parameter study of 'Ye and 'Vp... 123 4.2(a) Results of maximum elastic and plastic slip along Beam 1 in 4.1
for varying geometric and material parameters...124 4.2(b) continued ...125 4.3(a) Comparison of 'y and y, values at 50% interaction for different
parametric changes of beam B2 of 4.1...125 4.3(b) (continued ...) ...126 4.4 Measured and calculated ultimate shear strength of studs in
composite slabs with different deck geometry...128 4.5 Geometry, material properties and design values for beams Bi
and B2 used in the study of the influence of the load-slip curve onthe maximum slip...127 4.6 Examples of design calculations to draft Eurocode 4 ...128 4.7(a) Values of 'V,(50) obtained with EPPIB for different two-span
continuouscomposite beams...131 4.7(b) (continued ...) ...132 4.8 Values of 'ym(5O) obtained with EPPIB for simply supported
beams with identical spans, cross-sections and material prop-erties as for the largest span of the corresponding continuous beamsin 4.7. ...133 4.9(a) Parametric values of 45 roIled sections with solid slabs used for
the exponential and polynomial regression analyses...129 4.9(b) continued ...130 4.10 Exponential curve fitting for the maximum slip at 50% interaction.13]. 4.11 Exponential curve fitting for the maximum slip at 75% interaction. 132 4.12(a) Second order polynomial prediction equation for 'ym( 5O ), without
4.12(b) Second order polynomial prediction equation for ym(S0), without
constant term, in function of l/h±,(w - Wpa)/Wpa and . . 138 4.13(a) Second order polynomial prediction equation for ym(75), without
constant term, in function of
l/h,(w -
wpa)/Wpa and Fc/Fa. . 139 4.13(b) Second order polynomial prediction equation for y,(75), withoutconstant term, in function of i/h,(w - Wpa)/ Wpa and y/t. . . 139 4.14(a) Second order poiynomial prediction equation for ym(5O ), with
constant term, ok in function of l/h,(w - Wpa)/Wpa and FcIFa . 140 4.14(b) Second order polynomial prediction equation for 7m(50), with
constant term, in function of
1/h,(w -
Wpa)/Wpa and y/t. . . 140 4.15(a) Second order polynomial prediction equation for y,,(75), withconstant term, in function of 1/h,(w Wpa)IWpa and Fc/Fa. . 141 4.15(b) Second order polynomial prediction equation for ym(75), with.
constant term, in function of l/ht,(w - Wpa)/Wpa and y /t. . . 141
4.16 Values of Yrn for Grade 43 steel proflles,analysed according to the interpolation method (ECI) and the equilibrium method (ECE) in Eurocode 4, and according to the equilibrium method inBS5950:Pt.3 (BSE) ...142 4.17 Influence of the stud shear strength on the maximum slip along
beams with same geometry and material properties as certain beamsin 4.19 ...143 4.18(a) Comparison of y values produced by EPPIB for loads
gener-ated by both the interpolation (ECI) and the equilibrium (ECE) method of Eurocode 4 onto the same beams...144 4.18(b) (continued ...) ...145 4.18(c) (continued ...) ...146 4.18(d) (continued ...) ...147 4.18(e) (continued ...) ...148 4.19(a) Comparison of 'y -values for simply supported beams produced
by EPPIB for data generated by the equilibrium methods of Eurocode 4 (ECE) and BS 5950:Pt.3 (BSE)...149 4.19(b) (continued...) ...150
7.3 Proof stress of different reinforcement bars ...246
7.4 Tests on concrete samples according to BS.1881 ...246
8.1 Absolute (AER) and percent relative (PER) error for the values
of Ft... 317
8.2 Derivatives of main parameters to F for BM3...318
8.3 Derivatives of main parameters to F for BM4...319
8.4 Derivatives of main parameters to F for BM6...320
8.5 Derivatives of main parameters to F for BM7...321
8.6 Cracking and failure loads of the different test specimens. . 322
8.7 Lever arm between resultant tensile force in the studs F3 , and resultant compressive reaction of the slab RF ... . 323
8.8 Prediction of applied transverse diagonal cracking load, using. Zsutty's [108] shear cracking eq.(8.8), and of the ultimate load, usingBaant's eq.(8.11)...324
8.9 Prediction of applied load at initial internal diagonal cracking, using Zsutty's [108] shear cracking eq.(8.8)...325
8.10 Theoretical Pull-out strength of the groups of studs in tension in the different test specimens...326
8.11 Different values for the transverse flexibility of all tested speci-men, within the elastic range...327
8.12 Correlation between parameters effecting the flexibility in a flush-end plate connection and in the steel beam - concrete slab
con-nection...328
9.1 Ratios of the calculated transverse flexibilities of the tested con-nections to the calculated flexibiities of the stiffened web and the slab of the plate girder in Appendix V...348
IV.1(a) Maximum slip along composite beams with solid concrete slabs and rolled steel profiles, for different degrees of shear connection. 382
IV.1(b) (continued ...) ...383
IV.1(c) (continued ...) ...384
IV.1(d) (continued ...) ...385
IV.2(a) Maximum slip along composite beams with rolled steel profiles and composite slabs, spanning perpendicular to the beam, for different degrees of shear connection...387 IV.2(b) (continued ...) ...388 P1.2(c) (continued ...) ...389 P1.3(a) Maximum slip along composite beams with solid concrete slabs
and welded steel profiles, for different degrees of shear connection. 390 P1.3(b) (continued ...) ...391 IV.3(c) (continued ...) ...392 VI.1 Calculated relative rotations of the connection from inclinometer
and dial gauge readings for test specimen BM2...408 VI.2(a) Calculated relative rotations of the connection from inclinometer
and dial gauge readings for test specimen BM3...409 VI.2(b) Calculated relative rotations of the connection from inclinometer
and dial gauge readings for test specimen BM3...410 VI.3(a) Calculated relative rotations of the connection from inclinometer
and dial gauge readings for test specimen BM4...411 VI.3(b) Calculated relative rotations of the connection from inclinometer
and dial gauge readings for test specimen BM4...412 VI.4(a) Calculated relative rotations of the connection from inclinometer
and dial gauge readings for test specimen BM5...413 VI.4(b) Calculated relative rotations of the connection from inclinometer
and dial gauge readings for test specimen BM5...414 VI.5(a) Calculated relative rotations of the connection from inclinometer
and dial gauge readings for test specimen BM6...415 VI.5(b) Calculated relative rotations of the connection from inclinometer
and dial gauge readings for test specimen BM6...416 VI.6 Calculated relative rotations of the connection from inclinometer
and dial gauge readings for test specimen BM7...417 VI.7 Measured strains and corresponding calculated forces in the shanks
of the studs in tension of test specimen BM2 ...418 VI.8 Measured strains and corresponding calculated forces in the shanks
VI.9 Measured strains and corresponding calculated forces in the shanks of the studs in tension of test specimen BM4 ...420 VI.10 Measured strains and corresponding calculated forces in the shanks
of the studs in tension of test specimen BM5 ...421 VI.11 Measured strains and corresponding calculated forces in the shanks
of the studs in tension of test specimen BM6 ...422 VI.12 Measured strains and corresponding calculated forces in the shanks
List of Notations
A cross-sectional area
Aa cross-sectional area of the steel profile
A cross-sectional area of the concrete slab
A1 sum of cross-sectional areas of top and bottom flange of steel profile
A1 cross-sectional area of compression flange of steel profile
A, cross-sectional area of the top flange of the steel member when
i = 1, of the web when i = 2 and of the bottom flange when i=3
Ar total area of top and bottom layer of reinforcement in the slab
Arb area of bottom layer of reinforcement
Art area of top layer of reinforcement
A3 cross-sectional area of tension reinforcement cross-sectional area of shank of stud
cross-sectional area of the web
a shear span in concrete beams
a shear span of high shear between the studs in tension (F3 ) and the reaction (RF3 ) in Fig. 8.4, due to a transverse moment applied to the connection.
a1 shortest distance between fitted vertical web stiffener and studs in the longitudinal direction
a8 distance between resultant tensile and compressive forces in ver-tical effective web stiffener under transverse elastic bending
aj shortest distance between stud and web in transverse direction
b breadth
b breadth of slab
be effective breadth of slab b1 breadth of steel flange
bf breadth of compression flange bh breadth of haunch
b2 breadth of top flange when i = 1, of web when i = 2 and of bottom flange when i = 3
b0 width over which initial internal crack forms under transverse force
d effective depth of beam or slab
dh diameter of stud head
E elastic modulus
Ea elastic modulus of structural steel
E elastic modulus of concrete
E strain-hardening modulus of structural steel
E3h elastic modulus of shank of studs F longitudinal force
Fa longitudinal force in steel profile F longitudinal force in concrete slab
Fe,. pull-out strength of studs when determined by the shear strength of the conical failure surface of concrete
longitudinal interface shear force at critical cross-section where the moment reaches M
F longitudinal interface shear force at critical cross-section where the moment reaches M,
Fr longitudinal force in the reinforcement at the internal support
F3h axial tensile force in the shank of the stud F3 axial tensile force in the stud
F transverse force applied at the centroid of the compression flange or transverse tensile force applied by the jack to the test specimen
Ftcr transverse load at which diagonal cracking first became visible
at both sides of the tested specimen
maximum transverse force the tested specimen is able to resist
F0 transverse force at which initial internal cracking starts, before
this crack has spread over the whole width of the test specimen transverse force at which the initial diagonal cracking has spread over the whole width of the test specimen
transverse force at which a second diagonal crack will form par-allel with the first one
f transverse flexibility of a bolted connection in a U-frame or
in-verted U-frame
fay yield stress of structural steel
fad design value of the yield stress of structural steel = fay/ya f cylinder strength of concrete
fcb strength of concrete obtained from the modulus of rupture test
fed design value of the cylinder strength of concrete = fk/y fck characteristic value of the cylinder strength of concrete fT strength of concrete at which the concrete cracks
let tensile splitting strength of concrete
cube strength of concrete
fT transverse flexibility of embedded stud connection as part of an
inverted U-frame
fly yield stress of reinforcement
tensile strength of concrete
h depth or height ha depth of steel beam
overall depth of beam
hh
height of the shank of the studh3 overall height of studs after welding h depth of web of steel beam
I second moment of area
'a second moment of area of steel beam
I second moment of area of uncracked composite section
second moment of area of uncracked concrete slab
i = 1, ..., ri numbering of nodes
k elastic spring constant of concrte slab as elastic support to steel
flange
k3 elastic spring constant of the embedded studs
M Ma MD IVImax M Mpa M M j%,fel pp M3 M
span of beam
effective length of unrestrained compression flange
length of lever arm between point where the transverse load, F,
is applied and the top of the top flange longitudinal spacing between U-frames
bending moment in equilibrium with external loads bending moment in steel beam
bending moment in concrete slab
design value of moment of resistance at support in notation of BS 5400:Pt.3
maximum bending moment reached in a test or a beam
plastic moment of resistance of a composite section with full shear connection
plastic moment of resistance of steel profile alone
plastic moment of resistance of composite beam with partial shear connection, according to eq. (2.1)
plastic moment of resistance in of composite beam in sagging bending with partial shear connection, according to equations (1.2) or (1.3)
plastic moment of resistance of composite beam in hogging bend -ing with partial shear connection, accord-ing to equations (1.4)
or (1.5)
computed hogging moment at internal support
transverse moment at the interface of the steel girder with the concrete slab = F 1h
maximum transverse moment the tested specimen is able to resist
transverse moment at which initial internal cracking starts, be-fore this crack has spread over the whole width of the test specimen
transverse moment at which the initial diagonal cracking has spread over the whole width of the test specimen
transverse moment at which a second diagonal crack will form parallel with the first one
m modular ratio for concrete
m3 strain-hardening factor for structural steel
N number of shear connectors between two adjacent critical cross-sections
N1 value of N for full shear connection in accordance with either the draft Eurocode 4 or the draft BS 5950:Pt.3.
P vertical point load on a beam
Pdj dead load component of the ultimate value for the point load on span i
P ultimate value for the point load on span i
Q longitudinal shear force on one connector Qd design shear strength per stud = Qk/7m Q k characteristic shear strength per stud
Qt, ultimate value of the shear strength Q, obtained from Push-Out tests
q longitudinal shear per unit length at steel-concrete interface
R reaction force or resultant force
RF5 resultant compressive force applied by the concrete slab to the top flange under a transverse moment M
RF resultant compressive force applied by the concrete slab onto the top flange under a transverse moment M
t depth or thickness
t depth of concrete slab
t thickness of the compression flange
th depth of metal decking within the slab
t depth of the top flange when i = 1, depth of the web when i = 2, and depth of the bottom flange when i = 3
t,, thickness of web of steel member
-V vertical shear force
Va vertical shear force in steel beam V vertical shear force in concrete slab
VD design ultimate shear force in the notation of BS5400:Pt.3 vu shear failure of a beam
V vertical deflection of a beam
Vmax maximum computed deflection of a beam
vs computed deflection at the position of the central support
w uniform distributed load
Wd dead uniform distributed load
Wdt dead uniform distributed load on span i
ultimate uniform distributed load
wul ultimate uniform distributed load on span i
wp theoretical plastic collapse load of a composite beam with full shear connection
Wpa theoretical plastic collapse load of a steel beam
v4
theoretical plastic collapse load of a composite beam with partial shear connection, using the interpolation methodwp theoretical plastic collapse load of a composite beam with partial shear connection, using the equilibrium method
x distance along the X—axis
position of point load i along th X—axis
Xm distance between the external support and the position of max-imum moment under ultimate loading conditions
x5 longitudinal spacing between studs
x longitudinal spacing between studs in shear span i along the beam
Y distance along the Y—axis
Ya distance between the neutral axis of the steel profile and the top
fibre of the top flange
Yc distance between the neutral axis of the concrete slab and the
top fibre of the slab
Ye depth of the elastic neutral axis of the composite beam below
the top of the slab
YP depth of the plastic neutral axis of the composite beam below
the top of the slab
Yr distance between the steel top flange and the neutral axis of the
cracked concretre slab
Z lever arm between Fa and F
Za distance between mid-height of steel profile and the top fibre of the top flange
Z distance between mid-height of concrete slab and the top fibre of the slab
ar,. angle betweeen the horizontal center-line through the slab and the diagonal shear crack due to F and M
/3 coefficient of the exponential function which models the load -slip behaviour of a stud connector embedded in a concrete slab
/3, consecutive diminishing slopes of the qualitative M - 9,. curve,
which represents the behaviour of the steel - concrete joint of an inverted U-frame
5 transverse deflection of the centroid of the compression flange of a steel girder as part of a U-frame or inverted U-frame.
6, different components of the transverse deflection S due to the transverse flexibility of the web (i=1), the transverse stiffness of the slab or the cross-member (i=2) and the transverse flexibility of the connection (i=3) between girder and slab or cross-member
strain
the strain in the bottom fibre of the steel profile
Earn the strain limit in Fig. 3.10 on the strain in the steel profile in the forward integration routine of EPPIB
the strain in the top fibre of the steel profile
Ea11 the yield strain of the structural steel profile
Eap the strain of the structural steel proffle at the end of the yield
plateau
the strain in the bottom fibre of the concrete slab
the strain limit in Fig. 3.10 on the strain in the concrete slab in the forward integration routine of EPPIB
the strain in the top fibre of the concrete slab
the tensile strain measured in the shank of the stud connector, 50mm above the base
the strain in the concrete slab corresponding with o, generally —0.002 or —0.0025
-y slip
Ya partial safety factor on the yield strength of steel
partial safety factor on the characteristic strength of concrete maximum elastic slip along a beam
7rn partial safety factor on the limiting buckling stress or partial
safety factor on the characteristic shear strength of the studs
Ym(ax) maximum value of slip along a beam, either elastic or plastic
7max,b maximum slip reached along a beam 7maz.p maximum slip reached in a Push-Out test
maximum plastic slip along a beam
partial safety factor on the yield strength of reinforcement
load factor ratio w/w
ii Poisson coefficient of steel
curvature
p density of concrete
p,. percentage of reinforcement in the concrete slab (100 A/(b d))
9 rotation
rotation of the concrete slab at the position of the connection
9r relative rotation of the steel flange - concrete slab connection
relative rotation of the stud connection, calculated from the in-clinometer readings
relative rotation of the stud connection, calculated from the ver-tical displacements on the dial gauges D4 and D5
rotation of the top flange near the vertical stiffener of the com-posite inverted U-frame connection
stress
the stress in the structural steel profile the stress in the concrete slab
o,. the elastic critical buckling stress of the composite beam 5fc the design stress in the compression flange
a11 the limiting buckling stress
o the maximum compressive stress in the concrete slab
the yield stress of the compression flange
Chapter 1
General Introduction
Under pressure of economy, engineers in building and bridge design aim at making structures simpler in order to reduce the material, fabrication and construction costs and hence to reduce the total cost of the structure. The use of composite and steel beams becomes more material economical than the use of concrete beams for spans of more than about 10 m, although composite and steel construction always shortens the construction time compared to in situ concrete construction. For deflection purposes of composite beams in buildings, these longer spans might need propping. By using continuous composite construction the need for props will often disappear and the erection time of the frame is reduced, thus leading to even larger savings. In a building structure, the total time of construction is mainly determined by the time to construct one floor. Since time equals money, metal decking as permanent formwork and precast concrete slabs were introduced to enhance conhposite floor construction. Both flooring systems, especially the former one, lead to partial shear connection design. The number of shear con-nectors provided in such floors depends on the shape and direction of the metal decking and the shape of the precast slab units. In the past fifteen years a lot of experimental and theoretical research has been done on partial interaction de-sign. Since this work focussed mainly on beams with relatively short spans, and it is composite beams with larger spans that tend to be more economical, more information is required on their behaviour.
slenderness restrictions permanent bracing could be eliminated altogether, except at the supports. The elimination of bracing and the introduction of vertical web stiffeners to obtain discrete inverted U-frame action assumes transverse strength and stiffness of the stud connection between the top steel flange and the con-crete deck. Although similar values for stiffness are available for typical bolted connections, so far no values have been produced for stud connections.
Both these problems on partial interaction and on transverse stiffness are related to the behaviour of the shear connectors between the concrete slab and the steel girder under ultimate loading conditions. Similarly, both of them arise from the need for simplification in the design of composite beams.
Since these two problems are so different from each other it was decided to research them separately and to discuss them in separate parts of this thesis.
In the first part the behaviour of composite beams with partial shear connec-tion is studied. An attempt is made to give limitaconnec-tions on the beam character-istics with partial shear connection in order to prevent premature brittle shear stud failure before ductile flexural failure of the beam occurs under an increasing load. This part consists of four chapters:
In Chapter 2, a study is presented of previous experimental and theoretical research on partial interaction and of relevant design methods. Based on ex-perimental evidence, the danger of sudden stud shear failure for long spans is highlighted and a numerical simulation is proposed.
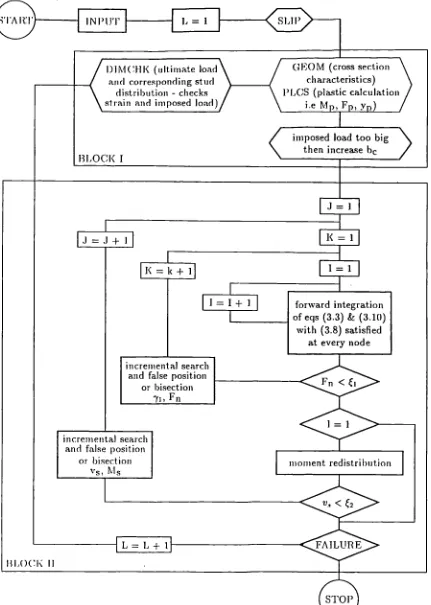
In Chapter 3, a known physical model for the simulation of composite beam behaviour is implemented as a numerical programme, which uses a forward inte-gration technique to simulate the stresses and displacements of a real composite beam. The problems encountered with this numerical approach are discussed briefly and the assumptions made in the model are checked. Finally, the pro-gramme is validated using experimental evidence from different sources.
In the concluding Chapter 5 of this part, a simple design rule for Eurocode 4 is proposed and further work on this subject is proposed.
The second part of this thesis describes and analyses a number of tests on the transverse flexibility of the embedded stud connector 'joint' between a plate girder with vertical web stiffeners and the concrete slab. Although the stud connectors are provided along the top flange for longitudinal shear transfer between the concrete deck and the steel girder, those placed in the vicinity of vertical stiffeners, which form part of the inverted U-frame, are also subject to transverse shear and tensile forces, due to the inverted U-frame action. It is these stud connectors which form as it were a 'joint' of the inverted U-frame. Just as for bolted steel U-frame joints, values for the transverse rotational flexibility are needed, which are produced by the experiments. This part consists also of four chapters:
Chapter 6 reviews the background to inverted U-frame action design, as given in BS 5400:Pt. 3 [7]. It also provides criticism of the conservatism of these design methods. Finally it traces back the influence of the flexibility of the joint on the design.
Chapter 7 describes the test rig and the testing procedure and discusses the measurements taken on six different test specimens. It also gives the test results and a discussion of the errors in these results.
In Chapter 8, the failure modes of the test specimens are analysed using different shear cracking models, and curves of moment against transverse rotation of the 'joints' of the test specimens are drawn up. A parallel is drawn between the moment-rotation characteristic for this joint and for the flush end plate beam-to-column connection, which leads to sketchy predictions about the behaviour of joints with different geometry.
Part I
Partial interaction of composite
Chapter 2
The problems of Partial
Interaction
2.1 Origin of partial interaction
The development of shear connectors in the early 1950's made it possible to connect a concrete slab to a steel girder to obtain a composite beam with full T-beam action. In the design of such beams with in situ concrete slabs it is usual practice to provide sufficient shear connectors for the effects of longitudinal slip and uplift to be negligible. However, tests have shown that even when "full-interaction" behaviour is achieved, relative longitudinal movement between the slab and the flange does exist at very small loads.
For multi-storey buildings the construction time is much influenced by the time needed to construct a typical floor. Since speeding up the construction time indirectly saves the developer money, structural steel has an advantage over in
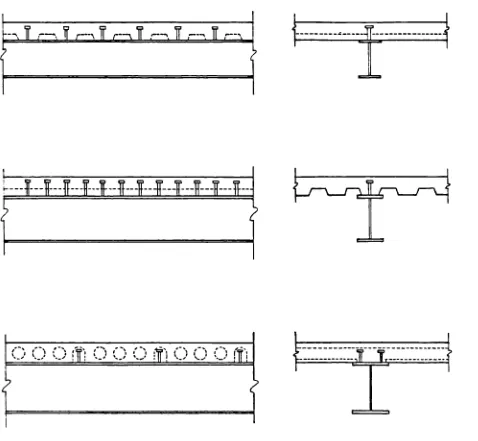
situ concrete as long as the in situ slabs are replaced either by composite slabs, where corrugated metal decking acts as permanent formwork, or by precast floor slabs. The former type of slabs were originally widely used in North America, while the latter type of floor slabs were for the most part used on the Continent [9][10]. For both these types of slabs welded studs are the most commonly used type of connector. They are classified as "ductile" in draft Eurocode 4 [3]. In Fig. 2.1 it is made clear that the number of stud connectors that can be placed along one girder becomes dependent upon either the direction and trough width of the metal decking or the geometry of the precast slab. For most of these slabs
lower ultimate strength of the composite beam.
In any "partial-interaction" design method a relationship between the number of connectors and the ultimate strength of the beam is aimed for, so that the reduction in stiffness which affects the deflections and stresses under working loads can be ignored, and this for all levels of interaction permitted in the design rule.
2.2 Review of research background to present
Codes of Practice
2.2.1 Background to present Partial Interaction design
methods
Experimental research done in the 1960's by Chapman and Balakrishnan [11] led to those clauses in CP 117:Pt.1:1965 [1] which contain the ultimate strength full interaction design method, the calculation of the corresponding number of connectors N1 , and the spacing of connectors, following the shear flow diagram. Since it was economically impossible to incorporate a systematic variation of different composite beam parameters in these test series, a theoretical study was needed.
Yam and Chapman [12] [13] developed therefore a numerical programme which simulates the behaviour of a composite beam and which made it possible to study composite beam behaviour, both in strength and deflection, under the full range of geometric and material parameters.
Since the use of metal decking and precast concrete slabs became more wide-spread, there grew a need to place fewer shear connectors than the number re-quired by CF 117:Pt 1:1965. However, English [12], American [14] and Dutch [15] research had shown that the use of fewer connectors would reduce the ul-timate strength of the beam below the value obtained by the ulul-timate strength full interaction method and that deflections under service loads could become excessive.
the design ultimate strength of the steel section M as shown in eq. (2.1):
M '=Mpp pa+(MpMpa) (2.1)
and 1.0 ^ N ^ 0.5
This simple linear design rule is called the interpolation method. It was first obtained by Johnson and May [16] and is based on different theoretical and exper-imental results [12] [14] [151. The connector ratio limit of 0.5 was a conservative estimate mainly based on test results originating from TNO Delft [15] and the University of Missouri [17] [18].
In Europe, Frodin, et al. [19] came to the conclusion that the same span to depth ratios as for the full interaction design method could be kept for partial interaction design as long as eq. (2.1) is used and the connector ratio limit of 0.5 is respected.
When the Eurocode 4 [3] was drafted in the early 1980's, the method of calcu-lation adopted for the ultimate strength of beams with partial shear connection, was mainly based on the above described research done in the 1960's and '70's, and the stud spacing became unifortu betweei critical sections of maximizm or
zero moment. The final design method was formulated by Stark from the Nether-lands. As he assumed in his own research that flexible stud connectors are able to produce an infinite slip [20] under ultimate shear load, he incorporated the equilibrium method as an alternative to the interpolation method for flex-ible connectors on purely theoretical grounds and extended the validity of eq. (2.1) to continuous composite beams of class 2. Both methods are compared in Appendix I. Except for limiting the connector ratio to 0.5 and the span to 20 m, no other limitations were given to eq. (2.1), which in Eurocode 4 became valid for both simply supported and continuous composite beams with flexible connectors of class 1 or 2. This limit on the span stems from the span limitation for plastic analysis of continuous composite beams, as studied by Johnson and Hope-Gill [21], to prevent buckling.
which excludes the possibility of stud shear failure. In order to eliminate the possibility of this type of brittle failure, a relationship was introduced between the span and the connector ratio, in clause 4.5.2 of BS 5950:Pt.3. This relationship was largely based on a report [80], which contains parts of chapters 4 and 5 of this thesis.
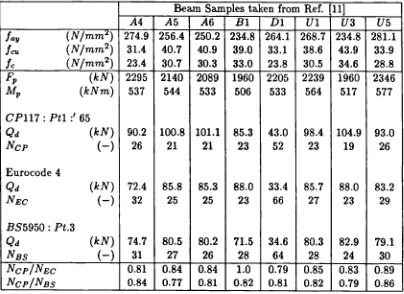
In Table 2.1 a comparison is made between the earlier CP 117 [1] and the two more recent Codes [3] and [4]. In this table the design values of the plastic moment capacity M, of the longitudinal interface shear force F, and of the corresponding number of studs N, are calculated for eight beams from Chapman's and Balakrishnan's experiments [11], using the above mentioned Codes.
The values of M and F are identical for all three Codes, but the number of connectors required for full interaction (Ncp, NEC and NBS) is always smaller in CP 117 than in the more recent ones. Note that the cylinder strength is the average of the converted cube strength and the cylinder strength measured for these tests, using the same conversion as given in section 2.2.2. This table also shows that for beams with solid slabs, full interaction in CP 117 corresponds with approximately 80% interaction in both Eurocode 4 and BS 5950:Pt.3.
In comparing the lower limits on the shear connector ratio in Eurocode 4 against the limits in BS 5950:Pt.3, it has to be remarked that, together with lowering the ratio from 0.5 to 0.4, the effective breadth of the slab has decreased from L/4 to L/5 for continuous beams and the design shear strength of the most commonly used 19 mm diameter stud connectors has reduced by 10%. Only for continuous beams with the neutral axes in the steel girder these changes in effective breadth and ultimate concrete design stress will increase the reduction in connector ratio as demonstrated below:
BS 5950:Pt.3: = 0.4N1 = 0.40.45 Pd5 Eurocode 4: NEf = 0.5Nf = 0 50.45fbL
i.lPd4
so that NJ' = 1.4N
2.2.2 Experimental evidence
A study was made of the experimental supporting evidence of the current design methods, in order to locate possible areas where these methods, as they stand today, might become unsafe.
To the knowledge of the author, none of the experiments on simply supported and continuous beams with welded stud connectors, published up to now, include beams of spans exceeding 10 m, and the majority of connectors used in these experiments fulfill the requirements for ductile connectors of clause 6.1.4.1 of Eurocode 4.
The maximum span of beams tested by Slutter and Driscoll [22] was 4.572 m, by McGarraugh and Baldwin [14][18] was 6.705 m, by Chapman and Balakrishnan
[11] was 5.9 m and by Daniels and Fisher [23] 7.62 m. Even in more recent tests on composite beams with solid slabs [24] and slabs with metal decking [25][26], the span stayed beneath 9.75 m, except for a series of three tests done at the University of Warwick [27] where the shear span was 9.05 m, simulating a beam of length 18 m.
Details of these beams are given in Table 2.2: the material properties of both structural steel (f°,) and of concrete (fe), the span (1), the type of loading: ei-ther pointload(s)
(F)
or uniform distributed load(UDL),
the number of studs per shear span(N)
and the failure mode of the beams. This table also provides calculated values of the ultimate longitudinal interface shear force F,,, the connec-tor ratio(N/N
f),
the ultimate strength M,,, and the reduced ultimate strength according to eq. (2.1) and of the reserve of strength(Mm /M,,,),
by assuming all partial safety factors on material properties equal to 1.0. Thus, the design ultimate values become equal to the theoretical ultimate values.Other notes on Table 2.2 are as follows:
(1) The concrete cylinder strength IC, is the mean reported value for the con-crete at the age of the beam when tested. If asterisked (*) it has been converted from reported results, including cube strengths, assuming
f =
0.85f when fe,,<
35N/mm2 and f=
0.9f when f>
35N/mm2.(2) The ultimate shear strength Q, of the studs, are obtained from corre-sponding Push-Out tests. In the absence of such tests, the values of Q are asterisked (*) and are either supplied by the stud manufacturer or derived from Eurocode 4.
beam, 7max,b, and from the associated Push-Out test(s), 7max.
(4) The measured values Mmaz, are the maximum moments reached during tests. The values of M between brackets are calculated for stiff connectors, according to equation (6.2) of clause 6.2.3.2 of Eurocode 4.
(5) The columns headed B3-B and B4-B are not separate test results. They are revised calculations for beams B3 and B4, respectively, with only one difference: the shear span is assumed to extend from each end support to the adjacent point load, rather than to midspan.
From Table 2.2 it can be seen that for beams with a uniform spacing of studs (beams BlO to ABR2) and nearly the same span, the reserve of strength gets smaller (compare beams B6 and ABR2) when the strength of concrete decreases.
However, a much bigger effect comes from the spacing of the studs near the supports which can significantly increase the reserve of strength. Although beams BlO, B12, Bil and U5 have similar load distributions (multi-point or distributed) and similar strengths of steel and concrete, beam U5 has a certain reserve against stud failure because some studs are placed beyond the support. This gives the beam more strength against shear where it needs it most. The same can be said for beams B6 and ARB2 which have a similar point loads and shear spans, but the strength reserve of Aribert's beam is higher partly because the studs are placed beyond the support. When comparing Figs. 2.2(a) and 2.2(b) it is obvious that in case (b) a bigger redistribution of forces is needed between the connectors in order to transfer the shear. For beam B6, as for beams BlO and Bil, the redistribution is not enough and the studs shear off before the theoretical ultimate value is reached. In case of a distributed load the studs shear off for a higher partial interaction percentage than for a point load, which is clear from beams B6, BlO and Bli.
All three of the beams tested by McGarraugh and Baldwin [14] failed at loads lower than their theoretical design ultimate value