A thesis presented for the of Doctor of Philosophy in Physics at the of Canterbury,
Christchurch, New Zealand.
by
R.J. Kennedy
The differential spectrum produced by strain modulating the
7085~ J4f
5Sdf~>
+ j4f6 7F1
r:>
transition of CaF2:sm 2pll line 26
pll line 18
p45 Fig 3.7} p46 line 17
p62 line 16
p75 line 21
p78 line 3
p90
p96 line 20
pl28 line 7
change change to charge
3+ -
2-Ln F
7
o
2 , superscript 2 is absent co-axial, not co-axeinsert ~ after 300
.•. applied strain and the
photo-replace 'the' by 'and'
attenuation points is -2
1
H , replace 'as' by 'is'.
1T
z
A Eqn (1) and (2) should have terms
l+b2x2 to be consistent with eqns (3) and (4)
... , although higher values were possible
ACKNOWLEDGEMENTS
I wish to thank the following for and guidance over the years:
The academic staff of this Physics Department and of P.E.L., D.S.I.R. Wellington, in particular
Dr J. Campbell (my supervisor) Dr S. Devine
Dr G. Jones Dr
w.
Robinson Dr R. SymeProfessor B. Wybourne
for their helpful discussions and encouragement. The technical staff, in particular Mr I. Foster
Mr D. Greig Mr R. Ritchie Mr T. Rowe Mr R. Tyree.
My fellow research students.
Financial assistance was received from
(1) New Zealand University Grants Committee Scholarship (2) The Shirtcliffe Fellowship
(3) Charles Cook Warwick House Memorial Scholarship (4) Teaching duties in the stage I physics laboratories. Without this assistance the work would not have been possible.
ABSTRACT
CHAPTER ONE 1-1 1-2 1-3 1-4
CHAPTER TWO
2-1 2-2
PREAMBLE Introduction Stresses Static Stress Dynamic Stress
CONTENTS
LANTHANIDE IONS IN CALCIUM FLUORIDE TYPE LATTICES AND CRYSTAL FIELD THEORY
Introduction
The Calcium Fluoride Lattice
2-3 Calcium Fluoride Containing Divalent and Trivalent Lanthanide Ions
CHAPTER 2-4 2-5 2-6 2-7 2-8 THREE 3-1 3-2 3-3 3-4 3-5 3-6 3-7 3-8
Samarium Doped Calcium and Strontium Fluorides Erbium Doped Calcium Fluoride
Praseodymium Doped Calcium and Strontium Fluorides Crystal Field Theory of Lanthanide Ions
Power Law Dependence of the Crystal Field
EQUIPMENT Introduction
The Drive and Gauge Quartz Crystals The Crystal Holder and Support System Growth of Crystals
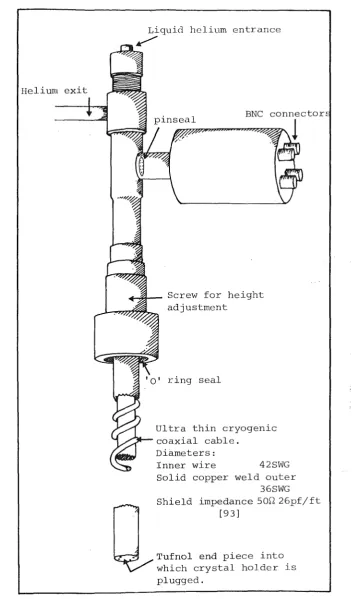
Preparation after Growth The Dewar System
The Drive Crystal Electronics Spectrometer and Detection System
i i i Page
CHAPTER FOUR STRAIN MODULATION
4-1 Introduction 75
4-2 The Phase Sensitive Detector 77
4-3 The Output Signal 80
4-4 Splittings 83
4-5 Electronic Degeneracy 85
4-6 Orientational Degeneracy 87
4-7 Comparison of Absorption and Fluorescence Signals 89
4-8 The Differential Height 91
4-9 The Minimum Detectable Signal 96
4-10 The Variation of the Strain along the Sample Length 99
4-11 Linearity Tests 101
4-12 Comparison of the Shifts of the Samarium Transitions 101
CHAPTER FIVE APPLICATION OF THE TECHNIQUE
PART I 5-l
5-2
5-3
5-4
Introduction
THE ORBIT LATTICE PARAMETERS
Analysis of the Praseodymium Results
Analysis of the Erbium Results
Static Strain Measurements of Samarium
105
106
116
129
5-5 Discussion
PART II
5-6
5-7
5-8
CHAPTER SIX
(A) The Orbit Lattice Parameters 134
(B) The Power Law Dependence of the Crystal Field 138
(C) Ion Displacements 142
OTHER ASPECTS OF STRAIN MODULATION
Polarisation of the No Phonon Transition
Vibronics
Strain Modulation of High Concentration Crystals
CONCLUSION
147
151
160
APPENDICES
A-1
A-2
A-3 B-1
REFERENCES
Line Shapes
The Effect of the Instrument Profile
Summary of Computer Program
Crystal Field Mixing
A-1 A-18 A-31 B-1
LIST OF Figure
2.1 The calcium fluoride lattice
2.2+2.5 Charge compensation in lanthanide doped calcium fluoride crystals
2.2 Compensation by an interstitial fluoride ion - tetragonal symmetry
2.3 Compensation by an interstitial fluoride ion - trigonal
2.4 2.5 2.6 2.7 2.8 2.9 2.10 3.1 symmetry
Compensation by substitutional
o
2- trigonal symmetry2-Compensation by replacement of 7 fluoride ions by 4 0 ions and 3 anion vacancies
2+ Energy level diagram for CaF
2:sm Energy level diagram for SrF
2:
Approximate multiplet positions for CaF 2:Er
3
+
The transitions of CaF 2:
I+
between the I
1%
ground energy 2 I+ • -"level and . Hll/z , F:.7
12
exc1te\ll. states Energy level diagram for :Pr3+
Schematic representation of equipment lay out
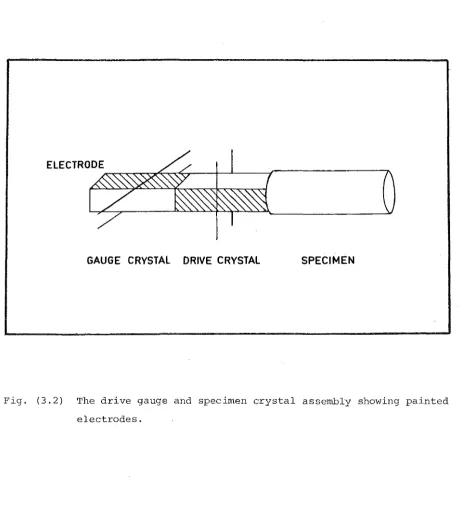
3.2 The drive, gauge and specimen crystal assembly showing painted electrodes
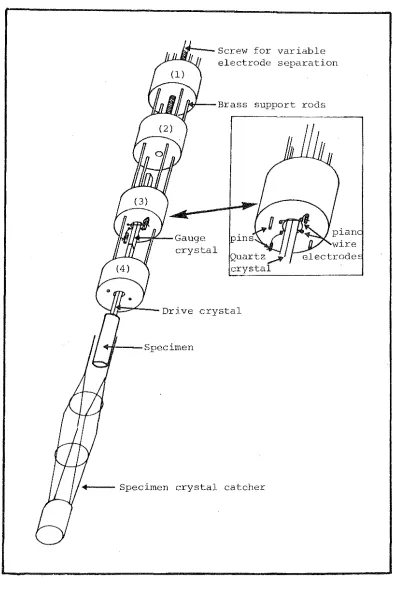
3.3 The crystal holder
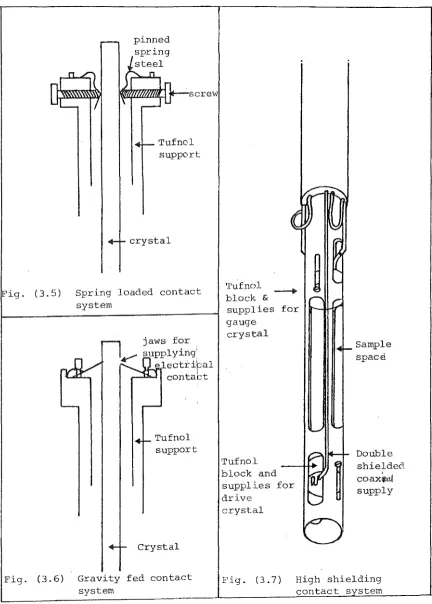
3.4 The crystal holder support system 3.5 Spring loaded contact system 3.6 Gravity fed contact system
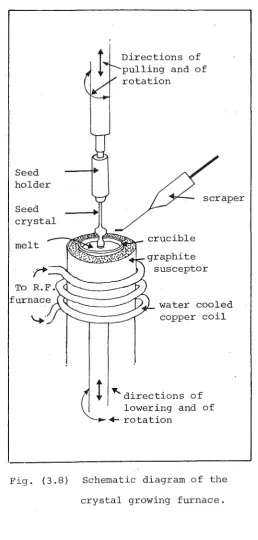
3.7
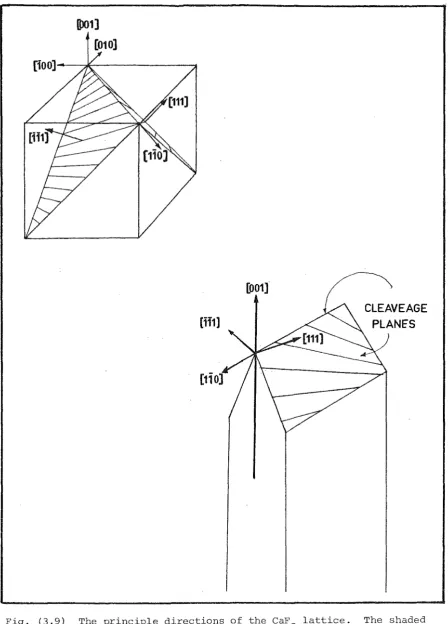
High shielding contact system3.8 Schematic diagram of the crystal growing furnace 3.9 The principle directions of the CaF
2 lattice 3.10 The glass immersion dewar
Figure Page
3.11 The exchange gas dewar
3.12 The phase shifter 67
3.13 A simple circuit used to excite the drive, gauge and sample
assembly 70
3.14 The characteristic curves of a photomultiplier tube for
different incident flux intensities ~ 73
3.15 The F.E.T. amplifier used to obtain better matching between
the photomultiplier and the phase sensitive detector 73
4.1 Schematic diagram of the phase sensitive detector 76
4.2 The phase sensitive detector output A' (x
0) for a spectral line which splits into components i, j, k described by m.f' (x
0).
1. l
82
4.3 Energy level scheme for :Sm 2+ under static stress P as
observed by Kaplyanskii [83] 84
4.4 Comparison of the strain modulation of arbitrary absorption
and fluorescence profiles 88
4.5 The characteristics of a photomultiplier tube. ~denotes
different values of incident flux. 92
4.6 The current produced by the photomultiplier in the tuned load
impedance as a function of spectrometer slitwidth 93
4.7
The variation in height of the 6901A CaF0 2+2:Sm differential
peak for different spectrometer slitwidths 93
4.8 The dependence of spectrometer slit width on photomultiplier
supply voltage to maintain a constant load current of 20~A 94 4.9 Relationship between the differential peak height of the
6901~
CaF2:sm 2
+ transition and photomultiplier supply
voltage for those slit widths necessary to maintain a constant
4.10 and 4.11 Light of beam width ~ passed through the sample
4.12
4.13
4.14 4.15 5.1 and
crystal at different positions x shows the variation of differential height (or strain amplitude) to have a sinusoidal dependence
The linear dependence of differential height with strain amplitude for the 6901]{ f-d CaF
2:sm 2
+ transition The linear dependence of the differential peak height with
0 3+
strain amplitude for the 4836A f-f transition of CaF 2:Er The profile of the 70852{ f-d transition of CaF 2+
2 :Sm The profile of the 69olR f-d transition of CaF 2+
2:sm
5.2 The absorption and fluorescence resulting from
vii
100
100 102 102
. . b h 4 4 . 3+
trans1t1ons etween t e I u
12
+ s% multlp1ets of CaF 2 :Er 118 5.3, 5.4 and 5.5 The strain modulation and absorption spectra of5.6
5.7
5.8
4
transitions between the I1si
. 12 3+
CaF 2:Er
+ 4H 11;
/2
mu1tip1ets of
The absorption of transitions between the 4 4F% mu1 tip1ets of CaF
2:Er 3+ Ilj: +
2
The absorption spectrum of transitions between the
4 4
F% mul tiplets of CaF 2 :Er
3+ I1Jz +
The absorption spectrum of transitions between the 4
Il1z
+ 4F 'l':~. mu1 tip1ets of CaF 2·:Er 3+5.9 and 5.10 The absorption spectra obtained from the l4f6
7Fof~>
2+ SrF
2:sm
> transition of :Sm 2+ and of
5.11 and 5.12 The differential spectra [P//<111>] obtained from
121,122
123
127
127
148
strain modul the vibronic sideband associated with the
I
4f 6 7 F+
0f1
>
+l4f
5
5df~>
transition of :Sm 2+ and SrF
2 :Sm 2+
Figure Page
5.13 and 5.14 The comparison between the numerical differential of
the density of states of CaF
2, SrF2 and the spectra obtained from strain modulating the vibronic sideband
associated with the l4f6 7
F
0
f~>
+l4f
55df~>
no phonon2+ 2+
transition of CaF
2:sm , SrF2:Sm 154,155
5.15 The polarisation of the strain modulated vibronic
side-band spectra associated with the l4f6 7
F
0
f~>
+ l4f5Sdf:> 2+no phonon transition of CaF 2:sm
5.16 and 5.17 The absorption and strain modulation of the
14f6 7 F r+
I
ss r- . . . 2+ 10 1> + 4f d 4
>
trans1t1on of a CaF2:sm crysta whose concentration is sufficient to cause 100% absorptionat the line peak. The high concentration produces extra
b . 1 . f 2
+ '
.
h b .a sorpt1ons resu t1ng rom Sm 1ons w1th other t an cu 1c
site symmetry
Al The light intensity fluctuations resulting from the strain
modulation of a spectral line
A2-+A5 The agreement obtained for the evaluation of the
differential height and width using the methods of
158
161
A-2
Arndt [118] and that of the present investigation A-5+A-7
A6+All The resulting differential lineshapes,lineheights and
line-widths·of a profile.which·splits.under strain modulation
into two identical Lorentzian components of unit height
and half width and whose shifts are in the following ratios
±0.25 ±0.5 ±0. 75 A-lO+A-17
Al2 The instrument profiles at different slit widths of the
Czerny Turner spectrometer used in the present
investigations A-19
Figure
Al4
Al5
The triangular instrument profile
The triangular tophat instrument profile
Al6+Al8 The effect of square, triangular and tophat triangular
instrument profiles (respectively) on the line height and
linewidth of the differential produced by modulating a unit
ix
Page
A-21
A-23
Lorentzian lineshape A-25+A-27
Al9+A21 The normalised differential line produced by
modulating both the Lorentzian lineshape and its half
Photograph Page
Frontispiece The differential spectrum produced by strain
3-1
3-2
modulating the
7085~ l4f
55df~>
+ 14£6 2+of CaF 2:sm
Actual equipment out
r
+>4 transition
The holder, gauge and drive quartz crystals with a
specimen
3-3 Selection of specimens grown using the Czochralski
technique (Xl.l25 actual size)
3-4 Sample failure - the cleavag~ which often occurred from over-straining the specimen
32
40
56
Table
2.1
LIST OF
The reduction of the spherical representations (integer J)
into the representations of the cubic point group
2.2 The reduction of the spherical representations (half integer
J)
into the representations of the cubic point group2.3 The reduction of the double group representations of the
cubic point group into the representations of the tetragonal
and trigonal groups
2.4 The energy level positions of praseodymium substituted in
CaF
2 and charge compensated by a tetragonal F ion 2.5 The strains produced by a stress directed along the shown
high symmetry directions of a cubic crystal
2.6 The combination of strains which transform as the bilinear
basis vectors for the irreducible representations of the
c
4vxi
Page
14
18
18
20
27
and oh point groups 27
4.1 Parameters relating to the Gaussian and Lorentzian line
shapes and their derivatives
4.2 The reduction of the representations of the oh point group
into the irreducible representations of the point groups
obtained by applying a pressure along the <100>, <110>, <111>
symmetry directions, viz. D
4h, D2h, D3d
4.3 Possible centers which can be incorporated in the cubic
MeF
2 lattice without disturbing the crystal symmetry 4.4 The number of split components produced by uniaxial
compression of a center in a cubic lattice
82
84
86
Table Page
4.5
The shifts measured by Runciman [26], Kaplyanskii [27] and the present work of the6901~
and 7085A f-d transitions ofCaF 2 :Sm
2+
5.1 The shifts of the
I
3H4> +
I
3P 1
>,1
3 H
4
>
+i
3P
0
>,
transitions5.2
5.3
The shifts of 3+ CaF
2:Pr and
the
I
3H 4>, 3+ SrF2 :Pr
3
I
P1> levels of
The elastic compliances of CaF
2, SrF2 and BaF2
5.4 Parameters associated with the absorption and strain
modulated spectra resulting from transitions between the
4 2 3+
I 1
%
+ H11z multiplets of CaF 2:.Er5.5
The orbit lattice parameters of praseodymium, erbium and samarium5.6 The vibronics of 5.7 The vibronics of
2+ CaF
2 :Sm 2+ :Sm
5.8
The shifts of the differential vibronic peaks with crystal orientation for CaFxiii
ABSTRACT
The technique of resonant strain modulation has been applied for the first time to the modulation of optical transitions occurring between
levels of the 4f shell of lanthanide ions. This allows changes in signal strength of typically 0.01% of the maximum spectral line height, which
-2 -1 2
results from spectral line shifts smaller than 10 em /(kg/mm), to be easily detected. After a full description the method is used to obtain the orbit lattice parameters
8B~/88
of Pr3+
in CaF2 and SrF2 hosts. On the assumption of a local cubic lattice these are found to be
3 -1 3 -1
( -4 . 5 ± l. 5) x l 0 em and (- 5 . 4 ± l. O) x l 0 em
respectively. The shifts of some optical transitions of CaF 2:Er
3
+
are also presented. Application of the method to shifts of the vibronicside-d 2+ . . . . .
bans of MeF
2:sm , polarlsatlon studles of the no phonon f-d transltlons
2+ 3+ 2+ .
CHAPTER ONE
PREAMBLE
1-1 INTRODUCTION
When a lanthanide ion is substituted in a crystal lattice the spherical symmetry of the .free ion is by the well defined
symmetry of the crystalline environment. As a result the free ion energy levels i t into sublevels, the number and symmetry of which is specified by group theory [1]. If the charge of the free ion and that of the lattice ion i t replaces are not the same, charge compensation is necessary for the lattice to remain electrically neutral. This is usually achieved by the presence of additional ions in the lattice. The presence of these charge compensating ions can cause the local symmetry surrounding the impurity ion to differ from that of the host
strength and symmetry of the surrounding
modifying the field, and also further changing the number of, and separation between, the energy levels.
Knowledge of the actual site symmetry is therefore needed to determine the splitting pattern of the levels of the ion in a crystal.
The Hamiltonian for a lanthanide ion placed in a be written as [2]
field may
HF being the free ion Hamiltonian whose eigenvalues and eigenvectors are assumed to be known, and where V is the field potential. For lanthanide ions, V is small compared to and is usually treated by perturbation theory. Since the free unperturbed ion has
2
v
where the
A~
<rk> are called the crystal field parameters which can be determined experimentally and are interpreted using models of the crystal field, e.g. point charge [3), superposition [4].The application of perturbations to the host lattice in the form of external electric [5) or magnetic fields [6] or as strains [7] can provide information on the energy levels of a lanthanide impurity such as the degeneracies of the energy levels, the variation of the crystal field parameters A~ with ligand distance, and the symmetry surrounding the impurity ion.
It is the effect of strain which is to form the basis of the following studies.
1-2 STRESSES
The types of stress which may be applied to the crystalline lattice fall into the following classes.
A. Hydrostatic Stress [8].
The force, usually compressive, is applied equally to all sides of the sample by means of a fluid or gas which is transparent in the
spectral region of interest. Hydrostatic stress preserves the crystal symmetry; therefore the electronic and orientational degeneracies (see section (4-5)) remain unchanged allowing the variation of the crystal field parameters with ligand distance, only, to be found. As a result of the stress being applied equally to all sides of the sample the
B. Uniaxial Stress [9].
This form of stress is most commonly used as i t is the easiest to apply - either as an extension [14] or as a compression [15] - to
produce a change in the crystal symmetry. The bulk strains produced by the stress are easily found ailowing the experimental observations to be interpreted in terms of ion displacement [16].
c.
Shea~ Torsional and Bending Stresses [11-13].These usually form complex shear strains. As their effect on either side of the sample to which they are applied is often equal and opposite, they give zero nett effect in transmission experiments, and are therefore most suited to reflectivity measurements.
This thesis has been restricted to uniaxial stresses.
1-3 STATIC STRESS
To apply a static stress to a crystal i t is usually mounted between the jaws of a 'vice' which is then loaded by a weighting system
[28-32]. The spectrum of the specimen is then observed in the usual way, either by electronic d.c. detection or by photographic methods, both of which suffer from low noise rejection. Both methods make i t difficult to detect~shifts or splittin9s smaller than a line width. ·If a shear occurs
in the rod connecting the weighting platform to the vice, the stress produced by the weights will differ from that produced on the sample [15] . Similarly inhomogeneities of the sample can lead to different strains being produced round the impurity ion than those predicted by the bulk stress [17].
4
1-4 DYNAMIC STRESS [10]
Applying an alternating or a.c. strain to a crystal causes the spectral lines corresponding to transitions between the energy levels of the dopant ion to split and shift at the frequency of the applied strain [21]. Thus a.c. detection techniques can be used which allow high noise rejection making the method very sensitive and capable of detecting shifts much smaller than a line width. In particular phase sensitive detection may be used having the advantage that detection at the frequency of the modulating strain produces the differential of the spectral line. This gives greater spectral detail than is contained in the normal (zeroth derivative) spectra [19].
In'nonresonant dynamic strain experiments the strain amplitude is usually limited by the strength of the bond joining the sample crystal to the transducer. In addition interference can be produced between the strain wave and its reflections from the sample faces. This prohibits an acc~~ate knowledge of the strain at any particular point in the crystal. The purity of the strain also poses a problem, particularly if i t is produced by a piezoelectric ceramic. These are often less than 80% aligned [20] and may cause admixtures of shear and torsion to the uniaxial strain.
lowering the likelihood of failure [10] [33] . A disadvantage of the resonant technique when applied to the study of the shifting of energy levels is the difficulty in obtaining the absolute shift. This is over-come in the present studies by double doping the sample with an impurity, the shift of whose energy levels with strain are already known.
As a method £or producing a resonant strain in a crystal had recently been developed by Robinson [22] and had been successfully
applied to study the shift of E.P.R. spectral lines with strain [21], the object of this thesis was to develop the technique to study the shift of optical spectral lines originating from transitions within the 4f shell of lanthanide ions substituted into alkaline metal lattices. In chapter two, details of the general properties of the lanthanide ions in the MeF
2 lattices (Me
=
Ca, Sr) are discussed. The experimental details of6
CHAPTER TWO
LANTHANIDE IONS IN CALCIUM
AND CRYSTAL FIELD THEORY
2-1 INTRODUCTION
The electronic structure of neutral lanthanide atoms consists of a common xenon core, two or three outer electrons which enter the or 6s25d shells and a 4fN shell which is progressively filled through the series, being empty for lanthanum (N O) and completely filled for lutetium (N
=
14) . There is imperfect mutual shielding amongst theelectrons belonging to the 4f shell and as a result they are drawn within 2 6
the Ss Sp closed shells of the xenon core [34]. This is known as the lanthanide contraction. I t causes the chemical and physical properties of the different lanthanides to be similar and is responsible for the decrease in size of the lanthanide with increasing atomic [35} number. The
shielding also causes the 4f electrons to have a rather weak electrostatic interaction with any external environment. Thus the spectra resulting from f-f transitions of lanthanides substituted into crystal lattices show many of the features of the free ion spectra.
Ionization of the lanthanides proceeds by the removal of the 6s and 5d electrons until in-"th~:rnrrst--cmnmonly occurring trivalent state only the xenon core and the shielded 4fN shell remain. Further ionization proceeds by the removal of the 4f electrons [36]. Dieke [35] reports that
transitions to and within the excited configurations (4fN-l5d, 4fN-l6s, 4fN-l6p etc. up to 6th and higher) of the lanthanides may be produced by electric discharge in the appropriate lanthanide vapor. In particular, he shows the approximate extent of the two lowest configurations 4fN and
N-1
parity forbidden transitions within the 4f11 configuration which occur because of mixing of hlgher excited opposite parity configurations into the 4fN wavefunctions. This is observed experimentally by the spectra being sharp but weak in intensity.
In contrast the proximity of the ground (4fN) and first excited (4fN-l5d) states of the divalent lanthanide free ions makes interconfig-urational allowed transitions , appearing as strong broad transitions in the optical
2-2 FLUORIDE LATTICE
Calcium fluoride was chosen as the host lattice for the
studies as its ef.fect on the lanthanide ions has already been extensive studied in this department. I t is relatively hard (hardness 4 Mohrs scale) [49]; has little damping to strain [50]; i t is nonhygroscopic,
8
allowing ease of handling; the ionic radius of the calcium and lanthanide ions are similar; and most importantly because long orientated doped samples of necessary length (6.9 em) for resonance at 80 kHz can be
grown.
5
(2.1) shows the lattice which is characterised by the Oh space group. The fluorine ions form a cubic array with every other body center
occupied by a calcium ion. Cleavage planes lie along the <111>
-1
region, as the normal lattice modes occur below 1000 em [37] whilst ionization of the calcium and fluorine ions occurs in the ultraviolet region.
2-3 CALCIUM FLUORIDE CONTAINING DIVALENT AND TRIVALENT LANTHANIDE IONS
As the ionic radii of the calcium ion (0.99R) and the trivalent
0 3+ 0 850 3+) ' '
lanthanide ions (l.061A La ~ . A Lu are Slmllar, the lanthanide ions enter the calcium fluoride lattice substitutionally with little disruption of the lattice for concentrations less than about 5%. Whilst samarium, europium and ytterbium may enter in either the divalent or trivalent ionization states [51] [63] [65] the other lanthanide ions are energetically favoured to enter in the trivalent state during growth [38]. However, all the lanthanides may be stabilized in calcium fluoride after growth in the divalent state by y-ray irradiation or by chemically
heating the crystal in the presence of calcium vapor [39] [52] . The time spent in the divalent state is dependent on the crystal temperature as all divalent ions can be made to reconvert to the trivalent state although for some i t is necessary for the crys~als to be heated to just below their melting temperature. The divalent state is easily recognised as strong interconfigurational f-d transitions which occur at room
temperature in the visible region of the spectrum make the crystals deeply coloured.
Unlike the substitution of the lanthanide ions in calcium fluoride in the divalent ionization state,which preserves the charge neutrality of the lattice and for which the lanthanide ion has cubic symmetry,
10
o--~~·
I
).r--~
Fig. (2.3) Compensation by an interstitial fluoride ion - trigonal symmetry
Fig. (2.5) Compensation by replacement of 7 fluoride
2-ions by 4 0 ions and 3 anion vacancies
(2.2) Compensation by an interstitial fluoride ion -tetragonal symmetry
I ;
.... l ....
Jr.-
-.P..-;
,.
Fig.
(2.4)
Compensation by2-substitutional 0 - trigonal symmetry
I I i I
.h--
-·~~
_J__
/ / ,.
Fig. (2.2)~Fig. (2.5) Charge compensation in lanthanide doped calcium fluoride crystals
0
F@
vacancy2+ • Ca
For crystals of low concentration grown under reducing conditions tetragonal (c
4v) [54] [55] (fig. (2.2)) or trigonal (C 3v ) symmetry (fig. (2.3)) [56] [57] may be produced by a fluorine ion occupying an inter-stitial position in the nearest neighbour or next nearest neighbour cube along the <100> and <111> directions respectively. For lanthanide ions, the tetragonal site in calcium fluoride can be converted to cubic by elevating the crystals to 800°C as the fluorine ion is not tightly bound to the lanthanide ion and can diffuse to a position several lattice
spacings away [58] [166] . Lanthanide ions in the second half of the series have been found in sites of cubic symmetry in calcium fluoride more
frequently than ions of the first half [167]. This is associated with their smaller ionic radii and the resulting local distortions of the calcium fluoride lattice [66] [54]. Reddy et al. [59] have shown that trigonal site symmetry may also result when the crystals are grown in an atmosphere containing oxygen by the replacement of a nearest neighbour F
2- 2+
ion with an 0 ion (fig. (2.4)) or by the replacement of a Ca and eight
-
2-F ions by one F ,.four 0 ions and three anion vacancies (fig. (2.5)) 3+ - 1- 3+ -
2-to give the Ln F
7
o
2 and Ln Fo
4 structures respectively.When the growth atmosphere contains water vapor. dissociation can occur producing OH ions. These are thought to enter the crystal lattice and produce trigonal symmetry by the replacement of the nearest neighbour F ions [40] [60]. However, Reddy et al. have shown that better
3+ - 2-experimental agreement results if this model is replaced by RE H o
4 similar to the oxygen center above [59] .
Evidence also exists for lower symmetry sites surrounding the lanthanide ions for example Monoclinic and Rhombic; cha~e compensation mechanisms necessary to produce these symmetries have been proposed [41] [42].
The effect of substituting the lanthanide ion into the CaF
12
4f6
4£6
Free
- -1
r4
14482cm- - - r
-11 14360cm
6901~
7
F1
'
rt
250cm-1
7Fo 1 Ocm -1
ion oh site
symmetry
2+ (2. 6) Energy level diagram for CaF
levels into sublevels whose number is dependent on the surrounding symmetry (see sections later in this chapter). Although the splitting pattern produced is usually only a few hundred wave numbers wide, so that
the essential structure of the free ion configuration tends to be preserved, any given crystal will usually contain several of the above forms of charge compensation each of which produces its separate crystal field splitting pattern. These are usually intermixed making an accurate interpretation of .the resulting spectra difficult [53] [61].
In addition, vibronic transitions involving the lattice
vibrations of the host can occur and these appear as sidebands of the no-phonon pure electronic transition. They are usually of lower intensity. Peaks in the sidebands correspond to peaks in the phonon density of states and are usually more obvious for interconfigurational f-d rather than f-f transitions as the former involves a less shielded d electron.
Raising the concentration of the lanthanide ion above 1% leads to the possibility of clustering. For example, two lanthanide ions can replace three divalent calcium ions thus preserving the charge neutrality of the lattice [62] . As this greatly increases the complexity of the lanthanide site symmetry and thus the crystal field energy level
splitting pattern the present studies were made only on low concentration crystals.
2-4 SAMARIUM DOPED CALCIUM AND STRONTIUM FLUORIDES
Fig. (2.6) shows the energy level assignments for calcium fluoride containing samarium, based on the static strain measurements of
Kaplyanskii [43] and Runciman [26], by the Zeeman measurements of
Zakharchenya [44] [45], and by the temperature and lifetime measurements of Wood et al. [46] [64].
Divalent samarium has six electrons in the 4'f shell giving, by 7
14
Spherical Irreducible Representations
Do
Table ( 2 .l)
Irreducible of the Cubic
r1
I'q
r3
+
r
s
fz
+
ftt
r1
+
r3
Representations (Oh) Point Group
+
fs+
f~t+
r
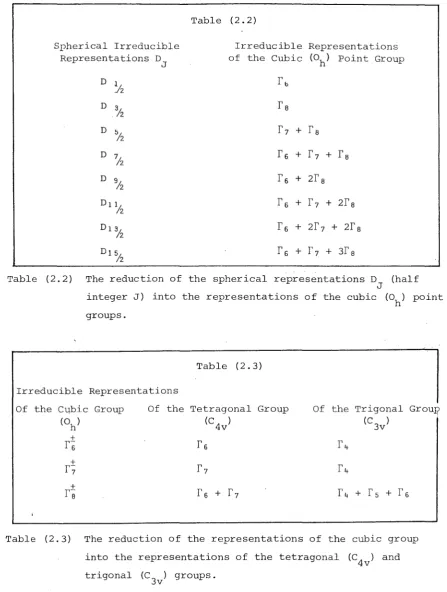
sTable (2.1) The reduction of the spherical representations DJ (integer J) into the representations of the cubic (Oh) point group.
4f5 Sd
---.---
-·l
6 7
4f Fo free ion
-
-6ss4R
I I I
I
---
.
I
I
II
I:
I
I
I I Il6s73R 6967X
I I II
I I I II
Ir
s -1r:
15184cmr;
-1l5062cm
ri
-·1
1 l4612cm
263cm -1
4
ri
Ocm -1 oh sitesymmetry
2+ Fig. (2.7) Energy level diagram for SrF
level of the Sd configuration lies lower than the first excited state of the 4f6 shell (5D
0) two intense electric dipole parity allowed f-d
-1 1
transitions occur at 14110 em and 14482 em- as shown in fig. (2.6). The latter has an associated broad phonon sideband (fig.
(5-9)).
· · f h 7 h 7
a·
·
1Trans1t1ons rom t e F
1 to t e F0 energy levels are ra 1at1on ess [ 4 7] .
7 5
No transitions are observed from the FO level to the DO level, as a consequence of the samarium ion being situated in a cubic field, the inversion symmetry of which allows only magnetic or order multi-pole transitions to occur. These would be very weak. The group
theoretic labelling follows from table (2.1) for the ground states
7
FJ whilst that of the 4f5Sd configuration follows by combining the lower5 6
level of the 4f shell H
512 and the lowest level of the Sd state [48] . In contrast when samarium is substituted into the strontium fluoride lattice the first excited state of the configuration, viz. 5 D
0, is found to lie lower than tl:e bottom of the 4f55d configuration • (2.7)) [43]. As both the 7F
0 and 5
D
0 levels belong to the t
6
configuration,
transitions between them are forbidden, not only by parity (f + f) but also because of the high symmetry preserving the J 0 + 0 selection rule
[36] . Thus the absorpt1on spectra of SrF. 2+ 2+ 2:sm , like that of CaF2:sm 6 7
results from transitions between the f ( F ) and J
consisting, at 4.2°K, of one strong line at 65B4R
f55d configurations
. . 2+
wh1ch, l1ke CaF 2:sm has a strong associated vibronic sideband. However, in contrast to
2+
:Sm , the fluorescence of SrF 2+
2;Sm is dominated by a strong magnetic dipole transition from the D5 7
0 to F1 level together with several other weaker transitions to higher levels of the
multi-Fluorescence is also observed from the configuration to the 7
F (f6) multiplet [43].
16
4F
4
%
FJz
7/z
2
H1%
4
s%
4
I1%
Free ion
I
-22768cm=~
H -22381cmG ~20713cm -1
F
E
z
-19309cm
-18562cm
-1
Ocm
-1
-1
Fig. (2.8) Approximate multiplet positions 3+
Free ion
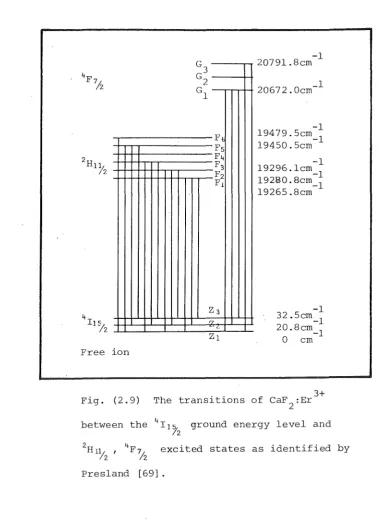
Fig. (2.9)
G3 G2 Gl
F< Fs F4 F3 F2 F1
Z3
C7
L
-1 20791.8crn 2 0672.0crn -1
-1 l9479.5crn_
1 l9450.5crn
-1 l9296.lcrn
-1 l9280.8crn_
1 l9265.8crn
-1 32.5crn_
1 20.8crn_
1 0 ern
. . 3+
The trans1t1ons of CaF 2:Er 4
between the I1
t
2 ground energy level and 2H
1
% ,
4F7/ [image:33.597.101.481.115.636.2]18
Spherical Irreducible Representations DJ
D
Yz
D % D % D7/z
D%
D11/ 2 D1% D1%Table
( 2. 2)
Irreducible of the Cubic
rb
fs
r7
+
r6
+
r6
+
r6
+
r6
+
r6
+
Representations (Oh) Point Group
fs
r7
+
fs
2f
8r7
+
2fs
2f7
+
2fs
r7
+
3fs
Table
(2.2)
The reduction of the spherical representations D (half Jinteger J) into the representations of the cubic (Oh) point groups.
Table (2. 3) Irreducible Representations
Of the Cubic Group Of the Tetragonal Group Of the Trigonal Grou17
(Oh) (C4v ) (C3)
+
r-s
r6
L;+
f7
r7
ft;+
f8
r6
+r7
ft; + fs +r6
Table
(2.3)
The reduction of the representations of the cubic group into the representations of the tetragonal (c4v) and trigonal (c
[image:34.595.65.513.93.686.2]2-5 ERBIUM DOPED CALCIUM FLUORIDE
Erbium has eleven electrons in its unfilled 4f shell giving a free ion ground state labelled by 4I
1512. When substituted into the calcium fluoride lattice the spherical symmetry is reduced to cubic or to a lower subgroup depending on the direction and proximity of the charge
compensating ions as mentioned above.
Neglecting charge compensation, the resultant splitting of the free ion energy levels by the lattice is given by the decomposition of the spherical representations, DJ, into the irreducible representations o£ the cubic Oh point group (see table (2.2)). Table (2.3) shows the added effect of including tetragonal and trigonal charge compensation about the erbium ion.
Thus the crystal field with tetragonal symmetry removes all the electronic degeneracy of the erbium levels excepting that of Kramers. The latter can only be removed by a magnetic field [68] .
Fig. (2.8) and fig. (2.9) show the energy level scheme identified by Presland [69] for tetragonal fluorine charge compensation together with his observed transitions.
Transitions associated with trigonal charge compensation have also been observed by Leung [70] but unfortunately he has not identified the irreducible representations associated with the levels.
2-6 PRASEODYMIUM DOPED CALCIUM AND STRONTIUM FLUORIDES
Praseodymium when substituted into the calcium fluoride lattice stabilizes in the trivalent ionization state having two electrons in the outer 4f shell and thus i t has a 3H
4 ground state by Hunds Rule. Whilst there exist many exclte . d 4 f electronlc energy levels only the . 3 P -~ 3
20
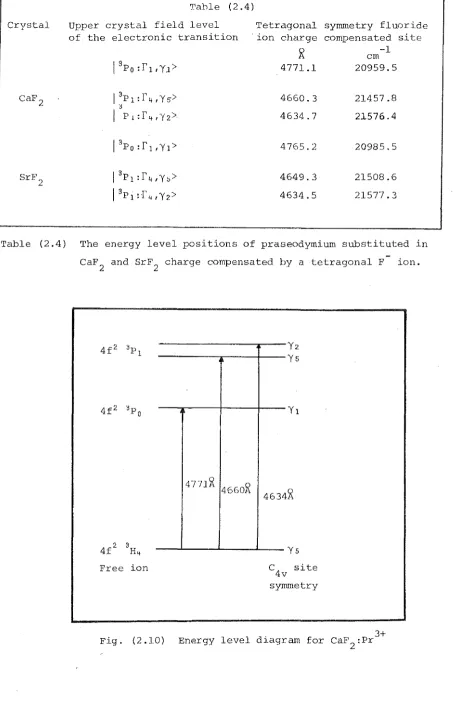
Table (2 .4)
Crystal Upper field level Tetragonal symmetry fluoride of the electronic transition ·ion charge compensated site
R
em -1I
3Po:fl,yl> 4 771.1 20959.51: r If I Y 5> 4660.3 21457.8
::l
I
P1:r4,yz> 4634.7 21.576.4I
3P o : r 1 I y 1 > 4765.2 20985.5SrF
2 1 :fq,yt>> 4649.3 21508.6
I
3P1 :r 4 ,y2> 4634.5 21577.3
Table (2.4) The energy level positions of praseodymium substituted in CaF
2 and charge compensated by a tetragonal F ion.
4771X
466oR
4634
3
H4 Ys
Free ion
c
4v site symmetry
[image:36.596.69.524.80.786.2]only the second degree crystal field parameters of crystal field theory (see section 2.7).
3+ The energy level scheme for CaF
2:Pr with tetragonal charge
compensation by an interstitial fluorine ion is shown in fig. (2.10) where the energy level assignment follows from Jacobs [71]. In addition to the absorptions shown in fig. (2.10) many other sharp lines of lower intensity appear in the liquid air absorption spectra in the same energy region. These arise from site symmetries other than tetragonal surrounding the praseodymium ion. Their intensity can be considerably reduced by heating the crystals to 800°C in a vacuum, followed by rapid quenching to room temperature. This was also found to cause an immediate increase in the 3 H 4 -3 P 0 3 P
1
absorpti~n
presumably by causing more sites to becomeconverted to tetragonal. The increase in absorption was also noted to continue for a period of between three and four days after quenching [58].
Vibronic structure was not observed associated with any of the
3 3 3
spectra originating from the H
4 - P0, P1 transitions. It is expected to be weak as all levels originate within the 4f2 configuration.
When substituted into the strontium fluoride lattice the energy scheme of Pr3+ is similar to that of CaF
2:Pr 3
+ differing only in the energy separation of the levels. Table (2.4) lists the wavelength values obtained by Jacobs [151] for the 3P
0 and 3
P
1 multiplets for tetragonal fluoride charge compensation.
Att~mpts were also made to replace the tetragonal F charge 3+
compensation of CaF
2:Pr by H ions, using the technique as outlined by Hall [142]. Unfortunately, although some H ions did diffuse into the samples, presumably into the surface layers, the concentration was
•
22
2-7 CRYSTAL FIELD THEORY OF LANTHANIDE IONS
The simplest approximation to the formulation of the crystal field potential, V(r8¢), produced by some lattice of ligands is to replace the charge clouds of the ligands by point charges - the point charge model
[3]. The potential at some point (r8¢) is given by
V(r8¢) 2-7(1)
. h h h .th . . h . .
where q. 1s t e c arge on t e J l1gand at d1stance R. from t e or1g1n.
J J
When a free ion of charge q. is substituted in the lattice its l
spherical symmetry is reduced to the point symmetry of the lattice and the free ion multiplets are split by the crystalline field potential. The perturbing crystal field potential energy is
E I: q.V. i l l
q.q.
I: l J 2-7(2)
IR.-r.l
ij J l
Whilst the calculation of the crystalline potential can be carried out using cartesian coordinates for the space pertaining to the
potential, i t is much more convenient to reexpress the potential as a sum of spherical harmonics, as a general formula for its evaluation results, making calculations of the free ion energy changes easier in this form.
and
Since
1
R-r
co rn 0
"
-1 P (cos w) '-' n+ n
n=O R
0
P (cos w)
n
n
4'/T .\fil-m m (2n+l) l:(-lJ Yn <8 · ¢ · )Yn <8¢)
m=-n J J
2-7(4)
where
w
is the angle between the two vectors (r.8.¢.) and (r8¢) the J J Jpotential can be written as
n
v
l: l: r n yn m Ymn (8 1 ¢) 2-7 (5)
n m=-n
where
m 'l: 4'/T q. J m -m
yn 2n+l (n+l) (-1) y (8.,¢.)
j R. n J J
J
2-7 (6)
To calculate energy changes caused by the crystalline potential acting on the wavefunctions of electrons, recourse is normally made to the method of
'Operator Equivalents', Om , in which x, y, z are replaced by J , J , J
n x y z
[123,124], or to the method of tensor operators [36]. In the former technique, the crystal field Hamiltonian is re-expressed as
ftc
2-7 (7)nm
where the
A~ <rn>, the crystal field parameters, related to the
y~
above, are usually determined by experiment, and the 8 are multiplyingn
factors. In the latter case, use is made of the relationship
k
c
q j{. c{4Tf
j l l i i
k
c
q2-7(8)
2-7 (9)
24
<1/Jickll/J> 2-7(10)
1 q 2
which have been evaluated by Racah [125]. For f electrons i t can be shown 2S+l
[36] that for a given J multiplet, · LJ,
N
I
N<f aSLJJ IV f a 1
SL1
J 1
J 1>
z z
[_:
z:
Jl J IJl
z(-l)S+L+J1+k
([JJ
1
])~
2-7 (ll)
where the doubly reduced matrix elements <II II> have been tabulated by Nielson and Koster [122] ,
[JJ I] (2J+l) (2J I +l)
and
2-7 (12)
From the symmetries imposed on the 3J symbols we require that, for f electrons, k must be less than 6 and even, that (J k J 1
) satisfy the
triangular selection rules [169] and that J -J 1
=
q.z z
k The B are
q
treated as parameters to be determined from experiment and interpreted using some crystal field model. Since the potential, V, must be an invariant of the lattice, i t must transform as the totally symmetric representation of the point group describing the impurity ions site symmetry in the lattice. The number of non-zero B k is determined by
q
2-7 (13)
Crystal fields for which q 0 produces splitting of the levels of. a given IJ I whilst fields with q ~ 0 cause mixing of states for which
z
- J '
=
q and results in J and J no longer being good quantum numbers.z
z
To determine the change in positions of the energy levels and the resultant wavefunctions the energy matrix must be set up and diagonalized for the J multiplets of a particular ion. Since the crystal field causes mixing of
the free ion wavefunctions the wavefunction describing a particular level of an ion in a crystal has the formE a. IJ(i)> where the a. are obtained
. l
z
ll
from the above diagonal·ization. This has been carried out by Lea Leask and Wolf for the cubic field case [126}.
Since the potential is dependent on the interionic
distances, if a perturbation (e.g. a pressure) is applied to the lattice causing a shift in the position R. of the ligands a change in crystal
J
field potential wiil result. This will, in turn, affect the position of the energy levels of the substituted impurity.
For the case of an applied pressure the effect is to cause
+ R. + I:::.R.
J J
where I:::.R. is the change in ligand position. The resultant crystal field J
potential V can be expanded as a Taylor series of the unperturbed crystal field V, viz.
v
d <J2
v
V + 2: ....:i__ I:::.R . + l: I:::.R 6R + l
. l . •
dR.
<JR .
i j ...lJ l J
where only terms linear in 6R. need be retained for small strains l
-3 (L'>R./R. < 10 ) .
l l ~
k Since V = 2: B
q C!Bk kq
26
k
C the change in crystal field q
2:
~
L'>R becomes. (JR . . i
_g_ k
2: " L'>R. C
. oR. 1 q and the resultant splitting or shift of
l l lkq l
the impurity ions energy levels is obtained by the calculation of matrices of ·the form
k C!B
q k
2: - -
<'''ic.
i'''>L'>R. kqi C!R. ~ q ~ ll
C!Bk
(2-7 (15)
where the coefficients ~ are called the orbit lattice parameters.
(JR.
l
Related parameters have been defined by Calvo [127] . Calculation of these matrix elements is carried out using equation 2-7(11).
The displacements L'>R. are usually redefined in terms of the basis l
for bilinear forms of the particular point group which surrounds the impurity ion [128,129]. This aids in the visualization of the distortion and, in particular, allows.the methods of group theory to be used to calculate those displacements or normal modes of the immediate ligand field which can couple to the wavefunctions of the impurity ion. For the matrix elements to be nonzero the normal modes of the lattice which may interact with the lanthanide ion must be contained in the direct
product of the irreducible representations describing \j! , .viz.
rr\j!
xr\j!
J [130J [l40J.To calculate the strains produced about the impurity ion by a
pressure directed along the various symmetry directions of a crystal i t is necessary in a first approximation to assume that the local strain equals the bulk value, so that the strain
s ..
is related to the externall ]
pressure okQ, by
E ..
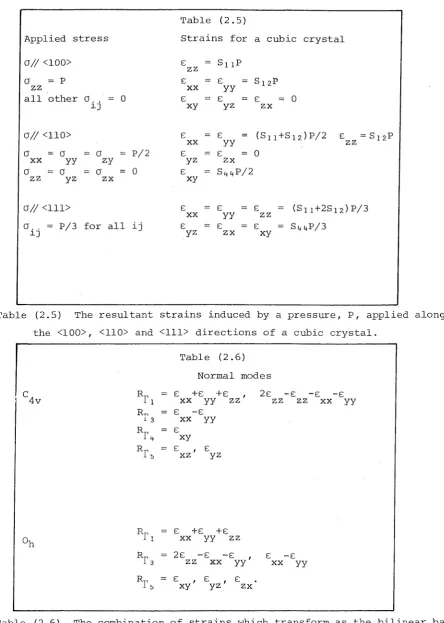
Table (2.5)
Applied stress Strains for a cubic crystal
0// <100> E S11P
zz
0 = p E E
s
12pzz XX yy
all other 0 .. 0 E E E 0
lJ xy yz zx
0// <110> E E (Sll+Slz)P/2 E = S 1 zP
XX yy zz
0 0 0 P/2 E E 0
XX yy zy yz zx
0 0 0 0 E S44P/2
zz yz zx xy
0// <111> E E E (Sll+2Slz)P/3
XX yy zz
0 .. = P/3 for all ij E E E SttttP/3
lJ yz zx xy
Table (2.5) The resultant strains induced by a pressure, P, applied along the <100>, <110> and <lll> directions of a cubic crystal.
Table (2.6) Normal modes
c4v Rr1 E xx +E yy +E zz 2E zz -E zz -E: XX -E yy Rn E: -E:
1 3 XX yy
Rr4 E xy Rr!> E xz
'
E yzRr1 E +E +E
oh XX yy zz
R 2E -E -E
yy' E -E
r3 zz XX XX yy
Rr!> E xy
'
E: yz' E zxTable (2.6) The combination of strains which transform as the bilinear basis vectors for the irreducible representations of the c
[image:43.595.83.528.67.691.2]28
the sijk~ being the elastic constants for the bulk crystal. Table (2.5) shows the strains induced by 0k~ for various symmetry directions of a cubic crystal. The normal modes
~.
transforming as ther.
irreduciblel l
representations are presented in table (2.6) for the c
4v' and oh point groups.
When a strain is applied to a crystal lattice the change in crystal field is usually a fraction of the static field. Providing the strain is sufficiently small the crystal field and wavefunctions
describing the energy levels in the absence of the strain remain a good approximation.
Consider a transition between two levels where
n
The change in energy of a transition occurring between levels ll> ~ 12> by the application of a strain is
L: <a J (m)
I
L: m m z ik1q1- L:<S J(n)
I
L: n z 'kn J q
"\ k I (l)
aB 1
q ClR(l)
r.
l
ClBk(2)
--=q...._,..._
ck (2) R (2)IS
J (n) > ClR ( 2) q . f j n zr.
J
where the coefficients and operators
kl ClBk(2)
ClB I
k I (l) ( l) ck(2)
L: q c I
Rr. ;
L: q(l ( 2)
i~q
1()Ri~)
ql jkq
Rr.
ql J
(2)
Rr
are restricted by the requirements of the direct product and 3J symbols to be nonvanishing for levels ll> and 12> respectively. If the changes in energy are measured for as many transitions as there are unknowns the problem of determining the parameters
ClBk
_g_
ClRr reduces to the solving of a set of simultaneous equations. i
If the strain is not sufficiently small so that the extra crystal field~ produced by the strain altering the symmetry surrounding the lanthanide ion, have to be taken into consideration, the problem is much more complex as new eigenfunctions have to be obtained for both levels
()Bk
of the transition. Solution for the parameters __g_ then follows a aRr.
similar format to that described above for the lstatic crystal field k
parameters B , although the problem may become unwieldy. q
To simplify the problem as much as possible i t is preferable to choose a system in which the number of crystal field parameters is a minimum. As a
v
00 crystal field causes a uniform shift of all levels, no information regarding i t can be obtained from transitions solely within the 4f configuration. Thus levels of J
=
0,~ can be assumed toremain stationary under the strain. For levels with J
=
1 , 2, -3 the conditions for non-vanishing of the 3J symbol allows only second order crystal fields to cause them to split or shift. Three ions which were studied and which have levels with either J=
1 or%
are trivalent praseodymium and erbium.and divalent samarium.For samarium substituted in a MeF
30
For ionized ions, the necessary charge compensation reduces the field from cubic to tetragonal, trigonal or a lower symmetry, all of · which do involve second order fields.
2-8 POWER LAW DEPENDENCE OF THE
From the electrostatic point charge approximation the
. d k
crystal f1el parameters B are expected to have a dependence on the q
distance between the lanthanide ion and the ligands of the host lattice of the form
k B
q
0: l
k+l R
On the assumption of the superposition model - the total crystal field is the summation of that due to each ligand of the lattice - Newman has shown that the Bk above can be separated into an angular part and a
q radial part,
where
viz.
K
(8.¢.),
the coordination factors, depend solely on the angular kq l lpositions of the ligands. The Bk(Ri) are assumed to have a power law dependence tk on distance, of the form
=
for a restricted range of R where R
only the radial dependence is affected by a hydrostatic strain. In this case
=
the power law dependence of the crystal field. With the identification that the strain components
E:
+
E:+
E:XX yy zz.
( E: . . )
l.J
the orbit lattice parameter defined earlier (see eqt. 2-7(15)) dBk /dR. is
q 1.
related to tk by
For the electrostatic model [3] tk is expected to give
3 5 7
In practice, studies show that tk departs significantly from these values and in particular for t
Andonian temperature measuring equipment
Helium Return Line
Helium Storage Dewar Drive Electronics
dewar
Crystal mounted in Dewar tail
Photomultiplier
Chart Recorder
Oscilloscope
Light source and optics
Spectrometer Jarrell Ash
Chart recorder
Starting oscillator
Frequency counter
D.C. Amplifier
CHAPTER THREE
EQUIPJI1ENT
3-1 INTRODUCTION
Fig. (3.1) is a schematic diagram of the equipment used to strain the samples in the present studies. The composite oscillator consists of two piezoelectric quartz crystals, called the drive and gauge, the former creating the strain while the latter measures it. The gauge output is fed back via an amplifier to the drive control forming a closed loop which maintains the strain oscillations.
The strain is also induced in the sample bonded to the drive
crystal. All are of a resonant length for a frequency of 80 kHz. Light passed through the sample is dispersed by a spectrometer and then detected by the photomultiplier, the output of which, together with a reference signal from the closed loop amplifier is passed to the
sensitive detector.
The detected signal is displayed by means of a chart recorder. E~ch component is now discussed in greater depth.
3-2 THE DRIVE AND GAUGE QUARTZ CRYSTALS
The -18. x cut a quartz crystals designed to oscillate in a longitudinal mode at a fundamental frequency of 80 kHz at room
35
GAUGE CRYSTAL
DRIVE CRYSTAL
SPECIMEN
[image:52.596.67.527.111.619.2]other modes. They also report that at room temperature the frequency constant for these crystals is 2550 mm-kHz for a 0.1 width to length ratio which is in agreement with the above figures (79650
±
150 Hz and 3.202±
.003 em gives 2550.4±
7 mm-kHz) and that the frequency-6 0
temperature coefficient is almost constant (-20 x 10 Hz/
c
at room temperature) for this particular cut.The assembly consisting of two quartz crystals bonded to the sample crystal is shown in fig. (3.2) (section 3-5 discusses the bonds used) and follows that used by Marx [90] and Robinson [91] . I t should be noted that the latter have mislabelled the faces in their diagram
(fig. (2a) of [91]) which caused considerable confusion in the early stages of this project. The drive crystal is used to generate the strain and the gauge to measure the actual strain applied to the sample. The drive and gauge are bonded with their faces perpendicular to minimize electrical pickup between them. Electrodes were painted on the long faces of the crystals adjacent to the z faces using Silver Print Paint
[92] usually sever?l layers being applied until the resistance along the 3 em length was less than 5 ohms. Electrical contacts were fixed to the centre of these faces by a 'blob' of silver paint which also stopped the crystals from vibrating in their holder. Vacuum deposited electrodes of silver and of gold were found to produce no noticeable difference in performance.
Robinson et al. [22] report for the three component oscillator the longitudinal strain ~
1
(i) in component i of fundamental wavelength A(i)~(6.406 ± 0.002 em) is given by(i)
~1
maxnn
NA(i) Cm Vg(rms)
0
37
N 0.158 ~
2
coulomb/meter,-3
~
2
being the width of the silver plated faces (3 x 10 m), Vg the r.m.s. voltage andCm
is the capacitative load across the. gauge crystalThe values in brackets are those used for the present experiment which operates at a frequency of 80 kHz. They give
l . 97 x 10 -5 Vg (peak to peak - p-p)
-5
5.85 x 10 Vg (rms)
Typical voltages used were lv p-p.*
In order that the present measurements may be related to those of other experimenters [26] [27] in which a static stress Q. is used, i t is
l ]
necessary to establish what values of strain E .. will result when a stress
l ]
is applied along the crystal axis. Since all components of stress are zero except
a
(crystal axis)l l
E)_l (crystal axis) S (crystal axis)a (crystal axis)
l l l l ll
where the compliances S (crystal axis) in the crystal axis system may be l l l l
related to those of the principle axis system by
S (crystal axis)
l l l l a1 p lq lr ls pqrs a a a S (principle axis system)
the a .. being the direction cosines relating the two axis systems. Nye l ]
[23] gives the relevant expression for all crystal classes. For the
cubic system he finds
s
1111 (crystal axis)
s
l l l l- 2 ( s
l l l l ll22-s
- hs
2 2323)
where £, is a unit vector expressed in the cubic crystal axis system. For l
a strain along the <lll> direction
giving
s
1111 (crystal axis)
l 3
<100> denoting the. cubic crystal axis system. Wooster [24] shows the stiffnesses Cijk£ and compliances Sijk£ for the cubic system to be related by
l
2C' ll22
39
,_.,.--_ _ Screw for variable electrode separation
~'::::II'"---Gauge crystal
Drive crystal
.--- Specimen crystal catcher
[image:56.596.94.489.76.678.2]Photograph 3-2
and
s
<111> 1111E <111> 1111
-13 2 10.44 x 10 em /dyne
(10. 44 x 10 -l3 cm2 /dyne)
a ·· ....
1<111> 111
Thus the pressure which must be exerted along the <111> direction to produce a strain corresponding to that obtained when lv p-p is developed across the gauge crystal is
a
<111> 1111r::
1111 <111> <111> 111
7 2
1.89 x 10 dynes/em
5
2
l . 92 x 10 kg/m
Comparison with the measurements of Runciman [26] suggests that strains used for the present measurements - qorresponding to lv p-p gauge voltage - are x45 below the maximum the crystal will withstand. However, measurements presented in section 3.3 suggest this figure may be in·error.
3-3 THE CRYSTAL HOLDER AND SUPPORT SYSTEM
42
Helium exit
helium entrance
Screw for height adjustment
ring seal
cryogenic coaxial cable.
Diameters:
Inner wire 42SWG Solid copper weld outer
36SWG Shield impedance 50st 26pf/ft
[93]
Tufnol end piece into
which crystal holder is plugged.
[image:60.595.117.471.80.680.2]