Rolling Circle Amplification Is More Sensitive than PCR
and Serology-Based Methods in Detection of Banana streak
virus in Musa Germplasm
Moses C. Wambulwa1, Francis N. Wachira2*, Laura S. Karanja3, Samuel M. Muturi1
1Department of Biochemistry and Molecular Biology, Egerton University, Njoro, Kenya; 2Association for Strengthening Agricultural
Research in Eastern and Central Africa (ASARECA), Entebbe, Uganda; 3Kenya Agricultural Research Institute, Njoro, Kenya. Email: *[email protected]
Received August 15th, 2012; revised September 19th, 2012; accepted October 5th, 2012
ABSTRACT
Banana (Musa sp.) is a popular and important crop among many communities in East Africa. Banana production is
however threatened by the wide-spread banana streak disease (BSD), caused by Banana streak virus (BSV). The
suc-cess of BSV management is inherently coupled to the availability of a sensitive indexing method. In this study, the sen-sitivity of three BSV detection techniques: rolling circle amplification (RCA), immunocapture PCR (with degenerate and Gold finger primers) and standard PCR was compared. A set of 32 BSD-asymptomatic samples were used to com-pare the techniques. Analysis of variance (ANOVA) for comparison of the four techniques showed that there were sig-nificant differences (P < 0.05) among all the means, with RCA and direct PCR having the highest detection mean values. Owing to its fidelity and capacity to circumvent the amplification of the integrated nuclear viral sequences, the RCA technique is recommended for routine indexing of Musa tissues for BSV. This study unveils a more reliable BSV
detec-tion method, a need that has remained unaddressed for a long while.
Keywords:Banana streak virus; Rolling Circle Amplification; Polymerase Chain Reaction
1. Introduction
Banana streak disease, caused by Banana streak bad-navirus, accounts for up to 90% yield losses in banana
[1]. It also reduces plant growth and vigor, bunch weight and yield [2]. A wide range of cultivars of all genotypes are susceptible including a significant proportion of the improved tetraploid Musa hybrids [3].
A high degree of genomic and serological heterogenity between BSV isolates poses a challenge to reliable in-dexing of the virus. Moreover, the integration of the virus genome into the host genome [4,5] has been making ex-clusive nucleic acid-based detection of the virus frustrat-ing, as virtually all Musa tissues test positive to BSV.
The success of banana streak disease control is almost entirely dependent on the availability of accurate, sensi-tive, low cost and simple diagnostic techniques, which enable early detection of virus infections in plant materi-als [6]. The commonly used BSV-indexing tools include visual inspection for symptoms which are highly spo-radic and may be confused with those of Cucumber mo-saic virus (CMV), Immuno-Sorbent Electron Microscopy
(ISEM), which is laborious and requires complex and
expensive equipment, and Enzyme-Linked Immuno- Sorbent Assay (ELISA) which has so far proved rela-tively insensitive [7]. The serological and genomic het-erogeneity among BSV isolates has compounded the whole concept of BSV detection [8]. Direct PCR is lim-ited by the integration of viral sequences in the host ge-nome which causes the technique to give false positives in BSV detection. The above enumerated challenges therefore necessitate the search and development of a sensitive tool for BSV diagnostics.
The complexity of molecular detection of BSV is at-tributed to two factors; first is the presence of integrated sequences in the host genome which might give false- positives [4] during PCR-based detection procedures. This is the limitation of the standard Polymerase Chain Reaction (PCR) for BSV detection. The high serological variability of the virus is also likely to give false-nega- tives during serological identification using procedures such as the enzyme linked immuno-sorbent assay (ELISA). To circumvent the challenge posed by the inte- grated sequences, detection of episomal BSV by PCR may be preceded by an immuno-capture step to prevent amplification of these sequences. This constitutes a tech-nique known as immuno-capture polymerase chain
tion (IC-PCR). However, IC-PCR is still deficient for BSV indexing due to the antigenic heterogeneity among the isolates.
This work presents comparative data on three BSV detection techniques. This is the first report on compari-son of the novel RCA technique against the other tradi-tional BSV detection techniques.
2. Materials and Methods
2.1. Sample Collection
Thirty two BSD-asymptomatic banana leaf samples were collected from the Kenya Agricultural Research Institute (K.A.R.I.) Kisii banana field in South Western Kenya. This field had been reported to have a high infection rate of banana streak disease (BSD) about four months before sampling. It was therefore assumed that most of the as-ymptomatic samples collected were BSV-infected. De-tails of the collected samples are shown in Table 2. The
samples were then packed in silica gel bottles and trans-ported to the Kenya Agricultural Research Institute (K.A.R.I.), Njoro, Kenya. Indexing was done for BSV using RCA, IC-PCR and standard PCR for comparison.
2.2. Extraction Buffers
The DNA extraction buffer was prepared by mixing 2% cetyltrimethylammonium bromide, 100 mM Tris-HCl, pH 8.0, 50 mM EDTA, 1.4 M NaCl, 80 mM NaSO3, and
2% PVP-10. During buffer mix preparation, all ingredi-ents except CTAB were mixed and made up to 450 ml using deionised water. The 10 g of CTAB was then dis-solved in 50 ml of water in a falcon tube and mixed gen-tly to avoid foaming. The CTAB was then combined with the rest of the buffer solution and mixed well. The BSV extraction buffer on the other hand comprised of 1 litre phosphate buffered saline, 20 g polyvinylpyrroli-done and 10 g Na2SO3.
2.3. Nucleic Acids Extraction
Total nucleic acids were isolated from the leaf sample using a modified cetyltrimethylammonium bromide (CTAB) protocol as described by Gawel and Jarret [10] and James et al. [11]. Dry leaf tissue (0.05 g) was ground
in liquid nitrogen using pestle and mortar while adding 300 µl of the CTAB extraction buffer. The slurry was then incubated at 65˚C for 15 minutes, spinned at 13,000 rpm and 750 µl transferred to a fresh tube. This was then mixed with an equal volume of chloroform/isoamylal- cohol (24:1) and centrifuged for 5 minutes at 13,000 rpm. Nucleic acids in the aqueous phase were then pelleted using isopropanol and centrifuged for another 5 minutes at 13,000 rpm. The DNA pellet was then washed with
500 µl of 70% ethanol, and resuspended in 100 µl of nuclease-free water. The DNA was left at 4˚C overnight to fully dissolve. The total nucleic acids extracted were treated with 10 mg/ml of RNAse A by incubating with 2 µl of RNase A with 100 µl of total nucleic acids at 37˚C for 2 hr. The RNase A reaction was terminated by incu-bating the mixture at 65˚C for 10 minutes. The nucleic acids were stored at −20˚C.
The quality of the nucleic acid extracts was tested by both electrophoresis on 1% agarose gels and PCR for houkeeping genes using a number of randomly se-lected samples. DNA integrity was ascertained by carry-ing out actin gene PCR. A PCR master mix of 12.55 µl comprised of 1.25 µl of PCR buffer, 0.5 µl dNTPs, 0.75 µl of 50 mM MgCl2, 0.25 µl of banana actin forward and
reverse primers, 0.05 µl Taq, 8.75 µl SDW and 1 µl of
the total nucleic acid extract. The PCR cycling conditions for the actin gene PCR were an initial denaturation at 94˚C for 2 minutes, 35 cycles (94˚C for 20 seconds, 57˚C for 20 seconds and 72˚C for 30 seconds) and a final ex-tension at 72˚C for 3 minutes. Electrophoresis for actin gene PCR products was carried out on 1.5% ethidium bromide-stained agarose gels with Tris-Acetate EDTA (TAE) as running buffer.
The thirty two DNA samples were then separately subjected to three BSV indexing procedures (RCA, stan-dard PCR and IC-PCR). IC-PCR was separately carried out using both degenerate and specific primers. Each treatment was replicated three times. These procedures are outlined in the following sections.
2.4. Rolling Circle Amplification
The full Banana streak virus genome was amplified and
isolated using the TempliPhi Kit (GE Healthcare) ac-cording to James et al. [11]. Two mixes were prepared.
In master mix 1 (MM1), 5 µl of TempliPhi Sample Buffer was mixed with 1 µl of the isolated sample and 1 µl of primer mixture (details shown in Table 1) in an
appropriate reaction vessel. This was then heated at 95˚C for 3 minutes to denature the DNA followed by cooling at 4˚C. Denaturation is necessary because BSV is double stranded. Master Mix 2 (MM2) was prepared by mixing 5 µl of TempliPhi Reaction Buffer and 0.2 µl of Tem-pliPhi Enzyme Mix. Five microlitres of this TemTem-pliPhi premix (mix 2) was transferred to the cooled, denatured sample (MM1) then incubated at 30˚C for 18 hours. Af-ter this incubation period, the enzyme (Phi29 DNA po
lymerase) was heat-inactivated at 65˚C for 10 minutes. The samples were then be cooled and stored at 4˚C.
Ten microlitres of the TempliPhi product from each of the samples were then incubated separately with Stu I
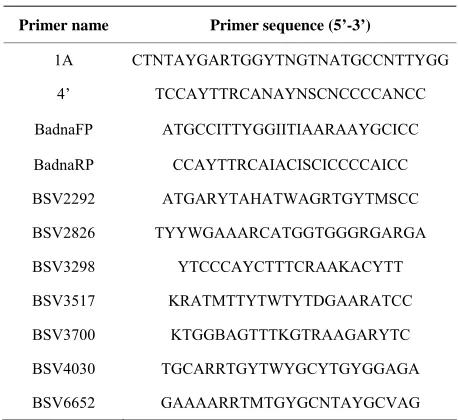
Table 1. RCA degenerate primers.
Primer name Primer sequence (5’-3’)
1A CTNTAYGARTGGYTNGTNATGCCNTTYGG 4’ TCCAYTTRCANAYNSCNCCCCANCC BadnaFP ATGCCITTYGGIITIAARAAYGCICC BadnaRP CCAYTTRCAIACISCICCCCAICC BSV2292 ATGARYTAHATWAGRTGYTMSCC BSV2826 TYYWGAAARCATGGTGGGRGARGA BSV3298 YTCCCAYCTTTCRAAKACYTT BSV3517 KRATMTTYTWTYTDGAARATCC BSV3700 KTGGBAGTTTKGTRAAGARYTC BSV4030 TGCARRTGYTWYGCYTGYGGAGA BSV6652 GAAAARRTMTGYGCNTAYGCVAG
over other restriction enzymes due to its capacity to gen-erate distinct polymorphic profiles for the BSV genome. A 20 µl aliquot of the digested TempliPhi product was mixed with 2 µl of the loading dye (30 mg 0.42% bro-mophenol blue; 84 mg 0.42% xylene xyanol; 12 ml 60% glycerol) and electrophoresed for about 20 minutes at 100 V on a 1% SYBR Safe-stained agarose gel using 1 × Tris Boric EDTA or Tris Acetate EDTA as the running buffers. The gel was photographed under ultra violet (UV) illumination with Gel Doc (BIO-RAD) Software (USA). Internal standards for BSV isolates generated using Stu I
(New England BioLabs) were used to identify the iso-late(s) present in each sample.
2.5. Immuno-Capture Polymerase Chain Reaction
Immuno-capture Polymerase Chain Reaction (IC-PCR) involved extraction of the leaf sap from all the asympto-matic samples and concentration carried out as described by Harper et al. [12]. One gram of silica gel-dried leaf
sample was ground in 5ml of the BSV extraction buffer. Before carrying out the IC-PCR on all the samples, opti-mization was done for the antibody and antigen in con-centrations of 5:1000, 10:1000 and 15:1000 in the car-bonate coating buffer. The optimization was carried out on infected symptomatic tissues. Thin-walled propylene microfuge tubes were coated with polyclonal antibodies. The tubes were then washed three times with 100 µl of PBS-Tween-20. Sap extract (about 100 µl) of the sam-ples was added to each tube then incubated at 37˚C for 3 hours. The tubes were again washed twice with PBS-T, once with sterile distilled water (SDW) and then dried briefly before carrying out PCR directly in the tubes [12].
The PCR step was carried out using both degenerate and isolate-specific (Gold finger) primers in separate reactions. Two pairs of different types of BSV degener-ate primers (badna and Harper’s 1A/4’) were first evalu-ated. The badna pair appeared to give more consistent results and was therefore used for this experiment. A 20 µl PCR mix contained 10 µl of Go Taq Green master mix
(Promega), 0.5 µl of each primer at a concentration of 10 pmol/µl, 8 µl of SDW and 1 µl of DNA. The PCR cycle conditions were an initial denaturation at 94˚C for 5 min-utes, 5 cycles (94˚C for 30 seconds, 37˚C for 30 seconds and 72˚C for 1 minute), followed by 30 cycles (94˚C for 30 seconds, 50˚C for 30 seconds and 72˚C for 1 minute) and a final extension at 72˚C for 10 minutes. The PCR products were electrophoresed on a 1.5% SYBR Safe- stained agarose gel as described earlier.
2.6. Direct PCR
Direct PCR was carried out on the 32 samples using the Badna degenerate primers only. The PCR mix comprised of 5 µl of Top Taq master mix (Qiagen), 0.25 µl of each
primer at a concentration of 10 pmol/µl, 3.5 µl of SDW and 1 µl of DNA. The PCR cycling regimes were an ini-tial denaturation at 94˚C for 3 minutes, 35 cycles (94˚C for 30 seconds, 50˚C for 30 seconds and 72˚C for 1 min-ute) and a final extension at 72˚C for 3 minutes. The PCR products were electrophoresed on a 1.5% ethidium bromide-stained agarose gel as described earlier.
3. Results
Actin gene PCR for DNA samples selected randomly gave expected 664 bp amplicons as shown in Figure1,
confirming that the DNA was intact and of PCR-quality. An evaluation of two degenerate primer pairs to be used for IC-PCR and direct PCR showed that the badna prim-ers were better. Results by the badna primprim-ers were re-producible and the bands on agarose gel were more dis-tinct and clearer (Figure 2) than those for 1A/4’ [12].
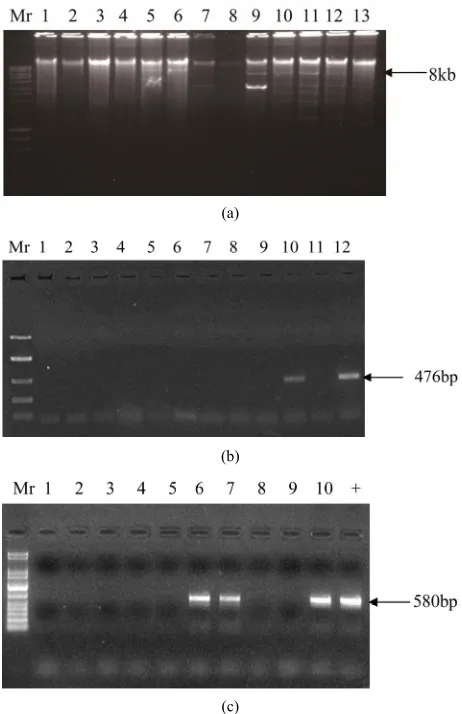
Results of the thirty two asymptomatic (but possibly BSV-infected) samples indexed for BSV using IC-PCR (using both degenerate and Gold finger primers), direct PCR and TempliPhi (RCA) are shown in Figures 3(a)-(c)
and Table 2. Direct PCR gave 93.8% detection with the
Figure 1. Actin gene PCR for DNA samples selected ran-domly. Mr is 1 kb Plus molecular marker.
Figure 2. Gel picture showing performance of two BSV degenerate primer pairs. Five BSV-symptomatic samples were used for this evaluation. Lanes 1-5 represent 1A/4’ primers while lanes 6-10 represent badna primers. Mr is a 1 kb ladder.
This latter observation was expected since direct PCR is known to give false positives for all Musa tissues.
Only samples 21 and 27 tested negative with direct/ standard PCR. IC-PCR with goldfinger primers showed 476 bp amplicons on a 1.5% ethidium bromide-stained agarose gel. These positives were obtained only in sam-ples number 10, 12, 19, 20, 27 and 28.
However, the detections observed in samples 27 and 28 were confirmed as erroneous by a repeat of the same experiment, IC-PCR with degenerate primers and by the rolling circle amplification (RCA) technique. IC-PCR with degenerate primers indicated that the two samples (27 and 28) were negative for BSV. This was also con-firmed by RCA.
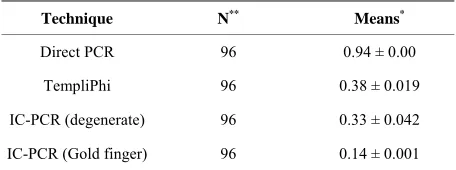
The analysis presented in Table 3 points out clearly
that direct PCR had the highest detection limit (mean = 0.94 ± 0.00). TempliPhi exhibited a higher mean detec-tion limit than IC-PCR. IC-PCR with Gold finger spe-cific primers gave the lowest mean detection level at 0.14 ± 0.001.
4. Discussion
The superiority of badna primers over Harper’s 1A/4’ can be explained on the basis of the high genomic vari- ability inherent within the BSV species. Both badna and 1A/4’ primers are designed to target the replicase (re-verse transcriptase/RNase H) region of the BSV ORF III. It is possible that natural molecular rearrangements have
(a)
(b)
(c)
Figure 3. (a) RCA for samples 1-13. Mr is a 10 kb ladder; (b) IC-PCR with Gold Finger primers for samples 1-12; (c) IC-PCR with Badna degenerate primers for samples 1-10. + is a positive control (banana leaf sample infected with BSMysV isolate). Mr for B and C is a 1 kb ladder.
occurred over time within this region of the genome, lowering the capacity of the 1A/4’ primers. This may however be remedied by use of touchdown PCR to de-termine a suitable annealing temperature. However, in this study, the classical annealing temperature of 50˚C was used for all BSV PCRs.
IC-PCR technique (both with specific and degenerate primers) amplified BSV sequences from partially puri-fied virus extraction for some of the samples, though with minimal reproducibility. IC-PCR with the gold fin-ger virus specific primers gave a 476 bp fragment while a 580 bp amplicon was observed with the badna degener-ate primers. The direct implication
[image:4.595.63.283.96.191.2] [image:4.595.93.250.229.314.2]Table 2. Details of 32 asymptomatic banana samples assayed for BSV using 3 virus indexing methods with each replicated thrice per sample.
Sample number Cultivar Genotype Direct PCR
(degenerate primers)
IC-PCR (degenerate primers)
IC-PCR
(Gold finger primers) RCA
1 Mysore AAB +++ - - -
2 Mysore AAB +++ - - -
3 Gold finger AAAB +++ - - -
4 Mysore AAB +++ - - -
5 Nshule EAH-AAA +++ -+- - +++
6 Nshule EAH-AAA +++ +++ - +++
7 Musera EAH-AAA +++ +++ - +++
8 Mysore AAB +++ - - -
9 Gold finger AAAB +++ - - - 10 Gold finger AAAB +++ +++ ++- +++ 11 Gold finger AAAB +++ - - +++ 12 Nshule EAH-AAA +++ +++ -++ +++
13 FHIA 18 AAAB +++ - - -
14 FHIA 18 AAAB +++ - - -
15 Solio EAH-AAA +++ +++ - +++
16 Solio EAH-AAA +++ +++ - +++
17 Sukari ndizi AAB +++ - - -
18 Musera EAH-AAA +++ - - +++
19 Solio EAH-AAA +++ +++ +++ +++ 20 Nusu Ng’ombe EAH-AAA +++ +++ +++ - 21 FHIA 18 AAAB --+ +++ - +++
22 Solio EAH-AAA +++ +++ - ++-
23 FHIA 18 AAAB +++ - - -
24 Solio EAH-AAA +++ - - -
25 Sukari ndizi AAB +++ - - -
26 FHIA 18 AAAB +++ - - -
27 Cavendish EAH-AAA --- - -+- -
28 FHIA 18 AAAB +++ - -++ -
29 FHIA 18 AAAB +++ - - -
30 FHIA 18 AAAB +++ - - -
31 FHIA 18 AAAB +++ - - -
32 Solio EAH-AAA +++ --+ - -
+
Table 3. Comparison based on least significant difference (LSD) test for the four detection techniques.
Technique N** Means*
Direct PCR 96 0.94 ± 0.00 TempliPhi 96 0.38 ± 0.019 IC-PCR (degenerate) 96 0.33 ± 0.042 IC-PCR (Gold finger) 96 0.14 ± 0.001 LSD0.05 = 0.0354. *Any two means are significantly different if their
differ-ence is the greater than LSD value; **N is the total number of replicates.
with Gold finger primers points out to the fact that this primer pair could not amplify thee target sequences of all the BSV isolates. The badna primers are designed to degenerately target the replicase (RNaseH/RT) region of all members of the Badnavirus genus. Other than Banana streak virus, many other members of the Badnavirus
ge-nus are known to exist [13]. Since these viruses are not hosted by banana, it is unlikely that they were amplified by the badna degenerate primers used in this study. To reinforce this further, the antisera used during the im-muno-capture step of IC-PCR were specific to BSV.
Although all the 32 samples were asymptomatic, it was possible to detect BSV in some samples. This is be-cause the 32 samples were collected from a field which four months before sampling, was highly endemic with banana streak disease. The implication is that most of the 32 samples were actually infected with BSV but had masked the symptoms probably due to changes in envi-ronmental conditions.
Results of this study show that the TempliPhi tech-nique has a greater capacity to reliably detect BSV than the other assayed techniques. This is expected because the TempliPhi technique allows for selective amplifica-tion of all circular DNAs within the tissue being indexed [14]. The high sensitivity, fidelity and processivity of
Phi29 DNA polymerase, the enzyme involved in
Tem-pliPhi amplification [15] ensures accurate and reliable diagnosis by means of this method. A number of factors can be used to explain the lower percentage detection by IC-PCR; the low reproducibility always inherent with IC-PCR, the high serological and genomic heterogeneity known to exist among BSV isolates [8] and probably the inactivity and/or non-specificity of the antisera. More-over, there appears to be a link between genetic and se-rological diversity; the former leads to the latter [16]. Since genetic diversity of Banana streak virus has been
shown to exist in Kenya [17], it is likely that serological variability among BSV isolates exists with almost the same measure as the genetic diversity.
Apart from the increased sensitivity and reliability of TempliPhi compared to IC-PCR and standard PCR,
TempliPhi has the advantage of allowing the identity of the isolate infecting the sample to be known. This can be an avenue for carrying out more accurate distribution studies for other viruses with circular DNA genomes.
Results for direct PCR and IC-PCR using degenerate primers were not in agreement. Direct PCR gave a 93.75% detection limit compared to the 31.25% with IC- PCR for the 32 asymptomatic samples. This finding con-firms earlier reports of possible integration of badnavirus sequences in their host genomes [4]. Much as most of the detections by direct PCR can therefore be safely classi-fied as false positives, recent studies have tentatively shown that direct PCR for detection of BSV can be reli-able for tissues without balbisiana (B) components in their genomes [11]. Banana cultivars of AAA and EAH- AAA genomes can be reliably indexed for BSV by means of direct PCR. Direct PCR for sample 27 (AAA cavendish) was indeed a confirmation of this finding. There was no detection of BSV for this sample using all the 3 techniques (direct PCR, IC-PCR and TempliPhi). More so, the positive detections observed with direct PCR for tissues with AAA genomes were confirmed by the other techniques. Therefore direct PCR in this case can be relied upon. However, the negative result ob-served for sample 21 was certainly erroneous since it was not in agreement with the results of the other techniques. The likely explanation is that the DNA for this sample was not of PCR quality.
As yet, it is not clear why the integrated sequences are never amplified by direct PCR in tissues exclusively containing acuminata (A) genome but earlier studies have established that the numerous infectious BSV en-dogenous pararetroviruses (integrated sequences) of dif-ferent BSV species are restricted to the B genome [18]. According to these studies, the integrated sequences in A genomes are usually non-infectious; they cannot be acti-vated by the tissue culture stress. This suggests that the non-detectability of these endogenous pararetroviruses in A genomes is linked to the position of these sequences in the genome.
It is an undisputed fact that rapid and reliable detection of Banana streak virus has been an enormous challenge
5. Acknowledgements
We would like to thank the Queensland University of Technology (QUT), Australia, through the Banana 21 project for funding this work. Special thanks also go to the Kenya Agricultural Research Institute, Njoro for availing laboratory facilities.
REFERENCES
[1] J. W. Daniells, A. D. W. Geering, N. J. Brynde and J. E. Thomas, “The Effect of Banana streak virus on the
Growth and Yield of Dessert Bananas in Tropical Austra-lia,” Annals of Applied Biology, Vol. 139, No. 1, 2001, pp.
51-60.doi:10.1111/j.1744-7348.2001.tb00130.x
[2] B. E. L. Lockhart and D. R. Jones, “Banana Streak,” In: D. R. Jones, Ed., Diseases of Banana, Abacá and Ensete,
CABI Publishing, Oxon, 1999, pp. 262-274.
[3] B. E. L. Lockhart, T. C. Ndowora, N. E. Olszewski and G. Dahal, “Studies on Integration of Banana streak bad-navirus Sequences in Musa: Identification of Episomally- Expressible Badnaviral Integrants in Musa Genotypes,” In: E. A. Frison and S. E. Sharrock, Eds., Banana streak virus: A Unique Virus—Musa Interaction: Proceedings of a Workshop of the PROMUSA Virology Working Group, Montpellier, 19-21 January 1998, pp. 35-42.
[4] A. D. W. Geering, J. N. Parry, L. Zhang, N. Olszewski, B. E. L. Lockhart and J. E. Thomas, “Is Banana streak virus
Strain OL the Only Activatable Virus Integrant in the
Musa Genome?” Proceedings of the 2nd International Conference on Molecular Cellular Biology of Banana, InfoMusa, Vol. 10, No. 2, 2001, pp. 13-20.
[5] G. Harper, R. Hull, B. E. L. Lockhart and N. Olszewski, “Viral Sequences Integrated into Plant Genomes,” Annual Review of Phytopathology, Vol. 40, 2002, pp. 119-136. doi:10.1146/annurev.phyto.40.120301.105642
[6] International Network for the Improvement of Banana and Plantain (INIBAP), “Report of the Meeting,” In: E. A. Frison and S. E. Sharrock, Eds., Banana streak virus: A Unique Virus—Musa Interaction: Proceedings of a Workshop of the PROMUSA Virology Working Group,
Montpellier, 19-21 January 1997, pp. 7-14.
[7] G. Thottappilly, G. Dahal and B. E. L. Lockhart, “Studies on a Nigerian Isolate of Banana streak badnavirus. I.
Pu-rification and Enzyme-Linked Immunoassay,” Annals of Applied Biology, Vol. 132, No. 2, 1998, pp. 253-261. doi:10.1111/j.1744-7348.1998.tb05201.x
[8] B. E. L. Lockhart and N. E. Olszewski, “Serological and Genomic Heterogeneity of Banana streak badnavirus:
Implications for Virus Detection in Musa Germplasm,” In: J. Ganry, Ed., Breeding Banana and Plantain for Resis-tance to Diseases and Pests, CIRAD, Montpellier, 1993,
pp. 105-130.
[9] D. Haible, S. Kober and H. Jeske, “Rolling Circle Ampli-fication Revolutionizes Diagnosis and Genomics of Ge- miniviruses,” Journal of Virological Methods, Vol. 135, No. 1, 2006, pp. 9-16.
doi:10.1016/j.jviromet.2006.01.017
[10] N. J. Gawel and R. L. Jarret, “A Modified CTAB Extrac-tion Procedure for Musa and Ipomoea,” Plant Molecular Biology Reporter, Vol. 9, No. 3, 1991, pp. 262-266. doi:10.1007/BF02672076
[11] A, P. James, R. J. Geijskes, J. L. Dale and R. M. Harding, “Development of a Novel Rolling—Circle Amplification Technique to Detect Banana streak virus Which Also
Discriminates between Integrated and Episomal Virus Sequences,” Plant Disease, Vol. 95, No. 1, 2011, pp. 57-
62.
[12] G. Harper, D. Hart, S. Moult and R. Hull, “Detection of
Banana streakvirus in Field Samples of Bananas from
Uganda,” Annals of Applied Biology, Vol. 141, No. 3, 2002b, pp. 247-257.
doi:10.1111/j.1744-7348.2002.tb00216.x
[13] M. Bousalem, E. J. P. Douzery and S. E. Seal, “Taxon-omy, Molecular Phylogeny and Evolution of Plant Re-verse Transcribing Viruses (Family Caulimoviridae) In-ferred from Full-Length Genome and Reverse Transcrip-tase Sequences,” Archives of Virology, Vol. 153, No. 6,
2008, pp. 1085-1102.doi:10.1007/s00705-008-0095-9 [14] L. Blanco and M. Salas, “Relating Structure to Function
in Phi29 DNA Polymerase,” Journal of Biological Chem-istry, Vol. 271, No. 15, 1996, pp. 8509-8512.
doi:10.1074/jbc.271.15.8509
[15] L. Blanco, A. Bernad, J. M. Lazaro, G. Martin, C. Gar-mendia and M. Salas, “Highly Efficient DNA Synthesis by the Phage Phi29 DNA Polymerase,” Journal of Bio-logical Chemistry, Vol. 264, No. 15, 1989, pp. 8935-
8940.
[16] B. O. Agindotan, G. Thottappilly, A. Uwaifo and S. Win-ter, “Production of Monoclonal and Polyclonal Antibod-ies against a Nigerian Isolate of Bananastreakvirus,” Af-rican Journal of Biotechnology, Vol. 2, No. 7, 2003, pp.
171-178.
[17] L. Karanja, A. Wangai, G. Harper and R. S. Pathak, “Mo-lecular Identification of Banana streak virus Isolates in
Kenya,” Journal of Phytopathology, Vol. 156, No. 11-12, 2008, pp. 678-686.
doi:10.1111/j.1439-0434.2008.01415.x
[18] G. Dahal, F. Dahal, C. Pasberg-Gauhl, J. D. A. Hughes, G. Thottapilly and B. E. L. Lockhart, “Evaluation of Micro- propagated Plantain and Banana (Musa spp.) for Banana streak badnavirus Incidence Under Field and
Screen-house Conditions in Nigeria,” Annals Applied Biology,