PATIENT SAFETY
Lowering the Dose in Head CT Using Adaptive
Statistical Iterative Reconstruction
K. Kilic G. Erbas M. Guryildirim M. Arac E. Ilgit B. Coskun
BACKGROUND AND PURPOSE: While CT has found wide use in medical practice, it is also a substantial source of radiation exposure and is associated with an increased lifetime risk of cancer. There is an urgent need for new approaches to reduce the radiation dose in CT. In this regard, ASIR is an alternative method to FBP. We assessed the effect of ASIR on dose reduction in adult head CT.
MATERIALS AND METHODS: We retrospectively evaluated a sample of 149 adult head CT examinations that were divided into 2 groups, STD and LD. We lowered the tube current and used ASIR in the LD group. SNR and CNR were analyzed. Dose parameters were recorded while subjective image noise, sharpness, diagnostic acceptability, and artifacts were graded. The Studentttest, the Mann-Whitney Utest, andstatistics were used for statistical analyses.
RESULTS: We achieved a dose reduction of 31% in the LD group (STD, 2.3 ⫾ 0.1 mSv; LD, 1.6⫾0.1 mSv;P⬍.001). There was no significant difference in the noise measured in the air between the 2 comparison groups (P⫽.273). Noise in the CSF was higher in the STD group (P⬍.001), while the noise in the WM was higher in the LD group (P⬍.001). Differences in the CNR between groups were insignificant, but the STD group displayed better SNR values. There was no significant difference in the modal scores of diagnostic acceptability (P⫽.062) and the artifacts (P⫽.148) between the 2 groups. Better scores for subjective image noise (P⬍.001) and sharpness (P⫽.04) were observed in the STD group.
CONCLUSIONS:ASIR appears to be useful in reducing the dose in adult head CT examinations. While the effect of ASIR on noise reduction observed in the present study of head CT is less than that reported previously in abdomen and chest CT, these findings encourage further prospective studies in larger patient samples.
ABBREVIATIONS:ASIR ⫽ adaptive statistical iterative reconstruction; CNR ⫽ contrast-to-noise ratio; CTDI ⫽ CT dose index; CTDIvol ⫽ volume CT dose index; CTn ⫽ CT number; DLP ⫽ dose-length product; ED⫽effective dose; FBP⫽filtered back-projection; GM⫽gray matter; LD⫽ low dose; SNR⫽signal-to-noise ratio; STD⫽standard dose; WM⫽white matter
W
ith recent advances and availability of biotechnology, CT has become a major source of medical radiation ex-posure.1At present, CT-derived dose accounts for 75% of the dose given at medical imaging. Given the past reports2 point-ing to the major contribution of CT in the increased risk of lifetime cancer associated with medical radiation, there is an urgent need for new approaches to reduce the dose in CT. To date, some of the dose-reduction strategies that have been vestigated and proved to be efficient include, for example, in-plane and longitudinal automatic tube-current modulation, lowering tube potential especially in iodinated examinations, bismuth shields, filters, x-ray shutters for over-ranging, in-creasing detector efficiency, and low-dose techniques.3-5Recently, some of the mathematic methods for reconstruc-tion that have been known since the 1970s have been used for CT research and practice. These methods remove the noise from the image by means of iterations. Notably, iterative re-construction has been used in positron-emission tomography but could not be implemented in CT until now because calcu-lations required for these methods can only be performed with recently developed high-performance computer processors.
Noise is inversely proportional to the square root of the
dose. By lowering image noise, these methods can, conceiv-ably, be used to reduce radiation dose. Indeed, clinical studies supporting this hypothesis have been reported, describing the use of iterative reconstruction methods such as ASIR—a name given by the vendor (GE Healthcare, Milwaukee, Wiscon-sin)—in abdomen6-8and chest CT9-11and coronary CT an-giography.12-14On the other hand and most important, the role of ASIR in head CT has never been reported to date, to our knowledge. The aim of the present study was to assess the effect of ASIR on dose reduction in adult head CT by using a 16-section multidetector row CT scanner. While the re-ported observations herein derive from a retrospective exam-ination, we submit that they contribute to the emerging knowledge base on the utility of iterative methods to achieve CT dose reduction.
Materials and Methods
Study Description and Patient Sample
This retrospective study was reviewed and approved by the Gazi Uni-versity Institutional Review Board.
From July 1, 2010, to August 31, 2010, 149 consecutive patients who underwent head CT with a 16-section multidetector row CT scanner (BrightSpeed, GE Healthcare) were examined retrospectively in the present study.
There were 2 groups of patients: 1) the STD group comprising 51 patients (28 men, 23 women; mean age, 52.0 years; range, 20 – Received November 15, 2010; accepted after revision February 5, 2011.
91 years) who went through the STD and standard reconstruction algorithm (FBP) head CT protocol before implementation of ASIR in our protocols; and 2) the LD group comprising 98 patients (44 men, 54 women; mean age, 55.5 years; range, 19 –94 years) who were ex-amined with LD and a mixture of ASIR and FBP reconstruction algo-rithm head CT protocols after implementation of ASIR as a depart-mental policy.
Only adult patients were examined in the present study because, in our department, different protocols are used for children of different age groups. Hence, our focus on adult patients ensured consistency in the protocol used in the present study sample. Moreover, to have adequate noise measurements, patients with images with severe streak artifacts caused by foreign bodies, metallic surgical materials, and movement of the head were excluded from the study. Emergency patients, who were scanned with a faster helical mode protocol, were also excluded. Only noncontrast studies were included, while pa-tients’ follow-up examinations were excluded.
Scan Protocol
A lateral scout image with 100 kV (peak) and 20 mA was obtained to define the scan area prior to axial imaging. Scanning parameters of the STD group wre 170-mA tube current, 2-second tube-rotation time, 140-kVp tube voltage, 4⫻2.5 mm section thickness, 25-cm FOV, a standard reconstruction algorithm for the posterior fossa; and 270-mA tube current, 1-second tube rotation time, 120-kVp tube voltage, 2⫻5 mm section thickness, 25-cm FOV, a standard recon-struction algorithm for the cerebrum. A routine reconrecon-struction algo-rithm of FBP was used. The same protocol except with lowered mA settings (125 mA for the posterior fossa, 190 mA for the cerebrum) and the addition of ASIR (30%) was used in the LD group. Thirty percent ASIR means a blend of 30% ASIR and 70% FBP. ASIR per-centage can be selected in a spectrum of 0%–100%, where 0% means all FBPs and 100% means all ASIRs. With the increase in the percent-age, noise decreases. At higher levels, contours of the structures begin to blur.6,11With the vendor’s suggestions (30%–50%) and our initial experience, we chose 30% by consensus in our department.
Dose Parameters
The CTDIvoland DLP were derived from the result page of each examination, which was automatically prepared by the system. ED (mSv) was estimated by multiplying DLP (mGy.centimeter) by a con-version factor (0.0021 mSv⫻mGy⫺1⫻cm⫺1).15
Quantitative Analysis
Image noise, defined by a percentage SD of the mean CTnwithin a region of interest, was measured in the air, CSF, and WM. A region of interest (60 mm2) was placed in the air on the 3 consecutive sections at the level of the posterior fossa, and an average of the measurement of 3 sections was used for comparison. A place with minimum streak artifacts and maximum 1-cm distance away from the patient was chosen. We measured noise in the CSF in a subgroup of patients (82/98, 84%, LD group; 38/51, 75%, STD group) whose lateral ven-tricles were suitable for drawing a region of interest ofⱖ15 mm2. A third region of interest of 40 mm2was placed in the WM at the level of centrum semiovale.
Moreover, the CNR and SNR were analyzed as described in the literature.16-18For CNR, 3 regions of interest of 4 mm2were placed in the WM and 3 regions of interest of 4 mm2were placed in the GM at the level of centrum semiovale without causing partial volume effects. CTnand SD values were recorded and averaged for each part. CNR
was calculated by using a standard equation: (mean GM CTn⫺mean WM CTn)/[(SD GM)2⫹(SD WM)2]1/2. For SNR, 3 regions of inter-est of 20 mm2were placed in the WM at the level of centrum semi-ovale. CTnand SD values were recorded and averaged. SNR was cal-culated by dividing the CTnby the SD.
Qualitative Analysis
Examinations were reviewed in a random manner at the same work-station (Advantage Windows 4.4, GE Healthcare) by 2 radiologists working independently (G.E., 10 years’ experience; K.K. 8 years’ ex-perience) who were blinded to the protocol, ASIR usage, and date. Image noise, sharpness, diagnostic acceptability, and artifacts were graded. A second-year resident (M.G.) helped in the interpretation process by removing all the information on the monitor and anony-mizing the patients. Window level (40 – 60 HU for the posterior fossa, 40 –50 HU for the cerebrum) and window width (80 –100 for the posterior fossa, 50 –70 for the cerebrum) were kept within predefined limits for all images.
Subjective noise was graded on a 4-point scale: 1, little, best noise; 2, optimum noise; 3, noisy but permits evaluation; and 4, too much, which degrades the image so that no information can be gathered.
Sharpness was graded on a 5-point scale according to WM and GM differentiation; visualization of the basal ganglia, pons, and ven-tricular system; and CSF space around the mesencephalon and over the brain: 1, Structures are well-defined with sharp contours; 2, better seen but contours are not fully sharp; 3, structures can be seen, con-tours are sharp enough, diagnostic information can be retrieved; 4, structures can be visualized but not enough for diagnostic report-ing; contours are blurred; and 5, structures cannot be defined.
Diagnostic acceptability was graded on a 4-point scale: 1, fully acceptable; 2, probably acceptable; 3, only acceptable under limited conditions; and 4, unacceptable. The presence of artifacts was graded on a 4-point scale: 1, no artifacts; 2, minor artifacts; 3, major artifacts; and 4, artifacts that make interpretation impossible. The grading method was constructed around the European Guidelines on Quality Criteria for Computed Tomography.19
Statistical Analysis
We compared the STD and LD groups by using quantitative measure-ments and qualitative modal scores. For modal score comparison, the average of the scores of the 2 readers was used.
An unpaired Studentttest was used for continuous variables, and a Wilcoxon rank sum (Mann-WhitneyU) test was used for categoric variables. A statistically significant difference wasP⬍.05. The degree of interobserver agreement was determined by using statistics (Statistical Package for the Social Sciences, Version 13.0; SPSS, Chicago, Illinois).
Results
The differences in the ages and number of images were not significant (P⬎.05).
After lowering the tube current, we achieved a significant dose reduction of 26% in the CTDI of the posterior fossa, 35% in the CTDI of the cerebrum, and 31% in the DLP and ED (P⬍.001) (Table 1).
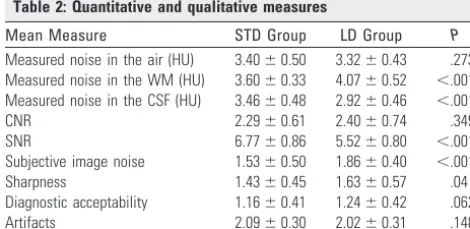
The quantitative and qualitative measures are presented in Table 2.
Noise measured in the air and CSF in the LD group was less than that of in STD group, with insignificant difference in the former (P⫽.273) and a significant difference in the latter
PATIENT
(P⬍.001). On the other hand, when we measured noise in the WM, we found higher noise values and lower SNR in the LD group than in the STD group (P⬍.001). The difference in the CNR values was insignificant (P⫽.349).
There was no significant difference in the diagnostic ac-ceptability (P⫽.062) and artifacts (P⫽.148) between groups. None of the images of the patients were graded as diagnosti-cally unacceptable. Two patients (1 from the LD group, 1 from the STD group) had scores of 3 (Fig 1), and 2 patients (both from the LD group) had scores of 2.5. The rest of the patients (97%, 95/98, of the LD group; 98%, 50/51, of the STD group) had scoresⱕ2 (Fig 2). None of the patients had artifacts that impeded evaluation.
Modal scores for subjective image noise (P⬍.001) and sharpness (P⫽.04) were better in the STD group. However, all patients in both groups were considered suitable for report-ing, thus having scores ofⱕ3 for both criteria.
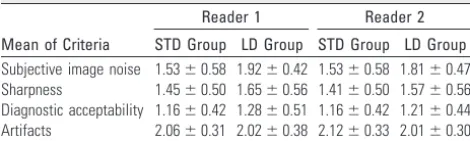
Interobserver agreements were moderate for image noise (⫽0.556), sharpness (⫽0.539), and diagnostic acceptabil-ity (⫽0.540) and substantial for artifacts (⫽0.613). The differences between the scores of the readers never exceeded 1 in any criteria. The visual scores for both readers are given in Table 3.
Discussion
With the increasing public awareness of the radiation dose burden of radiologic examinations, dose-reduction strategies for CT have attracted marked interest among the research community. In pursuit of such new approaches to reduce the radiation dose in CT, relatively old iterative reconstruction algorithms have been increasingly revisited in this research field. Most of the scanners that are in use currently have ana-lytic reconstruction algorithms called “FBP.” While FBP is fast as an algorithm, it is also sensitive to noise and artifacts be-cause it ignores the system optics and statistical fluctuations of photons. On the other hand, with iterative reconstruction methods, the focal spot size, image voxel, and detector size (namely system optics) are taken into consideration.7,20
Iterative reconstruction starts with an initial estimate and forward projection. Subsequently, this projection is updated
to minimize the difference between the actual image and the forward projection. Photon statistics are also put into this es-timation, updating flow. Abnormal measurements, which are deviated far from the adjacent ones, are considered statistical fluctuations and are removed. This process is repeated until the difference between the successive iterations gets smaller. The largest part of the extensive calculations required is mostly for the modeling of the system optics. On the other hand, the modeling of system statistics is not as demanding as the mod-eling of system optics. The reconstruction algorithm used in our system (ASIR) deals only with the system statistics; by doing so, it allows faster reconstruction.7,20
The vendors tend to implement their own iterative image reconstruction methods to achieve dose reduction without image-quality degradation (GE: ASIR; Siemens, Erlangen, Ger-many: Iterative Reconstruction in Image Space21-23; Toshiba Medical Systems, Tokyo, Japan: Adaptive Iterative Dose Re-duction; and Philips Healthcare, Best, the Netherlands: iDose.24 With these methods, 30%– 80% dose reduction is expected.
By adapting ASIR into our protocols, we observed a reduc-tion in the head CT dose by 31% in the LD group without compromising the CNR and diagnostic acceptability. Similar reductions were reported in abdomen CT by Hara et al (29%– 65%),6Prakash et al (25.1%),7and Sagara et al (33%)8and in chest CT by Prakash et al (27.6%).10Notably, Flicek et al25 were able to reduce the dose by 50% in their study, in which they compared an STD supine set with an LD prone set with ASIR in a CT colonoscopy examination without degrading image quality.
We achieved different levels of noise reduction across the image plane. Noise measurements in the air revealed insignif-icant differences between the LD and STD groups. We found lower noise levels in the CSF of the LD group than of the STD group. However, unlike the above-mentioned studies, with these reduced levels of dose, WM measurements (noise and SNR) and visual scores of noise were better in the STD group. Our results were in concordance with those of Marin et al.26By using the noise power spectrum curve, they showed that the effect of ASIR on the noise reduction was more noticeable in the smoother areas than in the grainy areas. In light of these findings, we propose that less aggressive noise reduction (⬍30%) should be aimed at head CT examinations if keeping the noise at routine levels is desired. Because 97% (95/98) of the examinations in the LD group were considered fully or probably acceptable for diagnosis, we have kept using LD set-tings as our routine head CT protocol.
We observed better image sharpness scores in the STD group than in the LD group. Sagara et al8also reported the same finding without affecting the diagnostic acceptability. We attributed this to the oversmoothing effect of ASIR as well as to the noise. At higher levels of ASIR, contours of structures begin to blur and sharpness decreases.6Even if we chose a low ASIR percentage (30%), we could not prevent the sharpness from degrading.
Minor artifacts seen in both groups were expected such as beam-hardening artifacts at the posterior fossa. Higher tube settings were used in the posterior fossa to decrease the mag-nitude of artifacts. We did not observe any artifacts in either group that made interpretation impossible.
Table 1: Dose parameters
Mean Parameter STD Group LD Group P
CTDIvolposterior fossa (mGy) 93.49⫾2.26 69.14⫾1.48 ⬍.001
CTDIvolcerebrum (mGy) 59.40⫾1.44 38.55⫾0.83 ⬍.001
[image:3.594.51.286.143.257.2]No. of images 39.5⫾2.5 39.8⫾2.7 .470 DLP (mGy⫻cm) 1081.28⫾66.57 748.61⫾51.78 ⬍.001 Effective dose (mSv) 2.3⫾0.1 1.6⫾0.1 ⬍.001
Table 2: Quantitative and qualitative measures
Mean Measure STD Group LD Group P
There are limitations to our study. First, we disregarded patients with images with severe artifacts caused by foreign bodies, metallic surgical materials, and movement of the head, which might have also been compared. They were too small in number for a healthy comparison to be made; thus, larger
series are needed. Second, we used a small region of interest (60 mm2 for air and 40 mm2 for WM). This could not be prevented because of a lack of space in and around the cra-nium. Therefore, to overcome this, we made measurements on 3 consecutive sections and averaged them. Third, we did
Fig 1.Axial images of a 34-year-old woman with normal findings at the level of the posterior fossa (A) and basal ganglia (B). The patient belongs to the LD group (DLP, 832 mGy⫻cm). Note that the WM and GM differentiation is decreased. This is 1 of the 2 examinations that are considered diagnostically acceptable only under limited conditions (score of 3 for diagnostic acceptability criterion).
[image:4.594.134.452.43.223.2] [image:4.594.132.453.266.628.2]not verify our results with different scanning and reconstruc-tion settings. Our findings should be validated on a head phantom and should be correlated with different detector configurations. Fourth, we did not assess the diagnostic accu-racy or the effect of ASIR on the different disease subgroups in this study. Larger prospective series are warranted for this. For the future studies, ASIR can be used in conjunction with other dose-reduction methods, such as automatic tube-current modulation. Smith et al5 proposed that automatic tube-current modulation could be used as an effective dose-reduction tool for head CT. Therefore, when incorporated with ASIR, more dose reduction would be possible. In addi-tion, although we did not assess the diagnostic accuracy or the effect of ASIR on the different disease subgroups in the present study with a limited sample size, we suggest that future studies in a larger sample might consider such further stratified analyses.
Conclusions
ASIR appears to reduce the dose in adult head CT examina-tions performed on a 16-section multidetector row CT scan-ner without compromising the diagnostic acceptability. While the effect of ASIR on the noise reduction observed in the pres-ent study of head CT is less than that reported previously in abdomen and chest CT, these findings encourage further pro-spective studies in larger patient samples.
References
1. Hall EJ, Brenner DJ.Cancer risks from diagnostic radiology.Br J Radiol
2008;81:362–78
2. Brenner DJ, Hall EJ.Computed tomography: an increasing source of radiation exposure.N Engl J Med2007;357:2277– 84
3. Gunn MLD, Kohr JR.State of the art: technologies for computed tomography dose reduction.Emerg Radiol2010;17:209 –18
4. Rogalla P, Kloeters C, Hein PA.CT technology overview: 64-slice and beyond.
Radiol Clin North Am2009;47:1–11
5. Smith B, Dillon WR, Gould R, et al.Radiation dose-reduction strategies for neuroradiology CT protocols.AJNR Am J Neuroradiol2007;28:1628 –32 6. Hara AK, Paden RG, Silva AC, et al.Iterative reconstruction technique for
reducing body radiation dose at CT: feasibility study.AJR Am J Roentgenol
2009;193:764 –71
7. Prakash P, Kalra MK, Kambadakone AK, et al.Reducing abdominal CT radia-tion dose with adaptive statistical iterative reconstrucradia-tion technique.Invest Radiol2010;45:202–10
8. Sagara Y, Hara AK, Pavlicek W, et al.Abdominal CT: comparison of low-dose CT with adaptive statistical iterative reconstruction and routine-low-dose CT with filtered back projection in 53 patients.AJR Am J Roentgenol
2010;195:713–19
9. Prakash P, Kalra MK, Ackman JB, et al.Diffuse lung disease: CT of the chest with adaptive statistical iterative reconstruction technique. Radiology
2010;256:261– 69
10. Prakash P, Kalra MK, Digumarthy SR, et al.Radiation dose reduction with chest computed tomography using adaptive statistical iterative reconstruc-tion technique: initial experience.J Comput Assist Tomogr2010;34:40 – 45 11. Yanagawa M, Honda O, Yoshida S, et al.Adaptive statistical iterative
recon-struction technique for pulmonary CT: image quality of the cadaveric lung on standard- and reduced-dose CT.Acad Radiol2010;17:1259 – 66
12. Heilbron BG, Leipsic J.Submillisievert coronary computed tomography an-giography using adaptive statistical iterative reconstruction: a new reality.
Can J Cardiol2010;26:35–36
13. Leipsic J, Labounty TM, Heilbron B, et al.Adaptive statistical iterative reconstruction: assessment of image noise and image quality in coronary CT angiography.AJR Am J Roentgenol2010;195:649 –54
14. Gosling O, Loader R, Venables P, et al.A comparison of radiation doses be-tween state-of-the-art multislice CT coronary angiography with iterative re-construction, multislice CT coronary angiography with standard filtered back-projection and invasive diagnostic coronary angiography. Heart
2010;96:922–26
15. American Association of Physicists in Medicine.The measurement, reporting, and management of radiation dose in CT: report of AAPM Task Group 23 of the Diagnostic Imaging Council CT Committee.AAPM report no. 96; 2008. http://www.aapm.org/pubs/reports/rpt_96.pdf. Accessed November 20, 2010 16. Mullins ME, Lev MH, Bove P, et al.Comparison of image quality between
conventional and low-dose nonenhanced head CT.AJNR Am J Neuroradiol
2004;25:533–38
17. Udayasankar UK, Braithwaite K, Arvaniti M, et al.Low-dose nonenhanced head CT protocol for follow-up evaluation of children with ventriculoperito-neal shunt: reduction of radiation and effect on image quality.AJNR Am J Neuroradiol2008;29:802– 06
18. Murakami Y, Kakeda S, Kamada K, et al.Effect of tube voltage on image quality in 64-section multidetector 3D CT angiography: evaluation with a vascular phantom with superimposed bone skull structures.AJNR Am J Neuroradiol
2010;31:620 –25
19. Bongartz G, Golding SJ, Jurik AG, et al, for the European Study Group of Radi-ologists and Physicists.European guidelines on quality criteria for computed tomography.EUR 16262 EN; 1999. http://www.drs.dk/guidelines/ct/quality/ mainindex.htm. Accessed November 20, 2010
20. Silva AC, Lawder HJ, Hara A, et al.Innovations in CT dose reduction strategy: application of the adaptive statistical iterative reconstruction algorithm.AJR Am J Roentgenol2010;194:191–99
21. Pontana F, Pagniez J, Flohr T, et al.Chest computed tomography using itera-tive reconstruction vs filtered back projection. Part 1. Evaluation of image noise reduction in 32 patients.Eur Radiol2011;21:627–35. Epub 2010 Nov 5 22. Pontana F, Duhamel A, Pagniez J, et al.Chest computed tomography using
iterative reconstruction vs filtered back projection. Part 2. Image quality of low dose CT examinations in 80 patients.Eur Radiol2011;21:636 – 43. Epub 2010 Nov 16
23. Bittencourt MS, Schimdt B, Seltman M, et al.Iterative reconstruction in image space (IRIS) in cardiac tomography: initial experience.Int J Cardiovasc Imag-ing2010 Dec 1. [Epub ahead of print]
24. Lee T, Chhem RK.Impact of new technologies on dose reduction in CT.Eur J Radiol2010;76:28 –35
25. Flicek KT, Hara AK, Silva AC, et al.Reducing the radiation dose for CT colonography using adaptive statistical iterative reconstruction: a pilot study.
AJR Am J Roentgenol2010;195:126 –31
[image:5.594.53.288.58.128.2]26. Marin D, Nelson RC, Schindera ST, et al.Low-tube-voltage, high-tube-current multidetector abdominal CT: improved image quality and decreased radia-tion dose with adaptive statistical iterative reconstrucradia-tion algorithm—initial clinical experience.Radiology2010;254:145–53
Table 3: Visual scores for readers 1 and 2
Mean of Criteria
Reader 1 Reader 2
STD Group LD Group STD Group LD Group