http://www.scirp.org/journal/tel ISSN Online: 2162-2086
ISSN Print: 2162-2078
A Study on Spatial Distribution and
Characteristics of Moving Companies
Dae Hyun Seo, Kabsung Kim
Yonsei University, Seoul, South Korea
Abstract
The purpose of this study is to propose a method of establishing demand zone in the estimation of industrial complex needs. Demand estimates of existing industrial complexes are mainly based on survey method, which leads to exces-sive or underestimated demand depending on the extracted samples. There-fore, it has been argued that there is a need to analyze what movements the companies actually show. In this study, based on the status of about 450,000 companies included in the Hankyung Business Yearbook, the company DB book in Korea, each company analyzed the movement and the moving area by city, and based on this, the O-D table was created. This study will empirically validate the previous demand of the enterprises and provide information re-lated to the establishment of the demand for the industrial complex in the fu-ture, which will contribute to the estimation of the actual demand of the in-dustrial complex.
Keywords
Industrial Complex, Industrial Land Use, Spatial Distribution of Companies, Characteristics of Companies, Company Movement
1. Introduction
One of the Key projects in local industrial policy is the creation of industrial complexes. So, the government has supplied them to fulfill the policy goals in order to achieve the national economic growth.
In Korea, there are many industrial complexes have been built since to 1960’s, and many of them were constructed by the government to achieve the govern-ment’s industrial upbringing policy. In the beginning, national economic envi-ronment is very poor in Korea, so it was necessary to concentrate national com-petence in some areas. For example, “A Special Act on Land Acceptance for the
How to cite this paper: Seo, D.H. and Kim, K. (2018) A Study on Spatial Distribution and Characteristics of Moving Companies. Theoretical Economics Letters, 8, 316-329. https://doi.org/10.4236/tel.2018.83022
Received: November 28, 2017 Accepted: February 8, 2018 Published: February 11, 2018
Copyright © 2018 by authors and Scientific Research Publishing Inc. This work is licensed under the Creative Commons Attribution International License (CC BY 4.0).
http://creativecommons.org/licenses/by/4.0/ Open Access
Creation of Industrial Zone” was enacted in 1962, “Act on the Development of industrial Complex for the Export Industry Development” was established in 1964. As a result, industrial complexes were established in the 1960s to foster export industries centered on light industry. On the other hand, in the 1970s, industrial parks were built around the Southeast region in accordance with the policies for the promotion of heavy chemical industry. After the 1980s, large scale industrial complexes were built around the backward regions to achieve balanced national development.
As we have seen in the previous case, industrial parks in Korea are the main means of achieving government policy goals. In addition to its role as a hub for fostering strategic industries that are the basis of national economic growth, it has played an important role in the development of national industries by inducing the growth of underdeveloped regions and alleviating regional gaps in growth. It seems to be further expanded.
However, current industrial parks in Korea are becoming less competitive due to the price of land, and demand and supply imbalances are not achieved due to the lack of actual demand for new industries. In particular, in order to estimate the demand for industrial complexes, we follow the existing methods that de-pend on the questionnaire. Therefore, there is a problem that the demand is un-der- or over-estimated. Estimation of demand in the development of industrial complex is a very important process because it is the basis for establishing the size of industrial land use supply. It is a time when theoretical and empirical re-search is needed.
2. Literature Reviews
2.1. Industrial Demand Estimation Theories
Demand estimates of industrial complex can be divided into quantitative me-thods and survey meme-thods. The quantitative meme-thods have the following models. The time series model is a method of predicts future trends based on observed patterns in the past time series. When the growth rate gradually decreases when there is an upper limit of the observed data and it increases by more than a cer-tain level, the modified index model, the Gompertz model, and the logistic mod-el are used. In the case of the smoothing method which linearized the variation of time series data and grasps future trends, simple exponential smoothing me-thod, linear moving average meme-thod, linear exponential smoothing meme-thod, and second exponential smoothing method are utilized. In addition, there are proba-bilistic time series models that probaproba-bilistically estimate future trends based on regular patterns of time series data, and AutoRegression (AR), Moving Average (MA), AutoRegression Moving Average (ARMA), and AutoRegression Integrated Moving Average (ARIMA) are mainly used.
The regression model estimates regression curves by using production func-tion or panel data and estimates industrial demand based on this. The regression model is complementary to the time series model because it estimates the
mand by reflecting the future economic structure. In the case of a multiple regres-sion model using production function, it is a method to estimate the demand by modeling the linear relationship between the predicted variable and the result variable, and it is a merit that various socioeconomic factors can be reflected in the model. In general, Cobb-Douglas production function is used to estimate the model based on the production function reflecting capital, labor, and land. The panel regression model can reflect both time and space factors at the same time, which is a good way to estimate regional demand.
In the case of basic unit model, it is a method to calculate the total demand area by reflecting the future production amount or the number of workers to the area of the site per unit of production or per worker. This is a method of esti-mating future demand based on the assumption that the amount of unit produc-tion and the area required for each worker exist. It is useful because it is simple to use and can reflect various analysis methods at the same time. Japan and the UK are using this method to estimate demand for industrial sites. In Japan, the use of unit method is applied based on the amount of production by industry in the target year, and in the UK, it is recommended to use the unit method based on the prospect of employment size.
The survey method collects the responses directly or indirectly using standar-dized questionnaires to the subjects selected by certain criteria, and draws con-clusions analyzing them. In Korea, the feasibility study method for estimating demand for industrial sites is set by law, and the questionnaire method is applied here. The sampling method of the questionnaire is using the allocation sampling, and the sampling frame uses the company information data.
2.2. Precedent Researches and Conclusion
In Korea, there are few studies related to the estimation of industrial complex demand, and most of them were analyzed using statistical data for empirical analysis. [1] estimated the real value added by analyzing the value-added projec-tions of industry and the factors affecting the future economic growth, and then derived the land supply coefficient by using industry value-added amount and land area based on this, Respectively. [2] examined the changes in the demand trends of the manufacturing industry according to the changes in the metropoli-tan area by using the mining and manufacturing statistics, and conducted a sur-vey of 440 manufacturing companies with 10 or more employees nationwide. Questionnaire survey was conducted to investigate the preference of location and the intention to expand or expand in the future. [3] estimated the empirical relationship between the industrial complex demand and the future demand based on the estimated coefficients, using the statistical data of the National Sta-tistical Office to predict the industrial complex demand. In order to forecast de-mand, we estimated the demand for future land area and estimated the probabil-ity of locating a particular area in the Seoul metropolitan area and the capital area using the binary logit model. [4] estimated the parameters by using the
panel cointegration relation between the industrial site and the production vo-lume for estimating the demand of the industrial land, and presented the de-mand forecast of the industrial land based on this. For this purpose, annual sta-tistics of site area and production amount by industry were utilized from 1982 to 2009.
In addition to the case of Korea, related research is as follows. [5] focuses on the determination of industrial and commercial land use in urban development, using a spatial data analysis method in the period of 2000-2010 in Beijing. In this study, exploring the impact of spatial independent variables on these two types of land use, using spatial logistic analysis. [6] aims to examine the influence of government and industrial agglomeration on industrial land prices by construct-ing hedonic pricconstruct-ing functions, usconstruct-ing 693 industrial land parcels from 2002 to 2006 provided by public sector and private developers. In [7], land use change dy-namics were investigated by the combined use of satellite remote sensing, Geo-graphic information systems (GIS), and stochastic modelling technologies in Zhu-jiang Delta of China.
In this way, it is found that the existing researches have made a lot of studies to predict demand statistically using statistical data in Korea. It can be said that it is useful in that it can save time and cost in estimating demand based on data and estimation process is reasonable, but it is inappropriate to reflect the move-ment of actual companies. On the other hand, studies using spatial data such as satellite images and GIS have been attempted in overseas studies. However, it is pointed out that these data are not easy to obtain and analysis is also in the ini-tial stage. Therefore, in this study, based on the actual company data, it is neces-sary to examine how far the companies moved in the area and where they moved, it is meaningful. Above all, this study can be said to be different from existing researches in that it can construct data that can substitute without using statis-tical data related to industry, and can carry out research on industrial transfer based on this.
3. Database Analysis
In this study, “Hankyung Company Overview” published by the Korea Economic Daily was used for setting the demand zone. The Hankyung Enterprise Overview is a corporate DB data set out to identify the current status and financial infor-mation of individual companies based on audit reports, financial reports, and company surveys of Korean companies held by the Financial Supervisory Service and NICE evaluation information. In this study, the change of the address of the company is described as the transfer of the company, and based on this, the transfer demand of the companies is grasped.
The data used in this study were obtained from the data for 7 years from 2011 to 2017, and the same company was examined through business number match-ing. The collected data were analyzed by data cleaning process. Data cleaning process was performed by extracting valid data that can be analyzed from the
entire data. It was based on the existence of the business number that can be con-firmed as the same company and the address information at the district level to identify whether the company was transferred. There are two problems occurred in this process. First, data is missing that can’t be confirmed as a company number or address is missing. In this case, the data of the company without the business number was deleted. In the case of the data without address in 2017, the business information was searched by using the business number, and the con-firmed address information was directly inputted to the city district level.
Second, there were some areas where the address system changed partly due to the change of administrative districts, including Changwon City, Cheongju City and Sejong City. In the case of Changwon City and Cheongju City, the pre-vious administrative area was changed to the changed administrative area. On the other hand, in case of Sejong City, in addition to the whole of Yeongi Gun, some of Gongju City and Cheongwon Gun are included. In this study, Yeongi Gun was included.
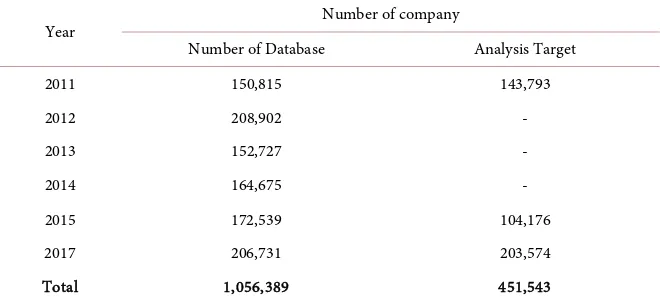
For reference, address information was extracted to the city district level. Therefore, if the company moves within the municipal district, it is not identi-fied as the company movement. In addition, it should be noted that former in-formation was handled only at the metropolitan level. The current status of the company subject to analysis is as follows. About 1.05 million companies have been acquired through the DB, and 451,543 data with business number and ad-dress information (Table 1).
According to the data of the National Statistical Office in Korea, the total num-ber of company in 2015 is about 3.87 million, and regional distribution between analyzed data and statistical data are as follows (Table 2).
[image:5.595.208.538.559.710.2]In order to test whether the analytical data reflects the present status of statis-tical distribution, we conducted a paired t-test and confirmed that the null hy-pothesis that the two groups are equal at the 1% significance level cannot be re-jected. Therefore, it can be seen that the data used in this study reflects the dis-tribution of actual companies to some extent (Table 3 and Table 4).
Table 1. Number of company.
Year Number of company
Number of Database Analysis Target
2011 150,815 143,793
2012 208,902 -
2013 152,727 -
2014 164,675 -
2015 172,539 104,176
2017 206,731 203,574
Total 1,056,389 451,543
Source: The Korea economic daily, Hankyung company overview (2011-2017).
Table 2. Spatial distribution of company.
Region Analytical data Statistical data
2011 2015 2017 Total % 2015 %
Gangwon-do 3083 2028 4232 9343 2.07 133,517 3.45 Gyeonggi-do 29,382 23,069 47,485 99,936 22.13 827,983 21.37 Gyeongsangnam-do 9590 6735 12,161 28,486 6.31 262,950 6.79
Gyeongsangbuk-do 5768 4455 8649 18,872 4.18 218,796 5.65 Gwangju 4375 4936 8384 16,902 3.74 113,424 2.93 Daegu 4472 4143 6143 13,364 2.96 200,070 5.16 Daejeon 3416 2560 5287 11,263 2.49 111,815 2.89 Busan 8937 6233 11,014 26,184 5.80 278,850 7.20 Seoul 46,295 29,937 56,199 132,431 29.33 820,658 21.18
Sejong 262 372 824 1458 0.32 10,480 0.27
[image:6.595.207.539.449.507.2]Ulsan 2898 2258 3987 9143 2.02 80,805 2.09 Incheon 5829 4113 8413 18,355 4.06 186,011 4.80 Jeollanam-do 5499 4896 9450 19,845 4.39 147,198 3.80 Jeollabuk-do 4159 2987 6154 13,300 2.95 146,654 3.79 Jeju-do 1348 1191 2339 4878 1.08 55,155 1.42 Chungcheongnam-do 4560 3596 7109 15,265 3.38 158,308 4.09 Chungcheongbuk-do 3920 2854 5744 12,518 2.77 121,493 3.14 Total 143,793 106,363 203,574 451,543 100.0 3,874,167 100.0 Source of statistical data: national statistical office in Korea, census on establishments (2015).
Table 3. Paired samples statistics.
Variable Mean N Std. Deviation Std. Error Mean
D_Data 26,561.3529 17 34,883.79272 8460.56247 D_Stat 227,892.1756 17 234,709.2912 56,925.36464
Table 4. Paired t-test between analytical data and statistical data.
Variable t df Sig. (p)
D_Data - D_Stat −4.133 16 0.001
4. Results
Of the 451,543 companies surveyed, 20,670 were transferred to the companies iden-tified through address information. Seoul is the region with the highest number of moving in and out companies (Table 5).
4.1. Results from the Region Side
In Table 5, Seoul (R9) is the region with the largest number of companies
mov-ing. In terms of business inflows, Seoul has superior industrial infrastructures than other regions. In Table 2, 20% of the national enterprises are located in Seoul and
[image:6.595.206.538.540.571.2]Table 5. O-D table about moving company (region level).
Moving out
Moving in
R1 R2 R3 R4 R5 R6 R7 R8 R9 R10 R11 R12 R13 R14 R15 R16 R17 Total
R1 119 34 5 8 - 2 1 4 14 4 1 4 8 12 3 5 9 233
R2 71 2408 30 42 26 25 30 28 579 18 8 204 43 41 18 193 110 3874
R3 16 29 406 44 6 7 3 160 25 3 26 1 24 12 16 17 15 810
R4 3 40 18 254 4 87 3 15 36 2 25 6 11 8 4 22 7 545
R5 1 18 2 3 554 1 4 2 21 11 5 2 197 20 2 3 2 848
R6 2 26 13 153 2 412 8 6 21 1 1 1 4 2 2 3 657
R7 3 24 8 3 2 8 370 4 35 45 2 2 6 7 2 63 22 606
R8 2 17 166 12 3 5 1059 43 1 19 3 9 8 5 3 1 1356
R9 57 1939 34 50 25 17 29 59 5656 10 14 137 33 32 23 76 49 8240
R10 1 10 2 4 2 10 2 3 5 5 36 16 96
R11 1 6 12 32 1 18 12 301 2 1 1 2 3 3 395
R12 10 301 5 5 4 2 5 2 86 10 462 7 8 2 40 16 965
R13 3 36 11 10 148 2 1 14 23 11 2 4 508 33 6 10 4 826
R14 3 23 6 4 14 5 8 13 8 1 5 23 262 4 13 1 393
R15 4 12 2 1 1 5 2 2 1 3 1 17 1 52
R16 5 80 11 8 3 5 28 2 30 56 5 10 15 20 3 170 30 481
R17 6 45 13 13 3 3 18 33 30 1 2 3 6 2 15 100 293
Total 307 5048 742 643 796 577 520 1382 6634 212 413 849 900 478 111 673 385 20,670
Notes: R1 (Gangwon-do), R2 (Gyeonggi-do), R3 (Gyeongsangnam-do), R4 (Gyeongsangbuk-do), R5 (Gwangju), R6 (Daegu), R7 (Daejeon), R8 (Busan), R9 (Seoul), R10 (Sejong), R11 (Ulsan), R12 (Incheon), R13 (Jeollanam-do), R14 (Jeollabuk-do), R15 (Jeju-do), R16 (Chungcheongnam-do), R17 (Chung-cheongbuk-do).
30% of the analyzed companies. So, it is highly probable that agglomeration economy from the transfer company will occur. In addition, Korea’s major con-glomerates are headquartered in Seoul, and have higher education institutions such as universities. Therefore, it is advantageous for the exchange of knowledge and talent to improve the competence of the company, and the possibility of in-novation is higher than other regions.
On the other hand, in terms of corporate outflow, Seoul has high fixed costs due to high land prices and high labor costs. In addition, the Seoul metropolitan area is limited in terms of business expansion, and in the case of other attempts, various supports are provided for attracting companies, so that it can be said that the economic incentives for transferring the business are sufficient. The fact that there are many corporations is also one of the reasons why the number of absolute outflow companies is analyzed.
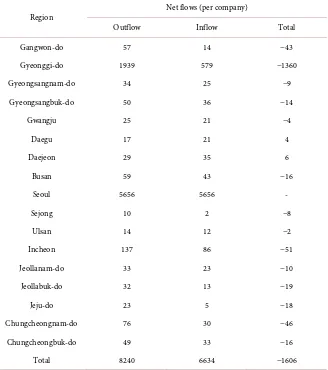
When the data were reviewed, a total of 6634 companies moved from other re-gions and 8240 companies moved to other rere-gions. According to the data, it was analyzed that the net outflow of 1606 occurred in Seoul during the period.
The net outflows of companies in most of the regions were found to be Gyeong-gi-do, which was the largest in the region, and the outflows were also found in Incheon, Gangwon-do and Chungcheongnam-do. On the other hand, Daegu and Daejeon showed some net inflows. These results demonstrate that the effect of the regional dispersion policy of the government was successful in Seoul, but the effect is limited because most companies moved to Gyeonggi-do. On the other hand, Gangwon-do and Chungcheongnam-do seem to have succeeded in attract-ing companies in the metropolitan area. It seems that the two regions are adja-cent to the metropolitan area, and the transportation and industrial infrastruc-tures are improved by local policy support (Figure 1, Table 6).
Gangnam-gu is the largest number of company moving district, and 70.9% of the total outflow companies and 80.4% of the total inflow companies are moving in Seoul. The spatial distribution of the former companies in Gangnam-gu is as follows (Figure 2, Table 7).
4.2. Results from the High-Growth Company
In Korea, policy support is provided to companies with high growth potential. To this end, we set up high-growth companies, which are enterprises with more than 10 employees and an increase in sales or employees by an average of more than 10% a year.
In this study, we examined the current state of high-growth companies. In 2015-2017, the number of enterprises that meet the standards of high-growth com-panies among the previous comcom-panies is 1734, which is almost 8.4% of the total number of moving companies (Table 8).
[image:8.595.210.537.512.706.2]In Seoul (R9), the number of high-growth companies was also higher, and the number of outflows to Gyeonggi-do was relatively high. On the other hand, out-flows to other regions were not so high. Figure 3 shows the regional distribution of high-growth companies moving in Seoul. Compared with Figure 1, which
Figure 1. Net flows in Seoul (region level).
Figure 2. Net flows in Gangnam-gu (district level).
Figure 3. Net flows in Seoul high-growth company (region level).
shows the regional distribution of the entire moving companies, it is more evi-dent that most of the companies which is moving from Seoul were moving within the Seoul metropolitan area.
For high-growth firms, it is important to find a location where they can easily acquire knowledge and labor, and the location requirements of the metropolitan area adjacent to the commodity market are very favorable (Table 9).
5. Conclusions
The cause of economic development in East Asia including Korea is various fac-tors, but it is known that the role of government has contributed in part [8]. Since the 1990s, the goal of economic development policy in Korea is balanced devel-opment of the region, and company relocation is an important element of the policy. Therefore, looking at the spatial distribution of moving company is the first step in examining how the effect of the policy can be.
Table 6. Company movement in Seoul (region level).
Region Net flows (per company)
Outflow Inflow Total
Gangwon-do 57 14 −43
Gyeonggi-do 1939 579 −1360
Gyeongsangnam-do 34 25 −9
Gyeongsangbuk-do 50 36 −14
Gwangju 25 21 −4
Daegu 17 21 4
Daejeon 29 35 6
Busan 59 43 −16
Seoul 5656 5656 -
Sejong 10 2 −8
Ulsan 14 12 −2
Incheon 137 86 −51
Jeollanam-do 33 23 −10
Jeollabuk-do 32 13 −19
Jeju-do 23 5 −18
Chungcheongnam-do 76 30 −46
Chungcheongbuk-do 49 33 −16
Total 8240 6634 −1606
This study analyzes company data to establish a demand zone for estimating industrial complex demand, and based on this data, O-D tables for city and dis-trict are prepared. In the analysis, we examined how the regional characteristics appear in the O-D Table results. The purpose of this study is to set the demand impact area for each city and district based on the prepared O-D Table. As with estimating housing demand, estimating demand for industrial complexes by set-ting impact zones will contribute to supplemenset-ting exisset-ting quantitative methods and surveys.
In this study, spatial migration of firms occurred in the metropolitan area, and migration to other regions was partially transferred to neighboring areas such as Gangwon-do and Chungcheongnam-do. Especially, for companies with high growth potential, the movements in the metropolitan area were more prominent. It is more important to create a favorable environment for business activities rather than policy incentives, so creating an industrial infrastructure within the region will be most important.
This study concludes that the level of reviewing the limitations of existing
Table 7. Company movement in Gangnam-gu (district level).
District (Gu) Net flows (per company)
Outflow Inflow Total
Seocho 361 319 −42
Sungdong 160 38 −122
Songpa 145 75 −70
Jung 105 76 −29
Youngdeungpo 61 45 −16
Geumchun 57 36 −21
Mapo 56 58 2
Yongsan 45 36 −9
Guro 41 26 −15
Jongro 32 33 1
Gangdong 27 18 −9
Gangjin 24 25 1
Ganak 14 10 −4
Gangseo 12 12 0
Dongdaemun 11 14 3
Dongjak 9 7 −2
Sungbuk 9 8 −1
Seodaemun 7 12 5
Dobong 6 2 −4
Yangchun 6 5 −1
Jungrang 6 3 −3
Nowon 5 5 0
Gangbuk 3 3 0
Enpyung - 10 10
Others 494 214 −280
Total 1696 1090
industrial complex demand estimation methods and presenting the O-D table on the demand zone setting for improvement of future demand estimation me-thod.
The most difficult point in industrial research is the availability of useful sta-tistical data. In academic research, this study is very useful in that it can acquire company transfer information by only annual data on company basic status. If we can study the changes in the distribution and characteristics of industries in
Table 8. O-D Table about moving company—high-growth company (region level).
Moving out
Moving in
R1 R2 R3 R4 R5 R6 R7 R8 R9 R10 R11 R12 R13 R14 R15 R16 R17 Total
R1 10 5 - - - 2 - - - - 1 - - - 18
R2 9 232 2 7 4 4 1 9 52 4 - 20 3 4 2 20 12 385
R3 - - 31 - 2 - 2 15 4 2 2 - 3 1 1 2 2 67
R4 - 1 2 23 - 11 - 2 4 - 4 - - - 1 3 1 52
R5 - 3 - - 41 - - - - 3 - - 35 2 - 2 - 86
R6 - 1 - 11 - 31 - - 2 - - - 45
R7 - 3 3 - - 1 36 - 5 9 - - - 7 2 66
R8 - 4 16 2 - 1 - 87 2 - 2 - 1 - - - - 115
R9 11 109 - 4 - 1 2 2 405 1 2 10 5 4 1 3 5 565
R10 - 2 - - 2 - 1 - - - - 2 2 1 - 6 2 18
R11 - - 1 6 - - - 3 - - 21 - - - 31
R12 2 27 - 1 - - 1 - 8 - - 33 - 1 1 5 1 80
R13 - 2 - - 20 1 - 2 1 - - - 59 3 - 1 - 89
R14 - 4 - 1 1 - - - 2 - - - 4 19 - 1 - 32
R15 - 1 - - - 2 - - 3
R16 - 7 - - - 2 2 - 5 2 1 - 3 2 1 31 1 57
R17 - 3 1 1 - - 3 - 1 3 - - - 1 - 2 10 25
Total 32 404 56 56 70 52 48 120 493 24 32 65 115 39 9 83 36 1734
Notes: R1 (Gangwon-do), R2 (Gyeonggi-do), R3 (Gyeongsangnam-do), R4 (Gyeongsangbuk-do), R5 (Gwangju), R6 (Daegu), R7 (Daejeon), R8 (Busan), R9 (Seoul), R10 (Sejong), R11 (Ulsan), R12 (Incheon), R13 (Jeollanam-do), R14 (Jeollabuk-do), R15 (Jeju-do), R16 (Chungcheongnam-do), R17 (Chung-cheongbuk-do).
the region through the basic data of the companies, it will be able to complement the existing survey methods for enterprise research and statistics generation. In the practical social area, this study can contribute to the demand estimation of industrial sites for regional development and the achievement of the policy goal of regional industrial development. From the viewpoint of balanced regional development, it will be possible to provide the transfer demand of the enterpris-es, and thus provide the basis for establishing policies such as the creation or remodeling of industrial complexes. If we complement the various characteris-tics of the enterprise, it can be used as a basic data for understanding and pre-dicting the overall trend of the inter-regional or inter-country industry. In future research, we will find out how the movement of industry is different according to industry and scale, and contribute to the actual demand estimation for future
Table 9. Company movement in Seoul—high-growth company (region level).
Region Net flows (per company)
Outflow Inflow Total
Gangwon-do 11 2 −9
Gyeonggi-do 109 52 −57
Gyeongsangnam-do - 4 4
Gyeongsangbuk-do 4 4 -
Gwangju - - -
Daegu 1 2 1
Daejeon 2 5 3
Busan 2 2 -
Seoul 405 405 -
Sejong 1 - −1
Ulsan 2 - −2
Incheon 10 8 −2
Jeollanam-do 5 1 −4
Jeollabuk-do 4 2 −2
Jeju-do 1 - −1
Chungcheongnam-do 3 5 2
Chungcheongbuk-do 5 1 −4
Total 565 493 −72
industrial parks such as high-tech industrial complexes.
References
[1] Kim, H.B. and Choi, J.S. (2010) Forecasting Regional and Industrial Land Demand: The Case of Korea. Journal of the Korean Urban Management Association, 23, 215-236.
[2] Lee, H.J. and Kim, M.S. (2011) The Variation of Industrial Location Demand by Changing Policy of Seoul Metropolitan Area. Journal of the Economic Geographical Society of Korea, 14, 286-306. https://doi.org/10.23841/egsk.2011.14.3.286
[3] Cho, K.Y., Park, H.S. and Jung, I.H. (2008) A Study on the Forecast of Industrial Land Demand and the Location Decision of Industrial Complexes—In Case of An-seong City. Journal of Korean Society of Rural Planning, 14, 37-51.
[4] Park, J.K. and Bun, C.W. (2013) Forecasting the Size of the Industrial Land Em-ploying the Panel Co-Integration Relationship. Korea Review of Applied Econom-ics, 15, 73-101.
[5] Sun, C., et al. (2016) Urban Land Development for Industrial and Commercial Use: A Case Study of Beijing. Sustainability, 8, 1-18. https://doi.org/10.3390/su8121323
[6] Lin, S.-W. and Ben, T.-M. (2009) Impact of Government and Industrial
tion on Industrial Land Prices: A Taiwanese Case Study. Habitat International, 33, 412-418. https://doi.org/10.1016/j.habitatint.2009.01.001
[7] Weng, Q. (2002) Land Use Change Analysis in the Zhujiang Delta of China Using Satellite Remote Sensing, GIS and stochastic Modelling. Journal of Environmental Management, 64, 273-284. https://doi.org/10.1006/jema.2001.0509
[8] Ko, Y.S. (2008) Korea’s Economic Growth and Government’s Role: Past, Present and Future. Korea Development Institute, Sejong, 143-145.