ORIGINAL RESEARCH
PEDIATRICS
Voxel-Based Morphometry and fMRI Revealed Differences in
Brain Gray Matter in Breastfed and Milk Formula–Fed Children
X X. Ou, XA. Andres, XR.T. Pivik, XM.A. Cleves, XJ.H. Snow, XZ. Ding, and XT.M. Badger
ABSTRACT
BACKGROUND AND PURPOSE: Infant diets may have significant impact on brain development in children. The aim of this study was to evaluate brain gray matter structure and function in 8-year-old children who were predominantly breastfed or fed cow’s milk formula as infants.
MATERIALS AND METHODS: Forty-two healthy children (breastfed:n⫽22, 10 boys and 12 girls; cow’s milk formula:n⫽20, 10 boys and 10 girls) were studied by using structural MR imaging (3D T1-weighted imaging) and blood oxygen level– dependent fMRI (while performing tasks involving visual perception and language functions). They were also administered standardized tests evaluating intelligence (Reynolds Intellectual Assessment Scales) and language skills (Clinical Evaluation of Language Fundamentals).
RESULTS: Total brain gray matter volume did not differ between the breastfed and cow’s milk formula groups. However, breastfed children had significantly higher (P⬍.05, corrected) regional gray matter volume measured by voxel-based morphometry in the left inferior temporal lobe and left superior parietal lobe compared with cow’s milk formula–fed children. Breastfed children showed signif-icantly more brain activation in the right frontal and left/right temporal lobes on fMRI when processing the perception task and in the left temporal/occipital lobe when processing the visual language task than cow’s milk formula–fed children. The imaging findings were associated with significantly better performance for breastfed than cow’s milk formula–fed children on both tasks.
CONCLUSIONS: Our findings indicated greater regional gray matter development and better regional gray matter function in breastfed than cow’s milk formula–fed children at 8 years of age and suggested that infant diets may have long-term influences on brain develop-ment in children.
ABBREVIATIONS:BF⫽breastfed; CELF-4⫽Clinical Evaluation of Language Fundamentals, Fourth Edition; IQ⫽intelligent quotient; MF⫽cow’s milk formula-fed; RIAS⫽Reynolds Intellectual Assessment Scales; VBM⫽voxel-based morphometry
T
he World Health Organization recommends exclusive breast-feeding, which has been associated with better school perfor-mance and neurocognitive development in children by multiple studies.1-5 When breastfeeding is not possible or not chosen, cow’s milk formula has been frequently the formula of choice. Milk formula is made with bovine milk protein, and while theamino acid composition is similar to that of human breast milk, there are differences in the overall composition of milk formula and human breast milk. It is possible that these differences can impact the developing brain and therefore contribute to the ob-served long-term benefits on neurodevelopment associated with breastfeeding. In fact, studies are beginning to appear showing an association between breastfeeding and better development in brain structures, such as increased white matter volume, greater cortical thickness, and increased microstructural integrity and myelin water fraction in white matter.6-9
Rapid advances of neuroimaging methods10have made possi-ble more comprehensive evaluation of brain development in chil-dren. For example, regional gray matter volume measured by MR imaging voxel-based morphometry (VBM) provides a whole-brain region-specific evaluation of the deep gray matter and whole-brain cortex.11Gray matter consists mostly of neuronal cell bodies that generate and process nerve signals underlying brain function. Nu-merous VBM studies have revealed abnormal gray matter in dif-Received July 10, 2015; accepted after revision September 10.
From the Arkansas Children’s Nutrition Center (X.O., A.A., R.T.P., M.A.C., T.M.B.) and Departments of Pediatrics (X.O., A.A., R.T.P., M.A.C., J.H.S., T.M.B.) and Radiology (X.O.), University of Arkansas for Medical Sciences, Little Rock, Arkansas; and Van-derbilt University Institute of Imaging Sciences (Z.D.), Nashville, Tennessee. This work was funded by US Department of Agriculture/Agricultural Research Ser-vice 6251-51000-005-02.
Please address correspondence to Xiawei Ou, PhD, One Children’s Way, Slot 105, Little Rock, AR 72202; e-mail: [email protected]
Indicates open access to non-subscribers at www.ajnr.org Evidence-Based Medicine Level 2.
ferent brain regions in children with a variety of neurodevelop-mental or psychological disorders.12-14VBM analysis of infant diet effects has not been previously reported, to our knowledge. However, other dietary factors, such as breakfast composition, have shown effects on regional gray matter volume in children.15 Dietary effects on brain gray matter revealed by structural MR imaging may be complemented by measures of brain functioning obtained by using fMRI. Currently, there is a lack of literature on the use of fMRI to study differences in brain functioning associ-ated with infant diets. For example, although breastfeeding has been associated with better receptive and expressive language de-velopment in children16and longer breastfeeding duration was associated with higher receptive language scores at 3 years of age and with higher verbal intelligence quotient (IQ) at 7 years of age,17 it is not known whether fMRI procedures would reveal diet-specific effects during brain processing on language tasks in children fed different diets as infants.
The aim of this study was to evaluate brain gray matter struc-ture and function in 8-year-old healthy children who were fed predominantly breast milk (BF) or cow’s milk formula (MF) dur-ing the first year of life. We hypothesized that breastfeeddur-ing ben-efits brain gray matter development and functioning in children. To test this hypothesis, we compared VBM measures of regional gray matter volume and fMRI measures of brain activation when performing visual perception and language tasks between BF and MF children. Measures of fMRI task performance and overall IQ and language skills were also compared between groups.
MATERIALS AND METHODS
Participants
Healthy 7.5– 8.5-year-old children who had parental report of predominant breast milk or cow’s milk-based formula feeding during infancy were recruited for this study. All procedures were approved by the University of Arkansas for Medical Sciences re-view board. Assents and consents were obtained from the partic-ipants and their parents. BF infants were all exclusively breastfed for at least 8 months (average, 12.6 months). MF infants were fed the same type of cow’s milk– based formula after birth for at least 8 months. Infants were introduced to complementary foods on average around 5 months of age. All participants were right-handed and born full-term with birth weight between the fifth and 95th percentiles. None had a medical history of psychologi-cal/psychiatric diagnoses or neurologic impairment or injury. In addition, none of their mothers reported alcohol, tobacco, drug, or psychotropic medications use during pregnancy. All partici-pants underwent an MR imaging examination including a struc-tural scan and an fMRI study. After we excluded those who did not complete the MR imaging scan or had excessive motion and apparent imaging artifacts, valid structural imaging data were ob-tained for 42 children (BF:n⫽22, 10 boys, 12 girls; MF:n⫽20, 10 boys, 10 girls), and all except 1 MF girl had valid fMRI data. Participants were administered the Reynolds Intellectual Assess-ment Scales (RIAS) test, which measures verbal, nonverbal, and composite IQ, and the Clinical Evaluation of Language Funda-mentals (CELF-4) test, which measures receptive, expressive, and overall language abilities. The RIAS and CELF-4 tests were super-vised by a licensed pediatric psychological examiner. In addition,
we were able to obtain family background information, including parents’ education and income, for 26 subjects (12 MF and 14 BF children). The demographic information, family background, and test scores for all subjects are listed inTable 1.
MR Imaging Protocol
All MR imaging scans were performed on a 1.5T Achieva scanner (Philips Healthcare, Best, the Netherlands) with a 60-cm bore size, 33-mT/m gradient amplitude, and 100-mT/m/ms maximum slew rate at our institution. The built-in body coil was used as a transmitter, and a standard 8-channel sensitivity encoding head coil was used as a receiver. Imaging sequences included a sagittal T1-weighted 3D turbo field echo sequence for structural MR im-aging with the following parameters: TR, 7.3 ms; TE, 3.4 ms; flip angle, 8°; acquisition voxel size, 1⫻1⫻1 mm; matrix size, 256⫻ 232⫻150; 2 averages; scan time,⬃7 minutes; and an axial single-shot gradient-echo-planar imaging sequence for functional MR imaging with the following parameters: TR, 3000 ms; TE, 50 ms; flip angle, 90°; acquisition voxel size, 2.4⫻2.4⫻5 mm; matrix size, 92⫻92⫻20; 208 dynamic scans; 2 dummy scans; scan time, ⬃10 minutes.
Structural MR Imaging Data Processing
[image:2.594.301.533.63.260.2]The raw T1-weighted 3D images were exported to a workstation with Matlab software (MathWorks, Natick, Massachusetts) for VBM analysis. The VBM8 toolbox for statistical parametric map-ping (SPM8; http://www.fil.ion.ucl.ac.uk/spm/software/spm8) was used. A pediatric T1 template (⬃8 years of age) and custom-ized tissue probability maps were created on the basis of Nation-al Institutes of HeNation-alth data by the Template-O-Matic toolbox (https://irc.cchmc.org/software/tom/agreement.php),18 and the T1 images were then segmented into gray matter, white matter, and CSF by VBM8 by using default parameters. Nonlinear mod-ulated normalized gray matter images were generated that enable analysis of relative differences in regional gray matter volume, corrected for individual brain size. The images were displayed and
Table 1: Demographic information, family background, and test scores of the study participants
BF MF PValue
Demographics
No. (boys/girls) for VBM 22 (10/12) 20 (10/10) Birth weight (kg) 3.5⫾0.4 3.4⫾0.5 .47
Weight (kg) 27.8⫾6.3 27.5⫾5.5 .98
Height (cm) 128⫾5 129⫾4 .25
BMI 17.0⫾3.4 16.5⫾2.6 .62
Age at MRI (yr) 7.98⫾0.29 7.95⫾0.25 .71 Family background
Mother’s educationa(%) 35.7/42.9/21.4 8.3/50/41.7 .24
Father’s educationa(%) 35.7/50/14.3 33.3/58.3/8.3 .99
Household incomeb(%) 21.4/57.1/21.4 0/41.7/58.3 .08
Test scores
Verbal IQ 110⫾16 107⫾17 .50
Nonverbal IQ 111⫾13 114⫾16 .73
Composite IQ 111⫾13 110⫾15 .68
CELF-4 (receptive) 104⫾11 100⫾15 .45 CELF-4 (expressive) 108⫾10 104⫾12 .33
CELF-4 (overall) 104⫾12 100⫾15 .41
Note:—BMI indicates body mass index.
a
High school or partial college/college graduate/graduate school.
b⬍
reviewed to ensure that segmentation and normalization proce-dures worked properly and were then smoothed by using a Gauss-ian kernel of full width at half maximum, 8 mm in each direction. The smoothed gray matter images were used for the subsequent voxelwise statistical analysis between the BF and MF groups. Al-though there were no significant sex or age differences between groups, sex and age were included as covariates in the VBM anal-ysis because the brain is still developing at 8 years of age and there are possible sex differences in the human brain.19
fMRI Protocol
All participants were trained before the fMRI study to perform the perception and language tasks. The tasks were adopted from the literature20with modifications regarding timing and design and incorporated into an fMRI paradigm designed on E-Prime soft-ware (Psychology Softsoft-ware Tools, Pittsburgh, Pennsylvania). For the perception task, the participants were requested to determine whether 2 symbols on the screen (ie, ⁄) matched those presented on the previous screen (eg, , / /,/). For the language task, par-ticipants were requested to determine whether 2 words presented on 1 screen after another rhymed. A block design consisting of 8 perception blocks and 8 language blocks alternating with each other was used for the fMRI. Each block included 9 trials, and each trial included presentation of symbols (perception block) or words (rhyming block) followed by a 2000-ms interval during which the participants were to make responses by pressing either the “yes” or “no” key on a touchpad of an Eloquence fMRI system (Invivo, Gainesville, Florida).
fMRI Data Processing
Gradient-echo EPI acquired during fMRI examinations was ex-ported to a workstation with BrainVoyager software (Brain Inno-vation, Maastricht, the Netherlands) for fMRI data processing. Cubic spline interpolation was used for slice scan time correction. Images from the first dynamics were used as a reference, and translation and rotation of images in subsequent dynamics were plotted in all directions to illustrate motion. Trilinear estimation and interpolation were used for 3D-motion correction. An 8-mm full width at half maximum Gaussian filter was used for spatial smoothing. Linear trend removal and a high-pass filter with 3 cycles/points were used for temporal filtering. The T1-weighted 3D images were also exported to BrainVoyager to create an ana-tomic image series, and the processed fMRI was coregistered to the anatomic images automatically. The 3D dataset with anatomic images and fMRI information was then transformed to the Ta-lairach atlas to create a 3D-aligned time course dataset. A stimu-lation protocol was then created in BrainVoyager to represent the block design (with hemodynamic response function refinement) used in the fMRI scans. General linear model analysis was per-formed to calculate activation maps for the 3D-aligned time course dataset for each subject. The average activation maps for each diet group were calculated by a multistudy multisubject gen-eral linear model. The total activation cluster size in each brain lobe that exhibited activation at a statistical threshold ofP⬍.001 corrected was calculated for each subject and compared between groups. In addition, task performance parameters, such as the percentage of responses and the percentage of correct answers
made within the allocated time interval in each trial, were also compared between groups.
Statistical Analysis
For comparisons of demographic parameters, IQ and language test scores, total gray matter volume, and fMRI task performance parameters among groups, Wilcoxon rank sum tests were used for significant differences (P⬍.05). Comparison of other non-nu-meric family background parameters were made by using the Fisher exact test. For the VBM comparisons of regional gray mat-ter volume among groups,P⬍.001 uncorrected with a cluster size threshold of 30 voxels was used to illustrate overall differ-ences, andP⬍.05 (family-wise error– corrected cluster level) was used to determine regions with significantly different regional gray matter volumes. Sex and age were included as covariates for all analyses. For the calculation and illustration of average fMRI activation maps in each group, the statistical threshold was set at
P⬍.001 after Bonferroni correction for multiple comparisons and the cluster size threshold was set at 30 voxels. For the statisti-cal comparison of fMRI activation cluster size between groups,
P⬍.001 after Bonferroni correction (for the activation maps) was used to calculate total cluster size in each brain lobe in each sub-ject, and Wilcoxon rank sum tests were used to determine signif-icant differences (P⬍.05) between groups.
RESULTS
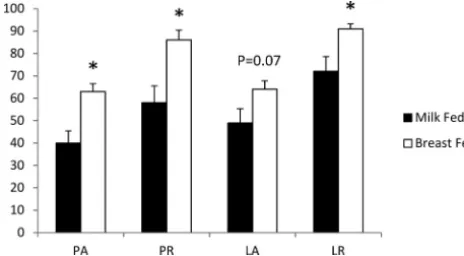
The weight, height, body mass index, and age at MR imaging were not different between the BF and MF children (Table 1). The family background parameters were also not different between groups. The RIAS IQ and CELF-4 scores did not differ between BF and MF. However, BF children performed better on both fMRI tasks, as indicated by the percentage of responses made within the designated time interval and the percentage of correct answers (Fig 1) in which BF and MF children differed significantly on 3 of the 4 measures.
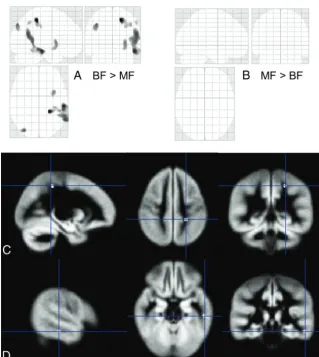
Total gray matter volume (763⫾65 cm3and 761⫾78 cm3for the BF and MF children, respectively) did not differ between groups. However, BF children had higher regional gray matter volume than MF children in multiple brain regions (Fig 2). Spe-cifically, at a statistical threshold ofP⬍.001 (uncorrected) with a cluster size of ⱖ30 voxels, regional gray matter volume was
[image:3.594.303.535.48.176.2]greater for BF than MF children in the left and right parietal and left temporal lobes (Fig 2A), while there were no regions with lower gray matter volume (Fig 2B). At a statistical threshold of
P⬍.05 (family-wise error– corrected), 1 region in the left
supe-rior parietal lobe (Fig 2C) and 1 region in the left inferior tem-poral lobe (Fig 2D) had significantly higher gray matter vol-ume in BF than MF children, and no region had lower gray matter volume.
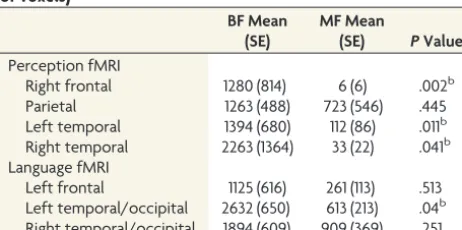
Average fMRI activation maps for the perception task (Fig 3; P ⬍ .001, Bonferroni-corrected cluster size ofⱖ30 voxels) showed widespread activation in the left and right middle temporal gyri, superior parietal gyrus/precuneus, and right superior/middle frontal gyri for BF children, while MF children had fewer activation regions, which mainly in-volved the right middle temporal gyrus and superior parietal gyrus/precuneus. Average fMRI activation maps for the language task (Fig 4,P⬍.001, Bonfer-roni-corrected cluster size ofⱖ30 vox-els) showed that BF children had wide-spread activation in the left and right lingual gyri and cuneus and left fusiform and the left middle/inferior frontal gyri, while MF children had similar overall activation except for less left temporal lobe activation. The total activation cluster size (P⬍.001, Bonferroni-cor-rected) calculated for individual subjects in each of the involved brain areas ( Ta-ble 2) showed significantly more activa-tion for BF children in the right frontal and left and right temporal lobes for the perception task and in the left temporal/ occipital lobes for the language task (all,
P⬍.05).
DISCUSSION
The total brain gray matter volume did not differ between BF and MF children in our study. This is consistent with a previous report that did not observe a significant correlation between breast
FIG 2. Comparison of regional gray matter volume measures by VBM. The results are shown in a 3-plane projection view inAandB, in which the statistical threshold was set atP⬍.001 uncor-rected, with a cluster size ofⱖ30 voxels.A, Multiple regions had higher gray matter volumes in BF than MF children.B, No region had higher gray matter volume in MF than BF children. Regions with significantly higher (P⬍.05, corrected) gray matter volume in BF than MF children were overlaid on the customized gray matter template for 8-year-old children (1 region in the left superior parietal lobe,C, and 1 region in the left inferior temporal lobe,D). All images are displayed in radiologic convention (left/right flipped).
[image:4.594.55.375.99.457.2] [image:4.594.53.531.550.697.2]milk intake and total gray matter volume in ex-preterm children.6 However, these measures of total volume provide a gross assess-ment of brain structure and may not be sensitive enough to detect subtle and/or regional differences. On the other hand, regional gray matter volume analysis by VBM used in the present study can detect regional differences in the distribution of gray matter, in addition to providing whole-brain analyses. Our results revealed multiple brain regions with significantly higher gray matter vol-ume in BF than in MF children. These findings are consistent with previous reports of better regional gray matter development asso-ciated with breastfeeding compared with formula feeding.7,21Our VBM analysis observed significant regional gray matter differ-ences in BF-versus-MF children in cortical but not deep gray mat-ter. These results differ from those of Herba et al,21who showed a larger gangliothalamic ovoid diameter in BF-versus-formula-fed infants as quantified by using sonography. These apparent discor-dant results may be influenced by the brain maturation pattern of deep gray matter, which develops earlier than cortical gray mat-ter22; thus, diet effects on gray matter may be more prominent in deep regions during infancy, but in cortical regions during later childhood. Our VBM analysis identified higher regional gray mat-ter volume in the parietal lobe of BF-versus-MF children, in agreement with Kafouri et al,7who reported a positive association between the duration of exclusive breastfeeding and cortical thickness of superior and inferior parietal lobules. In addition, our study also revealed significant regional gray matter volume
differences between BF and MF children in the left inferior tem-poral lobe, indicating that voxelwise whole-brain analysis may be more sensitive than the ROI cortical thickness measure. Finally, the regional gray matter volume comparison by VBM was based on modulated gray matter attenuation, while the total gray matter volume was computed from the gray matter segment obtained at an early stage of the VBM analysis (before volume modulation). The former approach is more sensitive to local gray matter vol-ume changes, but such changes may not be sufficiently large enough to be reflected in the total gray matter volume, which is simply a sum of all voxels segmented as gray matter. The observed significant decreases of regional gray matter volume in the MF group may also be accompanied by increases in some gray matter regions that did not form statistically meaningful clusters (such as atP⬍.001 uncorrected with a cluster size ofⱖ30 inFig 2Bor at
P⬍.05 corrected inFig 2C,-D). Therefore, it is possible that in our study, the total gray matter volume was not different between groups but the regional comparison of gray matter showed only significant decreases in the MF group.
Our fMRI results also indicated that BF children may have better functional development of gray matter than MF children. Specifically, when we compared the average activation maps gen-erated at a statistical threshold ofP⬍.001 (Bonferroni-corrected) between groups, BF children had significantly more activation in the right frontal and left/right temporal lobes for the perception task and in the left temporal lobe for the language task. Greater brain activation for similar tasks has been observed in healthy adults versus children20and correlated with better task perfor-mance,23while reduced activation has been observed in children with dyslexia,24indicating that more activation is probably asso-ciated with better functional development of the brain. The over-all greater brain activation and presumably better functional de-velopment in BF than in MF children was consistent with the fMRI task performance data in our study, which showed signifi-cantly better task performance in BF than in MF children and agreed with literature findings in larger scale studies in which better language development and higher IQ associated with breastfeeding were observed.1,17 Greater activation in the left temporal lobe for both tasks in BF children was also consistent with our VBM findings, in which higher regional gray matter volume was detected. The average language fMRI activation maps
[image:5.594.55.529.48.197.2]FIG 4. Average activation maps for the fMRI language task for BF (top row) and MF (bottom row) children. Activated regions are highlighted in yellow/orange. The threshold was set atP⬍.001 after Bonferroni correction and a cluster size ofⱖ30 voxels. All images are displayed in radiologic convention (left/right flipped). BF children had more extensive activation in the left temporal lobe.
Table 2: Comparison of the fMRI-activation total cluster size (No. of voxels)a
BF Mean (SE)
MF Mean
(SE) PValue Perception fMRI
Right frontal 1280 (814) 6 (6) .002b
Parietal 1263 (488) 723 (546) .445
Left temporal 1394 (680) 112 (86) .011b
Right temporal 2263 (1364) 33 (22) .041b
Language fMRI
Left frontal 1125 (616) 261 (113) .513
Left temporal/occipital 2632 (650) 613 (213) .04b
Right temporal/occipital 1894 (609) 909 (369) .251
Note:—SE indicates standard error.
a
BF children had greater activation than MF children for both fMRI tasks.
[image:5.594.54.285.261.376.2]for all children were consistent with activation maps reported for similar visual rhyming tasks for children,20and the BF/MF brain activation differences were significant in the left temporal lobe, which is important for phonologic processing (rhyming in our study)20and involves the fusiform gyrus, which has been regarded as an important region for visual word processing.25These results also suggest that the visual rhyming-language fMRI may be sen-sitive to differences in language processing associated with infant diets, despite the fact that the language measures such as verbal IQ and CELF-4 scores did not differ significantly (except for a trend toward lower scores in MF children for all language components) in our relatively small cohort of BF and MF children.
One limitation of our study is that we could not obtain family socioeconomic status data for some of the subjects and incorpo-rate the background information into covariate analyses. How-ever, the data we were able to collect of parents’ education and income from the subjects were not different between groups ( Ta-ble 1). Variables not considered in our study during infancy to 8 years of age may also impact brain development in children and may be confounders for our observed association between infant diets and brain development. Nevertheless, the diverse nature of our recruiting methods (advertisements at health fairs, pediatri-cian offices, summer camps, schools, social media, and commu-nity events) might be expected to lessen the confounding influ-ence of these variables in our study. Another study limitation is our relatively small sample size, particularly because we were measuring potentially subtle effects in healthy children. However, we did find statistically significant VBM and fMRI differences between our cohorts of BF and MF children. While we did include sex as a covariate in our analyses, possible cross-sex variations in the effects of infant diets on gray matter development may need to be investigated with a larger sample size. Future studies with larger sample sizes and well-characterized cohorts may be benefi-cial to better delineate neuroimaging correlates of infant diet ef-fects on children’s brain development.
CONCLUSIONS
We used VBM and fMRI to evaluate the brain gray matter struc-ture and function in healthy 8-year-old children who were pre-dominantly BF or MF during infancy. Our imaging results showed that BF children had greater gray matter volume in spe-cific brain regions than MF children, despite the total gray matter volume not being different between groups. Our results also showed more brain activation for the BF children when process-ing perception and language tasks. Our results indicate an associ-ation between infant diets and long-term brain development in healthy children.
ACKNOWLEDGMENTS
We appreciate the Human Studies Core of the Arkansas Chil-dren’s Nutrition Center for all their effort in this project. We also thank all subjects and their families for participating in this study.
Disclosures: Xiawei Ou—RELATED:Grant: US Department of Agriculture,* Com-ments: This project is supported by US Department of Agriculture/Agricultural Re-search Service funding to Arkansas Children’s Nutrition Center. Aline Andres— RELATED: Grant: US Department of Agriculture/Agricultural Research Service grant.* Rudolph T. Pivik—RELATED:Grant: US Department of
Agriculture/Agricul-tural Research Service.* Jeffrey H. Snow—RELATED:Grant: US Department of Agri-culture funding of the Nutrition Center.* Thomas M. Badger—RELATED:Grant: US Department of Agriculture,*Comments: This is a center grant for the Arkansas Children’s Nutrition Center to study the effects of diets and nutritional status on child development and disease prevention. *Money paid to the institution.
REFERENCES
1. Anderson JW, Johnstone BM, Remley DT.Breast-feeding and cognitive development: a meta-analysis.Am J Clin Nutr1999;70:525–35Medline
2. Brion MJ, Lawlor DA, Matijasevich A, et al.What are the causal effects of breastfeeding on IQ, obesity and blood pressure? Evi-dence from comparing high-income with middle-income cohorts. Int J Epidemiol2011;40:670 – 80CrossRef Medline
3. Kramer MS, Aboud F, Mironova E, et al; Promotion of Breastfeeding Intervention Trial (PROBIT) Study Group.Breastfeeding and child cognitive development: new evidence from a large randomized trial.Arch Gen Psychiatry2008;65:578 – 84CrossRef Medline
4. Oddy WH, Li JH, Whitehouse AJO, et al.Breastfeeding duration and academic achievement at 10 years. Pediatrics 2011;127:e137– 45
CrossRef Medline
5. Quigley MA, Hockley C, Carson C, et al.Breastfeeding is associated with improved child cognitive development: a population-based cohort study.J Pediatr2012;160:25–32CrossRef Medline
6. Isaacs EB, Fischl BR, Quinn BT, et al.Impact of breast milk on intel-ligence quotient, brain size, and white matter development.Pediatr Res2010;67:357– 62CrossRef Medline
7. Kafouri S, Kramer M, Leonard G, et al.Breastfeeding and brain structure in adolescence.Int J Epidemiol2013;42:150 –59CrossRef Medline
8. Deoni SC, Dean DC 3rd, Piryatinsky I, et al.Breastfeeding and early white matter development: a cross-sectional study.Neuroimage 2013;82:77– 86CrossRef Medline
9. Ou X, Andres A, Cleves MA, et al.Sex-specific association between infant diet and white matter integrity in in 8-y-old children.Pediatr Res2014;76:535– 43CrossRef Medline
10. Isaacs EB.Neuroimaging, a new tool for investigating the effects of early diet on cognitive and brain development.Front Hum Neurosci 2013;7:445CrossRef Medline
11. Ashburner J, Friston KJ.Voxel-based morphometry: the methods. Neuroimage2000;11:805–21CrossRef Medline
12. Adleman NE, Fromm SJ, Razdan V, et al.Cross-sectional and longi-tudinal abnormalities in brain structure in children with severe mood dysregulation or bipolar disorder.J Child Psychol Psychiatry 2012;53:1149 –56CrossRef Medline
13. Boddaert N, Chabane N, Gervais H, et al.Superior temporal sul-cus anatomical abnormalities in childhood autism: a voxel-based morphometry MRI study. Neuroimage 2004;23:364 – 69
CrossRef Medline
14. Eckert MA, Leonard CM, Wilke M, et al.Anatomical signatures of dyslexia inchildren:uniqueinformationfrommanualandvoxelbasedmorphom-etry brain measures.Cortex2005;41:304–15CrossRef Medline
15. Taki Y, Hashizume H, Sassa Y, et al.Breakfast staple types affect brain gray matter volume and cognitive function in healthy chil-dren.PLoS One2010;5:e15213CrossRef Medline
16. Dee DL, Li RW, Lee LC, et al.Associations between breastfeeding practices and young children’s language and motor skill develop-ment.Pediatrics2007;119:S92–98CrossRef Medline
17. Belfort MB, Rifas-Shiman SL, Kleinman KP, et al.Infant feeding and childhood cognition at ages 3 and 7 years: effects of breastfeeding duration and exclusivity.JAMA Pediatr2013;167:836 – 44CrossRef Medline
18. Wilke M, Holland SK, Altaye M, et al.Template-O-Matic: a toolbox for creating customized pediatric templates.Neuroimage2008;41: 903–13CrossRef Medline
19. Reiss AL, Abrams MT, Singer HS, et al.Brain development, gender and IQ in children: a volumetric imaging study.Brain1996;119: 1763–74CrossRef Medline
mech-anisms for processing orthographic and phonologic representa-tions.J Cogn Neurosci2004;16:1234 – 49CrossRef Medline
21. Herba CM, Roza S, Govaert P, et al.Breastfeeding and early brain development: the Generation R study.Matern Child Nutr2013;9: 332– 49CrossRef Medline
22. Tzarouchi LC, Astrakas LG, Xydis V, et al.Age-related grey matter changes in preterm infants: an MRI study.Neuroimage2009;47: 1148 –53CrossRef Medline
23. Booth JR, Burman DD, Meyer JR, et al.Relation between brain
acti-vation and lexical performance.Hum Brain Mapp2003;19:155– 69
CrossRef Medline
24. Cao F, Bitan T, Chou TL, et al.Deficient orthographic and pho-nological representations in children with dyslexia revealed by brain activation patterns. J Child Psychol Psychiatry 2006;47: 1041–50CrossRef Medline