IC, 2016 – 12(5): 1308-1400 – Online ISSN: 1697-9818 – Print ISSN: 2014-3214 http://dx.doi.org/10.3926/ic.837
High involvement work programs (HIWP) measurement model
validation and its capacity to predict perceived performance
Amable Juarez-Tarraga1 , Juan A. Marin-Garcia2 , Cristina Santandreu-Mascarell1 1Universitat Politècnica de València, Dept. Organización de Empresas (Spain)
2ROGLE-UniversitatPolitècnica de València (Spain)
[email protected], [email protected], [email protected]
Received July, 2016 Accepted August, 2016
Versión en español
Abstract
Purpose: One of the objectives of the work is the validation of a measurement model of the HIWP (High Involvement Work programs) based on Lawler (1986) questionnaire. Our proposal presents a second order composite construct for HIWP, in which the four first-order constructs that characterize the model (Communication, Training, Compensation and Participation) are composite constructs. After addressing the validation of the measurement model, it is also checked the structure model to assess the predictive ability of HIWP on perceived performance in three different samples from different countries.
Design/methodology: To validate the model based on composites, partial least squares (PLS-SEM) was used. Data were obtained by researchers who developed the official versions of the questionnaire in English and Castilian.
Research limitations/implications: First, our data come from studies of more than 15 years ago, but to test measurement models, the date of the data is not a significant limitation because we analyzed the relationship between the constructs and were not interested in describing the state of evolution of these practices, but how to measure this relationship. Moreover, we only have data from large companies in both countries so we can not generalize the findings to other contexts.
Originality/value: The findings are important for practitioners and researchers because quantifies the relationship between the use of HIWP and performance in two countries with important cultural differences, and also identifies practices that contribute most to this positive relationship.
Keywords: HRM, Human Resources, Composite model mode B, PLS-SEM, High Involvement Work programs, HIWP
Jel Codes: O15, L25
1. Introduction
One of the most important questions within the framework of research on Human Resource Management Systems, and more specifically in relation to the use of High Involvement Work Practices(HIWP), is understanding how they affect the company's results (Becker & Huselid, 2006; Benson, Young & Lawler III, 2006; Bowen & Ostroff, 2004; Huselid & Becker, 1996) and being able to decipher what has been identified as “the black box” (Jiang, Takeuchi & Lepak, 2013)
performance in 116 previous articles. These meta-analyses confirm that HIWP positively affect business performance.
However, it should also be pointed out that some researchers have found contradictory results, such as in the case of Cappelli and Neumark (2001) and Wright, Gardner, Moynihan and Allen (2005), who argue that the use of high involvement practices can increase productivity, but they can also lead to higher labor costs, since more staff members are required. Boselie, Dietz and Boon (2005) indicates the possibility that organizations with high performance at a particular time might invest their additional resources in implementing human resource programs that later lead to improved performance, opening the door to the existence of a possible inverse causal relationship, which could only be ruled out by longitudinal or quasi-longitudinal studies.
In spite of the existence of sporadic contradictory results, most researchers have confirmed, through numerous field studies, a positive relationship between the use of HIWP and improved results, whether they be operational, financial or in terms of human resources (Conci, 2012).
However, on the methodological level, we find some aspects that raise doubts about the results obtained in these field studies that propose to identify the relationships that occur in this “black box”. First we should mention the fact that the questionnaires used by the researchers to analyze these relationships between HIWP and business performance are quite varied, as specific questionnaires are usually created for each study, and on rare occasions those designed by other researchers are reused, which means that we do not have a measurement model that is consistent and widely disseminated throughout the scientific community (Marin-Garcia, 2013).
In addition, and more importantly, it is not common to find the validation of the measurement models used, as almost all the works are focused on proving the structural models, and it is even rarer to find studies that validate the measurement models in different samples (Marin-Garcia & Conci, 2010, 2012).
And finally, in the few studies that have considered the validation of the measurement model, the truth is that the results are not very conclusive in terms of HIWP (Marin-Garcia & Conci, 2009, 2012, 2013).
In this framework and keeping in mind that the attempts to validate the model used to measure HIWP using reflective models between items and constructs (Marin-Garcia & Conci, 2013) have not had good results, in this work we propose to:
• Verify the HIWP measurement model in Lawler's questionnaire (1986) as a formative model (composite mode B).
• Analyze the predictive capacity of the proposed model.
For our research, we used as a reference the questionnaire designed by Lawler (1986), since it is one of the few models that have been reused by other researchers to evaluate the use of HIWP. The questionnaire proposed by Lawler results in a model of constructs in which the relationships are unspecified, and therefore they could be considered as either reflective or formative, but in spite of this possible double nature, and even though few studies have explicitly established this relationship, all the studies consulted have opted to consider reflective models, judging by the type of statistical analysis that they apply (Marin-Garcia & Conci, 2013).
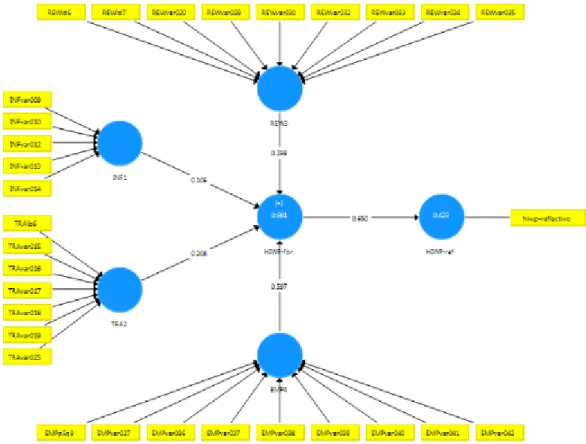
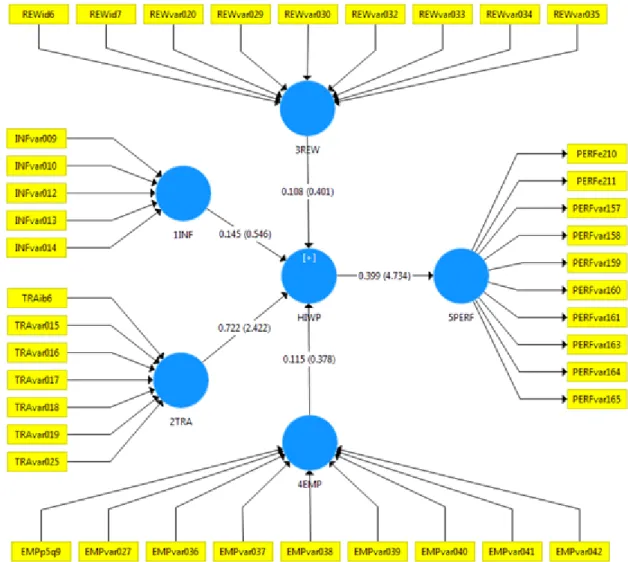
Figure 1 shows the model to be verified, which is adapted from Lawler's questionnaire (1986) and takes into account the results of previous studies (Marin-Garcia & Conci, 2013). The variables (constructs), indicators and relationships that it considers are:
• “Communication”, “training”, “rewards” and “empowerment”. These are first order and emergent exogenous constructs, in other words, they are made up of formative indicators, which as described below, implies that the constructs are the function of the indicators that precede the construct.
• “HIWP”. This is a second order formative construct that completes the HIWP measurement model.
Figure 1. The initial model to be verified. Based on Lawler III (1986); Marin-Garcia &Conci (2013)
Therefore, using as a starting point the existing theoretical body of literature, which reports a positive relationship between HIWP and performance (Arthur, 1994; Camps & Luna-Arocas, 2009; Ericksen, 2007; Guerrero & Barraud-Didier, 2004; Guthrie, Spell & Nyamori, 2002; Huselid, 1995; Wright et al., 2005; Zheng, Morrison & O'Neill, 2006), by verifying the model developed by Lawler (1986) to measure HIWP, we will also analyze whether a positive relationship exists. If on the other hand, when we associate HIWP with performance, we fail to find the positive relationship that has been established on a theoretical level, we must conclude that the measurement model we use is incorrect.
Accordingly, if we are able to validate the model, we will have a tool to measure HIWP, which raises no doubts on a methodological level, and which therefore can be used in a valid and reliable manner.
With regard to the business performance measurement, even though the proposed model has been validated in previous studies, we will also undertake its validation in this work, with the aim of completing all the stages suggested by Hair, Ringle and Sarstedt (2013) to ensure minimum quality in studies using the PLS analyzing technique.
constructs, and between these and second order constructs, both reflectively and formatively. SmartPLS (Ringle, Wende & Becker, 2015) was the software used.
In terms of data, we will use the results from field studies conducted in the United States during 1996 and 1999 (Lawler III, Mohrman & Benson, 2001; Lawler III, Mohrman & Ledford, 1998), and in Spain in 1997 (Marin-Garcia, Bonavía Martín & Miralles Insa, 2008).
1.1. Lawler's model. The “black box” between HIWP and performance
Lawler et al. (Lawler III, 1986), members of the CEO (Center for Effective Organizations) at the University of Southern California, designed a questionnaire to analyze the use of certain practices considered to behigh involvement/performance and their repercussion on certain result indicators.
This questionnaire has been sent to companies on the U.S. Fortune 1000 list by the Center for Effective Organizations since 1987, in a total of 6 surveys conducted prior to 2002, with a frequency of once every three years. While these surveys cannot be properly considered a longitudinal study, given that the Fortune list members change over the years, they do indicate a large increase in the number of companies using HIWP, as well as the percentage of employees affected. For example, the number of companies in which at least 20% of employees use self-managed teams increased from 8% in 1987 to 32% in 1996, and even though the results of the last survey conducted in 2002 show that the adoption of employee participation programs suffered a slight deceleration (Lawler III et al., 2001), the percentage of large companies using HIWP, and the number of employees affected, grew considerably throughout the assessed series.
The importance of Lawler's questionnaire (1986) lies in the fact that its use has extended beyond the research conducted by Lawler from the CEO, and with some adaptations, it has been used by other researchers in this field (Benson et al., 2006; Coye & Belohlav, 1995; Drehmer, Belohlav & Coye, 2000; Guerrero & Barraud-Didier, 2004; Lawler, 2005; Marin-Garcia et al., 2008; Yu, Finegold, Lawler & Cochran, 2000), so that if we are successful in validating the measurement model Lawler proposes, we will contribute to strengthening and confirming the results obtained by other researchers who have used it in the past.
CONSTRUCT DEFINITION
Communication Type of information that is shared with the employees for decision-making related to the improvement of their job position or the improvement of the company
Training Systematic and formal training offered to employees during the last three years and in different skills to increase their commitment and for the development of global quality management or other similar systems
Rewards The use of reward programs or systems that tend to encourage employee involvement Empowerment Organizational changes or programs that allow decision-making or power to be transferred to employees
Table 1. HIWP constructs. Source: Lawler III et al.(1998); Lawler III et al. (2001)
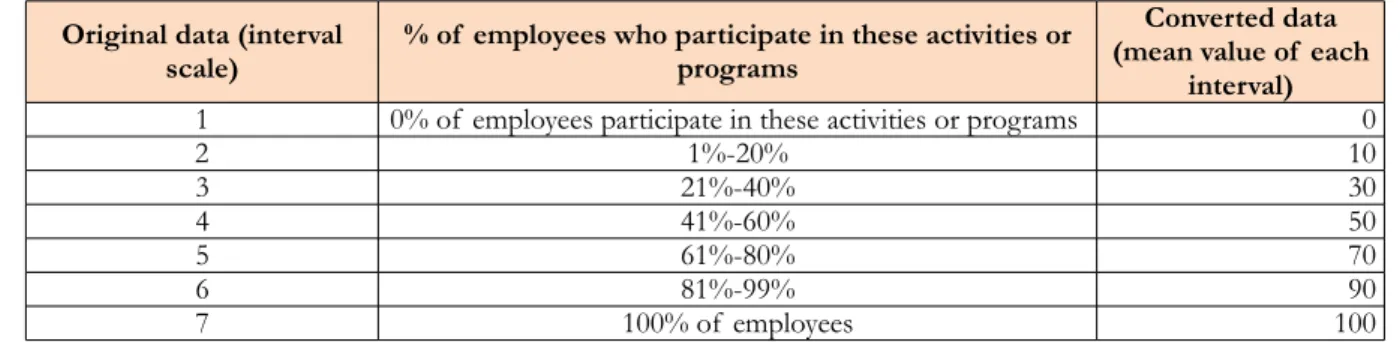
For each indicator, those surveyed were asked to indicate the degree to which each of the high involvement practices are used in their company, on a scale of 1 to 7, corresponding to the following ranges: 1 (0% of employees participate in these activities or programs), 2 (1%-20%), 3 (21%-40%), 4 (41%-60%), 5 (61%-80%), 6 (81%-99%), 7 (100% of employees).
On the other hand, the business performance construct is measured via subjective indicators, using the question “How would you rate the positive or negative impact, if any, of the efforts to achieve employee involvement in the following company performance indicators?”. To answer this question, Lawler proposes several items related to the constructs “performance and service”, “human resources results” and “organization results”, with the following response scale: very negative (1), negative (2), neutral (3), positive (4) and very positive (5).
In terms of the relationship between the items and the constructs of the model, neither Lawler nor his collaborators from the CEO, or in general, any of the researchers who have used his questionnaire explain these relationships. Therefore, it is not clear whether they are considered as reflective or formative. However, from the systematic procedure and the statistics used in the data analysis, it is inferred that the relationship between the items/indicators and the constructs, as well as the relationship between the constructs and the second order factor, when proposed, is treated as reflective.
With regard to the previous results of the validation of the exogenous constructs, in general, in studies in which Cronbach's alpha data are provided, it has been found that those of the constructs of communication and training are good, but those of empowerment and rewards fall below 0.70 in the few cases in which their value has been reported (Marin-Garcia & Conci, 2013).
In other studies in which all the practices of high involvement were considered together as a single construct, the Cronbach's alphas have values near the threshold (0.7), both slightly above and slightly below: 0.78 (Datta, Guthrie & Wright, 2005), 0.69 (Guthrie, 2001), 0.67 (Huselid, 1995).
More consistent in terms of the HIWP measurement model validation is the work of Yu et al. (2000), who also used Lawler's questionnaire and analyzed the relationships among items and constructs in a reflective manner. In this work, conducted with Asian companies, the results obtained confirm that the measurement model does not fit the data collected from companies in the United States, concluding that in the Asian environment, it is difficult to consider the constructs of empowerment and rewards to be unidimensional, and much less consider a latent second order factor representing HIWP. However, both communication and training do fit well as unidimensional constructs (the factor loadings of the items of each dimension are significant and almost all are above 0.60).
Continuing with the analysis of the works that consider the validation of the HIWP measurement model, in the work by Marin-Garcia (2013) a confirmatory analysis was conducted using Covariance-Based Structural Equation Modeling (CB-SEM) to evaluate the four constructs proposed by Lawler (communication, training, rewards and empowerment) and determine whether the grouping of items in these four constructs fits the three independent field data series (from different countries and different years), which are the same ones that we will use in our research. For this analysis, the EQS program was used with data from Spain (1997) and the United States (1996 and 1999), and the proposed goal was to evaluate whether the grouping of items into the categories considered in the theoretical models fits the data set obtained, according to a reflective model.
In this analysis, only the constructs “training” and “communication” clearly passed the convergent validity test, however, it was only possible to partially validate the reflective measurement model for the scales of empowerment and rewards.
The EQS technique was used in the analysis process, based on a reflective relationship between the indicators and the performance constructs.
During the first attempt to validate the model proposed by Lawler, with 3 different performance constructs (performance and service, human resources results and organization results) the statistics calculated do not show a good fit, so a model was also analyzed that represented all the items in a single construct; in this case, the goodness of fit statistics also failed to exceed the recommended limits. Finally, and after making several intermediate adjustments, the confirmatory factor analyses of the data from 98 Spanish companies allowed Conci (2012) to validate a model that had very good convergent validity statistics, but eliminating those items whose standardized factor loading was low; it was thus proposed that the items forming part of the construct “performance” be those shown in Table 2.
Perceived Results Productivity, quality, customer service, employee satisfaction, competitiveness Table 2. Indicators forming part of the construct “perceived results”. Source: Conci (2012)
1.2. About the formative models
In our analysis, we draw from the premise that the constructs in themselves are neither formative nor reflective, rather that the key is in how they have been conceived, their relationships and how they are measured (Hair, Hult, Ringle & Sarstedt, 2013).
Bearing this in mind, and given that the previous studies available that have attempted to validate the model with reflective relationships have not produced good results, as indicated in the previous section, we have analyzed the extent to which the model can be analyzed as formative.
To confirm that we really have a formative model, compliance with the 5 theoretical conditions proposed by Hair, Hult et al. (2013) was verified:
• causal priority of the indicators towards the construct (the formative construct is the result of
the combination of its indicators);
• the construct is a combination of the indicators;
• the indicators represent the causes of the construct;
• variations in the indicators cause changes in the construct, but not the other way around; and
• their indicators are not interchangeable.
With regard to the conceptual domain of each of the constructs and the number of indicators evaluated to infer them, they are the same as those established in the questionnaire proposed by Lawler (1986), and thus they have not be subject to analysis.
2. Methodology
Bearing in mind that the basis of our rationale is to prove the existence of formative relationships between the indicators (items) and the HIWP constructs, we will use a partial least squares structural equation modeling technique (PLS-SEM) that has been widely used in the social sciences in recent years (Hair, Hult et al., 2013).
The data from the USA come from the FORTUNE 1000 Company list, where the country's largest companies are represented, including both industrial and service companies, and the data will be used from the surveys conducted in 1996 and 1999. The data from Spain were collected in 1997 and come from a random sample of 861 industrial companies found on the Fomento de la Producción list of the 2500 largest companies (1259 were industrial establishments).
In the specific case of the data from the USA, those corresponding to the years 1996 and 1999 have been chosen so that the final data set, including Spain-1997, would be from almost the same period of time.
companies. 44% of the responses came from the Human Resources Director and the remaining 66% were from other high-level directors. In the 1996 survey in the USA, 201 responses were received, corresponding to a 22% response rate. Approximately half of the responses were from production companies and the rest were from service companies. 45% of the responses came from Human Resources Directors and the remaining 65% were from other high-level directors. The data from Spain were collected in 1997, and 101 responses were received, which corresponds to a response rate of 12%. All were from industrial companies. 63% of the responses came from the Human Resources director and the remaining 37% were from other high-level directors.
Even though the original questionnaire from Lawler is broader in scope, in our analysis, we have only considered the data from those indicators that are present in all 3 data series that we used as our starting data, which gives us a total of 30 indicators related to the constructs of high involvement practices (See Appendix 1). The 30 items serve to measure the four constructs proposed in this study: communication (5 items), training (7 items), rewards (9 items) and empowerment (9 items), which were originally measured using a scale of 1 to 7 with the following equivalences: 1 (0% of employees participate in these activities or programs), 2 (1%-20%), 3 (21%-40%), 4 (41%-60%), 5 (61%-80%), 6 (81%-99%), 7 (100% of employees).
On the other hand, the business performance construct is measured via subjective indicators, using the question “How would you rate the positive or negative impact, if any, of the efforts to achieve employee involvement in the following company performance indicators?”. Even though Lawler originally proposed 11 items, 4 of which were related to “performance and service”, 4 were related to “human resources results” and 3 were related to “organization results,” and a scale of 1 to 5 was used on each item, with the following equivalences: 1 (very negative), 2 (negative), 3 (neutral), 4 (positive) and 5 (very positive), in our model, which is based on the validation conducted by Conci (2012), only the 10 indicators are used that were included in the Spanish questionnaire (see Appendix 1).
Original data (interval
scale) % of employees who participate in these activities orprograms
Converted data (mean value of each
interval)
1 0% of employees participate in these activities or programs 0
2 1%-20% 10
3 21%-40% 30
4 41%-60% 50
5 61%-80% 70
6 81%-99% 90
7 100% of employees 100
Table 3. Transformation of the values for the HIWP items
The performance construct is not rescaled because it does not represent an interval.
In terms of the verification methodology, the protocol suggested by Hair, Hult et al. (2013) was applied for both the validation of the measurement model and for the structural model:
• To verify the HIWP measurement model, the 3 proposed stages will be considered: evaluation
of the convergent validity, using a redundant analysis; analysis of the multicollinearity of the indicators and finally, evaluation of the significance and relevance of the formative indicators. The verification will be carried out independently for each of the 3 samples (Spain-1997, USA-1996 and USA-1999), except for in the first stage (evaluation of the convergent validity), since data are only available to evaluate the sample USA-1996.
• The validity of the reflective measurement model of the construct “performance” is also verified, taking into account the results of previous research that validated the measurement model as reflective in the case of the sample Spain-1997 (Conci, 2012).
• Once the measurement model has been verified, we will analyze the structural model, following the 5 stages indicated by Hair, Hult et al. (2013): evaluating collinearity; evaluating the significance and relevance of the relationships in the structural model (path coefficients); evaluating the determination coefficient (R2); evaluating the effect size (f2); and finally,
evaluating the predictive relevance Q2 and the q2 effect sizes. Once again, we will perform this
verification independently for each of the three samples being analyzed.
indications by Barroso Castro, Cepeda Carrión and Roldán Salgueiro (2007), this construct has been defined with formative relationships, given that it is an additive combination of the 4 dimensions (communication, training, rewards and empowerment), which represent heterogeneous facets that make a single contribution to the construct. With regard to the operationalization of this construct, between the two techniques that are generally used to estimate the parameters of second order constructs in PLS,
• the repetition of indicators and
• the two-stage method (Ringle et al., 2015), in our study, we have opted to use the repetition of indicators method, with formative relationships, given that it enables us to estimate all the relationships among the constructs simultaneously (Hair, Hult et al., 2013).
Below is a brief description of the methodology proposed by Hair, Hult et al. (2013) for the verification of the measurement model and of the structural model.
2.1. Formative models. Verification of the measurement model
2.1.1. Stage 1 - Evaluation of the convergent validity
The convergent validity represents the extent to which an indicator is related to other indicators in the same construct. When the formative measurement models are verified, we must evaluate the extent to which the formative construct is correlated with a reflective measurement of the same construct. This process is also known as redundant analysis, since we are assessing whether the indicators are included in the formative as well as the reflective construct. The path-coefficient value that connects the two constructs is indicative of the validity of the set of formative indicators in order to evaluate the construct of interest. The proposed objective is to obtain an r2 value of 0.81 or at least 0.64. If the
model demonstrates a lack of convergent validity, this implies that the indicators that form part of the formative model do not contribute as sufficiently as expected, and thus the constructs must be conceptually reformulated by replacing and/or adding indicators.
"Approximately what percent of your corporation's employees are in units in which each of the following patterns of employee involvement practice is predominant? Please, allocate 100% in answering 1-5.
• None. No significant employee involvement exits in these parts of the corporation,
• Improvement Teams. Employee involvement focuses on special groups that are
responsible for recommending improvements to management. These groups may be participation groups, quality circles...
• Job involvement. Employee involvement focuses on creating work designs that are highly motivating, such as self-managing teams. Training focuses on job specific skills and/or team functioning...
• Business involvement. Employees are involved heavily in the management of the business. Improvement teams and job involvement approaches may be used as part of this strategy...
• Other form of involvement. Employee involvement approaches not described by 2,3 or 4." (Lawler III, 1986)
As can be seen, this question was formulated as a scale variable, but it has been converted into a single item variable by calculating the weighted mean, after assigning the weights indicated in Table 4 to each of the options offered on the questionnaire.
Question assignedWeight
1. None. No significant employee involvement exists in these parts of the corporation 0 2. Improvement Teams. Employee involvement focuses on special groups that are responsible for
recommending improvements to management. These groups may be participation groups, quality
circles… 5
3. Job involvement. Employee involvement focuses on creating work designs that are highly motivating, such as self-managing teams. Training focuses on job specific skills and/or team
functioning... 7
4. Business involvement. Employees are involved heavily in the management of the business.
2.1.2. Stage 2 - Evaluation of the multicollinearity
In a formative model in which the indicators are not interchangeable, no close correlations should exist between the items that make up each construct (Cepeda & Roldán, 2004). As a matter of fact, close correlations between indicators would pose methodological problems and difficulties in interpreting the results, since they would complicate the identification of the effect that each has on the concept (Hair, Hult et al., 2013).
To evaluate multicollinearity, the variance inflation factor (VIF) is calculated to determine whether it is greater than 0.2 and less than 5 for each of the indicators that make up the different constructs. Version 3.2.3 of SmartPLS provides this value directly.
2.1.3. Stage 3 - Evaluation of the significance and relevance of the formative indicators
Another important criterion for assessing the contribution made by a formative indicator and its relevance is its outer weight. Outer weight is the result of a multiple regression (Hair, Hult et al., 2013) in which the constructs are the dependent variable and the indicators (items) are the independent variables. Given that the construct itself is formed by its underlying formative indicators (items), a multiple regression analysis should provide an R2 value of 1.0 (without any error variance, 100% of the
construct is explained by the indicators). We must check whether the outer weights in the formative models are significantly different from zero, using the bootstrapping procedure (a non-parametric resampling technique).
Bearing in mind that the maximum outer weight of the indicators that make up each construct is 1/root(n), Table 5 indicates the maximum values for each construct.
Communication (5) Training (7) Rewards (9) Empowerment (9)
0.4472 0.3780 0.3333 0.3333
Table 5. Maximum outer weight of each formative construct
For the resampling (bootstrapping), the following configuration has been applied:
• The missing values are replaced by the mean
• No change in sign
• Samples=5,000
• Level of significance=0.05
When the outer weight of an indicator is significant, there is empirical support to keep the indicator. When the outer weight of an indicator is not significant, but its load is relatively high (>0.5), the indicator must be kept.
If neither the outer weight nor the load are significant, there is no empirical support for retaining the indicator and it should be removed from the model.
After this brief description of the methodology used to verify the formative measurement models, we will proceed to describe the methodology to verify the reflective measurement models.
2.2. Reflective models. Verification of the measurement model
2.2.1. Stage 1 - Internal consistency
The internal consistency of the indicators that make up each construct is evaluated, in other words, the rigorousness with which the indicators (items) are measuring the same construct (latent variable) is examined. In SmartPLS, the outer loading of the indicators is evaluated to determine whether it is greater than 0.708.
2.2.2. Stage 2 - Reliability of the indicator
2.2.3. Stage 3 - Convergent validity
The aim is to evaluate whether a set of indicators really measures the construct. To analyze this type of validity, an average variance extracted (AVE) method is used. The acceptance criterion consists of verifying that the average variance extracted (AVE) of a construct is greater than 0.5, meaning that the construct shares more than half of its variance with its indicators.
2.2.4. Stage 4 - Discriminant validity
With this criterion, it is verified that a particular construct is different from the others. For this verification, the variance shared by a construct with its indicators must be greater than that which it might share with other constructs included in the model.
2.2.5. Stage 5 - Verification of the structural model
Once the measurement model has been verified independently for each sample (USA-1996, USA-1999 and Spain-1997), an analysis of the structural model will be conducted to determine the predictive capacity of the model and the relationships among the constructs, also analyzing each of the samples separately, evaluating the amount of variance of the endogenous construct (performance) that is explained by the constructs that predict it, and the extent to which the predicting constructs contribute to the explained variance of the endogenous construct. To do this, we will evaluate two basic indexes: R2 and the path coefficients or standardized regression weights.
The process for analyzing the structural model, which follows the indications by Hair, Hult et al. (2013), has 5 stages: evaluation of collinearity; evaluation of the significance and relevance of the relationships in the structural model (path coefficients); evaluation of the coefficient of determination (R2); evaluation of the impact (effect sizes) (f2); and finally, evaluation of the predictive relevance (Q2)
2.3. Evaluation of the structural model
2.3.1. Step 1 - Analysis of collinearity
In order to ensure that there is no collinearity among the 4 constructs that make up the second order HIWP construct, a multiple regression analysis is conducted on the path coefficients of the aforementioned constructs: communication, training, rewards and empowerment. The version 3.2.3. of SmartPLS that we have used in our work provides the VIF data directly, which must be <5.
2.3.2. Step 2 - Path coefficients of the structural model
Before examining the path coefficients, which represent the relationships that exist among the constructs, it is necessary to determine whether they are significant.
To do this, the resampling or bootstrapping option is run, with the following parameters:
• The missing values are replaced by the mean
• No change in sign
• Samples=5,000
• Level of significance=0.05
Within each of the constructs, the value of the T statistics is also analyzed, which must be >1.96 (two-tailed test) for p<0.05, and >0.98 (one-(two-tailed test) for p<0.05.
2.3.3. Step 3 - Coefficient of determination (R2 value)
The R2 value, the coefficient of determination, is the value most commonly used to evaluate structural
models, as it represents the predictive value that the preceding constructs have of each construct. The coefficient represents the combined effects of the combined exogenous constructs on the endogenous construct, and also represents the variance of the endogenous construct explained by the different exogenous constructs.
The R2 value ranges from 0 to 1, and values close to 1 indicate a greater predictive capacity, although in
the field of management, R2 values greater than 10% can be considered as values to be considered in
spite of their low value.
2.3.4. Step 4 - Impact measurement (f2)
The f2 (effect size) value is a measurement of the impact of a predictive construct on the endogenous
construct, and it provides valuable information about the change that occurs in the R2 value when a
construct is eliminated. Thus, f2 values below 0.02 tell us that this construct barely has any effect, while
values between 0.02 and 0.15 mean that the effect can be considered as medium, and values above 0.35 indicate that the construct clearly must form part of the model.
To obtain the f2 value when several constructs contribute to an endogenous construct in a structural
model, the model must be recalculated, removing the constructs that contribute to it one by one, and the following formula must be applied:
f 2=Rincluded
2
−Rexcluded2
1−Rincluded2
2.3.5. Step 5 - Blindfolding and Q2 predictive relevance
For reflective constructs that have an effect on the predictive model, it is necessary to evaluate the Q2
predictive relevance to analyze the extent to which the exogenous constructs contribute to the explained variance of the endogenous constructs in the model. To do this, following the indications of Hair, Hult et al. (2013), the cross-validated redundancy approach is applied, running the blindfolding for the corresponding construct.
Since in our model the only reflective construct is precisely the endogenous construct that we wish to analyze, it is not necessary to perform this last step in the evaluation of the structural model.
3. Results and discussion
3.1. Evaluation of the sample size
Before proceeding with the analysis, it was assessed whether the sample size was sufficient to estimate the proposed model using the PLS-SEM technique, since the stability of the estimates can be affected by sample size (Hair, Hult et al., 2013).
Furthermore, to ensure the appropriateness of the sample size, the number of regressors that have been included in the model must be considered. Given the characteristics of the PLS estimation, it is recommended as a practical rule to determine the required sample size in order to be able to apply this technique (Cepeda & Roldán, 2004; Hair, Hult et al., 2013), multiplying by 10 the number of indicators that form part of the formative construct with the greatest complexity (in our case, 9), and the largest number of preceding constructs that lead to an endogenous construct (in our model, 4), considering the largest result.
3.2. Descriptive analysis of the constructs
Below are the tables with the descriptive statistics for the four categories of programs (constructs) that make up Lawler's model (1986): communication, training, rewards and empowerment in the three samples that we evaluate in our study: Spain (1997), USA (1996) and USA (1999).
1996 1999 1997
N Mean Stand. Dev. N Mean Stand. Dev. N Mean Stand. Dev. INFvar009 203 85.27 22.32 138 77.90 28.53 104 57.31 36.13
INFvar010 201 72.44 26.90 138 73.77 27.21 102 60.49 33.34
INFvar012 203 47.64 27.87 137 44.23 27.30 104 56.35 33.93
INFvar013 202 64.70 27.61 137 68.03 26.45 104 54.71 34.05
INFvar014 203 41.72 28.41 137 42.77 28.41 101 40.10 30.45 Table 6. Communication indicators
The practices corresponding to the construct “communication” (Table 6) are those that present the highest degree of implementation as compared to the other categories. In the three samples, they are the ones that present the highest mean and lowest standard deviation, although the variability in the Spanish sample is greater than for the American companies. The communication flows are slightly lower in Spain, except in relation to new technologies (INFvar012), where the opposite trend is observed.
1996 1999 1997
N Mean Stand. Dev. N Mean Stand. Dev. N Mean Stand. Dev. TRAvar015 202 36.58 24.61 135 31.11 22.22 104 34.13 27.58
TRAvar016 202 32.23 20.65 136 34.85 21.05 103 25.53 19.54
TRAvar017 201 28.66 20.73 136 30.88 23.21 104 21.35 17.63
TRAvar018 200 32.30 26.91 133 24.59 22.11 103 33.40 27.39
TRAvar019 201 40.80 24.58 136 38.82 24.68 103 38.16 30.96
TRAib6 202 58.66 25.66 136 59.04 26.88 104 56.25 34.05
TRAvar025 200 33.80 23.84 136 34.19 23.71 103 37.77 28.87 Table 7. Training indicators
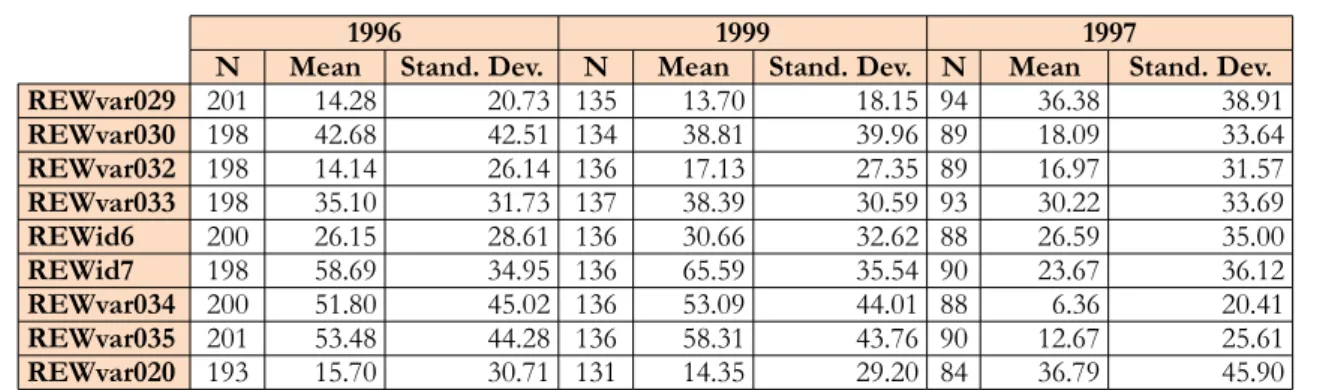
1996 1999 1997
N Mean Stand. Dev. N Mean Stand. Dev. N Mean Stand. Dev. REWvar029 201 14.28 20.73 135 13.70 18.15 94 36.38 38.91
REWvar030 198 42.68 42.51 134 38.81 39.96 89 18.09 33.64
REWvar032 198 14.14 26.14 136 17.13 27.35 89 16.97 31.57
REWvar033 198 35.10 31.73 137 38.39 30.59 93 30.22 33.69
REWid6 200 26.15 28.61 136 30.66 32.62 88 26.59 35.00
REWid7 198 58.69 34.95 136 65.59 35.54 90 23.67 36.12
REWvar034 200 51.80 45.02 136 53.09 44.01 88 6.36 20.41
REWvar035 201 53.48 44.28 136 58.31 43.76 90 12.67 25.61
REWvar020 193 15.70 30.71 131 14.35 29.20 84 36.79 45.90 Table 8. Reward indicators
In terms of rewards (Table 8), in line with what has been mentioned in different works (Conci, 2012; Marin-Garcia et al., 2008), there are differences in the degrees to which the different tools are used. Used more intensively in the United States than in Spain are the practices of profit sharing (REWvar030), non-monetary rewards (REWid7), shares in the company's capital (REWvar034) and flexible pay (REWvar035). The group complements (REWid6) show a similar level, and job security (REWvar020) and competency-based pay (REWvar029) is more common in Spain than in the USA.
Finally, the practices of “empowerment” (Table 9) generally present a degree of deployment that is fairly similar in both Spain and the USA, evidencing a low level of use of mini-business units(EMPvar041) and self-managing teams (EMPvar042) programs in both countries. However, there are differences in three of the nine programs analyzed. Opinion surveys (EMPvar036) are clearly used less in Spain than they are in the USA. Furthermore, quality circles (EMPvar038) and Union-management or work commitees (EMPvar040) affect a larger percentage of the staff in Spain than in the USA.
1996 1999 1997
N Mean Stand. Dev. N Mean Stand. Dev. N Mean Stand. Dev. EMPvar027 202 39.75 35.25 137 40.88 35.51 96 35.63 41.16
EMPvar036 201 58.81 38.32 135 64.15 37.86 94 21.81 33.31
EMPvar037 201 28.41 23.84 135 23.48 24.41 91 27.81 30.32
EMPvar038 202 16.24 21.85 135 12.89 17.99 95 28.53 32.12
EMPvar039 202 37.38 28.78 136 32.87 27.75 92 31.85 32.41
EMPvar040 200 7.55 14.30 135 6.22 11.52 97 31.24 32.35
EMPvar041 200 14.80 20.62 132 14.62 22.76 83 7.35 22.74
EMPvar042 200 17.60 19.26 137 16.20 19.22 88 10.57 23.31
3.3. Results
3.3.1. HIWP. Evaluation of the measurement model. Stage 1 - Convergent validity
From the analysis of the correlation between the second order formative construct and a reflective measure of the same construct, also known as a redundant analysis, we obtained the path coefficient that relates HIWP (formative) to HIWP (reflective). For the sample USA-1996, this value is 0.65, which is slightly above the acceptance limit of 0.64 (Hair, Hult et al., 2013), as shown in Figure 2.
Figure 2. Model used to evaluate the convergent validity of the formative HIWP measurement model
3.3.2. HIWP. Evaluation of the measurement model. Stage 2 - Multicollinearity
Furthermore, in the multicollinearity analyses between each group of indicators, the results also show the absence of collinearity between the items that make up the second order construct in the samples USA-1996, USA-1999 and Spain-1997, so we can conclude that, with regard to the absence of collinearity, the data are acceptable.
3.3.3. HIWP. Evaluation of the measurement model. Stage 3 - Evaluation of the significance and relevance of the formative indicators
In this stage, the intent is to determine the extent to which a given indicator is different from the other indicators in the construct.
EEUU-96 EEUU-99 ESP-97 Weight
(T) Loading Weight(T) Loading Weight(T) Loading 96 99 97 ¿Ok? EMPp5q9 -> 4EMP 0.225 0.367 1.152 0.49 0.527 0.379 NOK NOK NOK no
EMPvar027 -> 4EMP 0.44 0.323 0.397 0.123 1.051 0.694 NOK NOK OK si
EMPvar036 -> 4EMP 2.889 0.617 0.91 0.395 0.801 0.608 OK NOK OK si
EMPvar037 -> 4EMP 2.238 0.72 1.206 0.702 0.968 0.724 OK OK OK si
EMPvar038 -> 4EMP 0.127 0.368 2.478 0.715 1.551 0.647 NOK OK OK si
EMPvar039 -> 4EMP 1.965 0.701 2.448 0.761 1.629 0.808 OK OK OK si
EMPvar040 -> 4EMP 0.743 0.367 1.606 0.433 0.39 0.432 NOK NOK NOK no
EMPvar041 -> 4EMP 1.277 0.455 0.63 0.504 0.067 0.306 NOK OK NOK si
EMPvar042 -> 4EMP 2.772 0.596 0.687 0.594 0.578 0.45 OK OK NOK si
INFvar009 -> 1INF 0.482 0.318 0.733 0.495 0.264 0.542 NOK NOK OK si
INFvar010 -> 1INF 2.531 0.781 2.032 0.763 2.251 0.891 OK OK OK si
INFvar012 -> 1INF 1.137 0.746 1.775 0.811 2.461 0.879 OK OK OK si
INFvar013 -> 1INF 0.771 0.663 0.409 0.654 0.158 0.593 OK OK OK si
INFvar014 -> 1INF 1.608 0.789 2.094 0.714 0.328 0.545 OK OK OK si
REWid6 -> 3REW 2.381 0.464 2.51 0.531 0.709 0.455 OK OK NOK si
REWid7 -> 3REW 1.731 0.505 1.394 0.378 1.532 0.71 OK NOK OK si
REWvar020 -> 3REW 3.045 0.513 0.279 0.111 1.312 0.511 OK NOK OK si
REWvar029 -> 3REW 4.311 0.64 4.127 0.646 0.765 0.2 OK OK NOK si
REWvar030 -> 3REW 1.525 0.337 1.959 0.398 0.281 0.216 NOK OK NOK si
REWvar032 -> 3REW 1.6 0.221 1.517 0.468 1.647 0.697 NOK NOK OK si
REWvar033 -> 3REW 0.298 0.19 0.046 0.31 1.08 0.585 NOK NOK OK si
REWvar034 -> 3REW 0.724 0.289 0.618 0.332 1.065 0.408 NOK NOK NOK no
REWvar035 -> 3REW 0.37 0.112 0.895 0.122 0.041 0.385 NOK NOK NOK no
TRAib6 -> 2TRA 2.25 0.725 0.577 0.274 2.026 0.92 OK NOK OK si
TRAvar015 -> 2TRA 1.393 0.701 0.07 0.673 0.315 0.781 OK OK OK si
TRAvar016 -> 2TRA 0.497 0.533 0.397 0.431 0.107 0.765 OK NOK OK si
TRAvar017 -> 2TRA 0.942 0.597 1.179 0.673 0.513 0.522 OK OK OK si
TRAvar018 -> 2TRA 1.781 0.608 3.042 0.855 0.152 0.733 OK OK OK si
TRAvar019 -> 2TRA 0.752 0.655 1.138 0.668 1.075 0.833 OK OK OK si
TRAvar025 -> 2TRA 2.904 0.791 1.195 0.637 0.156 0.567 OK OK OK si
OK 19 17 21 26
NOK 11 13 9 4
As shown in Table 10, of the 30 indicators, 26 meet the significance and relevance criteria in at least one of the samples (11 of them in all samples, 9 in 2 samples and 6 in only 1 of them). The 4 indicators that do not meet significance and relevance criteria in any of the samples are:
• 2 in the construct “rewards”: REWvar034 (share in the company's capital – Stock option plan) and REWvar035 (flexible pay/payment in kind).
• 2 in the construct “empowerment”: EMPp5q9 (advisory committees) and EMPvar040 (Union Management, work councils or collective bargaining committees).
From the analysis of these data, it can be concluded that all the items in the communication and training constructs meet, in at least one of the samples, the significance and relevance criteria required in a formative model.
On the contrary, the constructs “rewards” and “empowerment” have several items that do not meet either the significance or relevance criteria in any of the samples, which evidences that these items are not different from the rest of the items in the construct.
These data lead us to consider modifications in the model for future research, which would be along the lines of what has been indicated by other authors (Conci, 2012), who propose creating several constructs related to rewards and empowerment:
• In “rewards”, regrouping the items in “rewards to promote participation” and “performance-based compensation”.
• In “empowerment”, distinguishing between “sharing in decision making” and “work redesign practices”.
3.3.4. Performance. Verification of the measurement model. Stage 1 - Internal consistency
To evaluate the measurement model for the construct “performance”, after obtaining the outer loading value for the indicators (Hair, Hult et al., 2013), which is shown in Table 11, it was verified whether it was greater than 0.708 (values above 0.6 are acceptable).
The analysis in Table 11 shows that in the sample USA-1999, all the indicators present internal consistency, while the sample Spain-1997 is the one that demonstrates the most problems, although only the indicator “PERFe210” (“flexibility”) is unacceptable. These problems in the Spanish sample are consistent with the data of previous studies (Conci, 2012).
EEUU96 EEUU99 ESP97 EEUU96 EEUU99 ESP97 PERFe210 <- 5PERF 0.717 0.741 0.573 OK OK NOK
PERFe211 <- 5PERF 0.688 0.724 0.657 ACCEPT OK ACCEPT
PERFvar157 <- 5PERF 0.813 0.826 0.732 OK OK OK
PERFvar158 <- 5PERF 0.786 0.839 0.735 OK OK OK
PERFvar159 <- 5PERF 0.75 0.788 0.652 OK OK ACCEPT
PERFvar160 <- 5PERF 0.765 0.827 0.711 OK OK OK
PERFvar161 <- 5PERF 0.54 0.73 0.668 NOK OK ACCEPT
PERFvar163 <- 5PERF 0.771 0.837 0.737 OK OK OK
PERFvar164 <- 5PERF 0.704 0.765 0.668 ACCEPT OK ACCEPT
PERFvar165 <- 5PERF 0.719 0.74 0.628 OK OK ACCEPT Table 11. Outer loading - Evaluation of the internal consistency of the performance items
3.3.5. Performance. Verification of the measurement model. Stage 2 - Reliability of the indicator
To evaluate the reliability of the construct, the composite reliability was assessed following a resampling (bootstrapping) process. As shown in Table 12, in all samples, it is above the acceptance criterion of 0.708.
EEUU96 EEUU99 ESP97 EEUU96 EEUU99 ESP97
5PERF 0.918 0.940 0.894 OK OK OK
3.3.6. Performance. Verification of the measurement model. Stage 3 - Convergent validity
In this stage, it was assessed whether the AVE was greater than 0.5 in each of the samples, as shown in Table 13.
EEUU96 EEUU99 ESP97 EEUU96 EEUU99 ESP97
5PERF 0.531 0.613 0.459 OK OK NOK
Table 13. AVE - Evaluation of the convergent validity of the performance construct
3.3.7. Performance. Verification of the measurement model. Stage 4 - Discriminant validity
The discriminant validity of the construct is evaluated in two stages, and in each, it can be seen that the loadings of the performance construct are greater than the rest, as shown in Table 14 and Table 15.
EEUU96 EEUU99 ESP97 5PERF - 1INF 0.195 0.259 0.289
5PERF - 2TRA 0.301 0.292 0.353
5PERF - 3REW 0.293 0.335 0.229
5PERF - 4EMP 0.407 0.443 0.297
5PERF - 5PERF 0.729 0.783 0.678 Table 14. Evaluation of the discriminant validity - FORNELL-LACKER C
AÑO96 1INF 2TRA 3REW 4EMP 5PERF
PERFe210 0.142 0.214 0.222 0.267 0.717
PERFe211 0.144 0.183 0.235 0.28 0.688
PERFvar157 0.051 0.204 0.171 0.32 0.813
PERFvar158 0.106 0.264 0.23 0.327 0.786
PERFvar159 0.224 0.277 0.21 0.313 0.75
PERFvar160 0.158 0.243 0.202 0.343 0.765
PERFvar161 0.061 -0.012 0.095 0.07 0.54
PERFvar163 0.182 0.241 0.259 0.339 0.771
PERFvar164 0.124 0.212 0.195 0.297 0.704
3.3.8. HIWP. Analysis of the second order construct
In addition, and in order to evaluate the HIWP second order construct, the significance values for the first order constructs that make up the HIWP construct are shown in Table 16.
Construct USA-1996 USA-1999 Spain-1997
COMMUNICATION-HIWP 0.168 0.395 0.546
TRAINING-HIWP 0.659 0.921 2.422
REWARDS-HIWP 1.554 1.710 0.401
EMPOWERMENT-HIWP 4.103 3.835 0.378
Table 16. Evaluation of the significance (T-value) of the weights in the second order construct
As can be seen in this table, the relationship between the construct “participation” and the second order construct “HIWP” is significant in the samples USA-1996 and USA-1999, the relationship between “training” and “HIWP” is only significant in the sample Spain-1997, and the relationship between “rewards” and “HIWP” is only significant in the sample USA-1999, whereas the relationship between the construct “communication” and “HIWP” is not significant in any of the three samples.
These results, however, are not conclusive, since due to the way in which we have defined the second order construct (repetition of indicators), the number of items for each first order construct affects the weight in the second order construct (Hair, Ringle et al., 2013). In our case, there is an important difference in the number of items: communication has 5 items and training has 7, while rewards and empowerment each have 9.
This result should be verified in future studies, applying the two-stage method (Hair, Hult et al., 2013) in the definition of the HIWP second order construct to circumvent this problem detected when calculating the significance of the second order construct.
Even with these data in mind, Table 17 shows the weight values; the values above the mean in each sample have been indicated.
Construct USA-1996 USA-1999 Spain-1997
COMMUNICATION-HIWP 0.023 0.057 0.145
TRAINING-HIWP 0.112 0.151 0.722
REWARDS-HIWP 0.274 0.286 0.108
EMPOWERMENT-HIWP 0.744 0.685 0.115
From this table, we can see that the greatest incidence in the HIWP in the case of the samples from the USA comes from the construct “empowerment,” while in the case of Spain, the construct with the greatest incidence is that of training, which is also the only construct that is significant in this series (see Table 16).
3.4. Analysis of the results obtained in the verification of the measurement model
The evaluation of the quality of the measurement instrument performed in the previous sections has shown:
• The performance construct does operate as a reflective model.
• With regard to the formative measurement model applied to the four first order constructs that
make up the HIWP, the results obtained in the last stage of the verification shed doubt on the validity of some of the items associated with the rewards and empowerment constructs.
• In terms of the second order HIWP construct, it has been concluded that the methodology applied for its configuration (repetition of indicators) prevents us from obtaining conclusive data on the significance of each first order construct, and thus future studies should address this aspect.
Assuming that the model proposed in this work needs additional adjustments, which much be addressed in future studies, we propose continuing to evaluate the structural model in order to confirm the advisability of making these adjustments in the measurement model, with the aim of increasing the explained R2 of the structural model.
3.5. Evaluation of the structural model
3.5.1. Evaluation of the structural model. Step 1 - Evaluation of collinearity
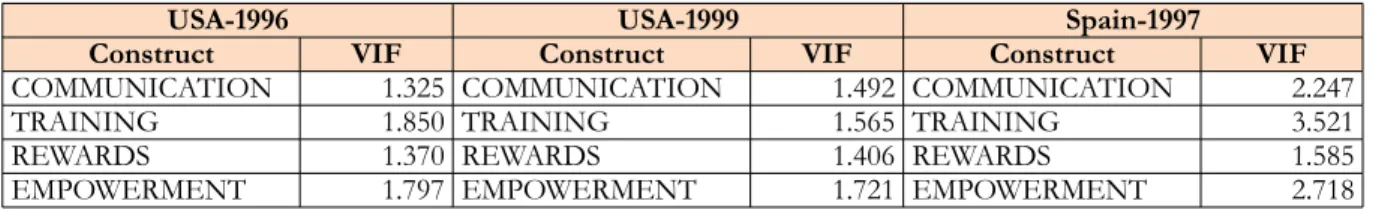
Applying the methodology described in the previous sections, it has been demonstrated that the VIF value of each of the constructs and for each of the samples is less than 5, thus confirming the lack of collinearity among the different constructs of the model (Table 18).
USA-1996 USA-1999 Spain-1997
Construct VIF Construct VIF Construct VIF
COMMUNICATION 1.325 COMMUNICATION 1.492 COMMUNICATION 2.247
TRAINING 1.850 TRAINING 1.565 TRAINING 3.521
REWARDS 1.370 REWARDS 1.406 REWARDS 1.585
EMPOWERMENT 1.797 EMPOWERMENT 1.721 EMPOWERMENT 2.718
Table 18. Evaluation of the collinearity of the structural model
3.5.2. Evaluation of the structural model. Step 2 - Path coefficients of the structural model
We have obtained the significance of the path coefficient from the T statistics, after running the bootstrapping resampling. See Table 19 and Figure 3, Figure 4 and Figure 5.
Construct EEUU1996 EEUU1999 Spain1997
HIWP-PERFORMANCE 9.066 10.594 4.734
Table 19. Evaluation of the significance (T-value) of the path coefficient in the structural model
These data evidence that the relationship between the second order construct “HIWP” and performanceis relevant, as indicated in the corresponding theoretical literature, since the path between the second order construct and performance is significant.
Next, we evaluate (Table 20) the value of the path coefficient (direct effect) between the second order construct “HIWP” and performance, which gives us information about the relative importance of this relationship. As shown in this table, this data item is lower in the Spanish sample than in the samples from the USA. However, all are in the same order of magnitude, showing a moderate-weak relationship between the two constructs.
Construct EEUU1996 EEUU1999 Spain1997
HIWP - PERFORMANCE 0.454 0.536 0.399
3.5.3. Evaluation of the structural model. Step 3 - Coefficient of determination (R2 value)
In this stage, we propose to estimate the amount of variance in the dependent constructs, in this case, the construct “performance”, which is explained by the model's preceding constructs, by means of the R2 value.
The minimum recommended value is 10%, and according to Hair, Hult et al. (2013), values greater than 75% would provide a substantial explanation; 50%, a moderate explanation; and 25%, a weak explanation.
With regard to the R2 value obtained, the following is worthy of special note (see Table 21, Figure 6,
Figure 7 and Figure 8):
• In the 3 samples, a weak effect of the HIWP practices has been detected on the measured performance.
• A much greater explained variance value has been detected in the sample USA-1999.
R2- YEAR 96 R2- YEAR 99 R2- YEAR 97
PERFORMANCE 0.206 0.288 0.159
Table 21. R2 of the dependent variable (performance construct) for the three samples analyzed
Figure 8. Sample Spain-1997. Path coefficient of the structural model and weights/loads of the measurement model
1INF 2TRA 3REW 4EMP 96 99 97 96 99 97 96 99 97 96 99 97 INFvar009 -0.093 -0.182 0.065
INFvar010 0.489 0.513 0.586 INFvar012 0.296 0.410 0.587 INFvar013 0.174 0.109 -0.043
INFvar014 0.395 0.413 -0.088
TRAib6 0.317 -0.134 0.572
TRAvar015 0.214 -0.022 0.092
TRAvar016 0.061 -0.100 0.035
TRAvar017 0.136 0.308 0.097
TRAvar018 0.228 0.577 0.037
TRAvar019 0.107 0.320 0.330
TRAvar025 0.377 0.283 0.039
REWid6 0.349 0.417 0.176
REWid7 0.323 0.305 0.386
REWvar020 0.414 0.045 0.308
REWvar029 0.507 0.612 -0.204
REWvar030 0.215 0.289 0.074
REWvar032 0.219 0.282 0.368
REWvar033 -0.043 -0.010 0.311
REWvar034 0.113 0.116 0.192
REWvar035 -0.056 -0.161 -0.008
EMPp5q9 0.028 0.151 -0.104
EMPvar027 0.057 -0.061 0.257
EMPvar036 0.384 0.155 0.164
EMPvar037 0.323 0.210 0.262
EMPvar038 0.021 0.350 0.276
EMPvar039 0.277 0.329 0.377
EMPvar040 0.081 0.204 0.074
EMPvar041 0.134 0.092 0.013
EMPvar042 0.351 0.150 0.116
Table 22. Weight of the constructs
In summary, with regard to the analysis of the structural model, we have obtained the following results:
• The path coefficient between the HIWP and performance in the 3 samples is significant, although since the measurement model could not be fully validated, this result is inconclusive.
• In the samples from the USA, the construct that has the greatest relative importance in the HIWP construct is “empowerment,” while in the Spanish sample it is “training.”
• With regard to the individual practices that have the greatest impact on performance:
◦ In “communication”: INFvar010 (information on department results) and INFvar012 (information on new technologies)
◦ In “training”: In the case of the USA, the following stand out: TRAvar018 (statistical
while in Spain, they are: TRAib6 (training in skills for your own job) and TRAvar019 (work team training)
◦ In “rewards”: REWid7 (non-monetary compensation)
◦ In “empowerment”: EMPvar037 (enrichment or redesign of the job position) and EMPvar039 (other groups of participation different form quality circles)
• With regard to the amount of variance for performance that is explained by the use of HIWP,
we have found a weak relationship in the samples from the USA (>0.2), while in the sample from Spain, the relationship is very low (0.16).
4. Conclusions, limitations and future research
The aims of this work were focused on verifying the HIWP measurement model on Lawler's (Lawler III, 1986) questionnaire as a formative model, in order to then analyze its predictive capacity.
With regard to the first objective, from an academic perspective, with this work we have verified that the scale of measurement of a second order construct for the HIWP is not entirely appropriate. The main problem arises in two of the first order constructs, and thus it is proposed for future research to improve the reward and empowerment scales, dividing each of the constructs, originally conceived as unidimensional, into two more homogeneous sub-constructs. Furthermore, this study should consider the configuration of the second order construct, applying the two-stage method, instead of the item repetition method that has been applied in this study.
On the other hand, in relation to the second objective, our study confirms the significant, although weak, relationship between the use of HIWP and company results, which in our model are measured through the perceived results. Even though this relationship exists, it is based on a measurement model that on a methodological level has not been full validated, and must be confirmed by future research.
In a general sense, this work contributes to the debate surrounding the HIWP-results relationship, indicating the possible predictive capacity of the Lawler model to measure the effect of the use of HIWP on the results of companies, based on a measurement model that presents formative relationships.
However, the limitations of this study must be kept in mind when considering these contributions. First of all, our data come from studies that are more than 15 years old, although for the purposes of testing the measurement models, the contemporaneity of the data is not an important limitation, given that we analyze the relationship between the constructs and we are not interested in describing the status of the evolution of these practices, rather how we can measure the specified relationship.
Additionally, we only have data from large companies in two countries, and thus we cannot generalize the conclusions to other contexts. Furthermore, the data used come from cross-sectional studies, which may mean that some of the effects derived from the use of HIWP are not detected, which over time, are important for the generation of results. Finally, the fact that the responses to the questionnaire come from a single source of information (management), instead of consulting other company informants, as other authors have suggested (Bowen & Ostroff, 2004; Guest, 2011; Nishii, Lepak & Schneider, 2008; Paul & Anantharaman, 2003), could represent a limitation in the validity of the conclusions reached.
References
Arthur, J.B. (1994). Effects of human resource systems on manufacturing performance and turnover. Academy of management Journal, 37(3), 670-687. Retrieved from: http://search.ebscohost.com/login.aspx? direct=true&db=buh&AN=9412131793&site=ehost-live&scope=sitehttp://dx.doi.org/10.2307/256705
Barroso Castro, M.C., Cepeda Carrión, G.A., & Roldán Salgueiro, J.L. (2007). Constructos latentes y agregados en la economía de la empresa. Asociación Española de Dirección y Economía de la Empresa (AEDEM). Retrieved from: http://dialnet.unirioja.es/servlet/oaiart?codigo=2487672
Becker, B.E., & Huselid, M.A. (2006). Strategic human resources management: Where do we go from here?. Journal of management, 32(6), 898-925. http://dx.doi.org/10.1177/0149206306293668
Benson, G.S., Young, S.M., & Lawler III, E.E. (2006). High-involvement work practices and analysts' forecasts of corporate earnings. Human resource management, 45(4), 519-537. Retrieved from Wiley Subscription Services, Inc., A Wiley Company. http://dx.doi.org/10.1002/hrm.20130
Boselie, P., Dietz, G., & Boon, C. (2005). Commonalities and contradictions in HRM and performance research. Human Resource Management Journal, 15(3), 67-94. Retrieved from Wiley-Blackwell:
http://search.ebscohost.com/login.aspx?direct=true&db=buh&AN=17649112&site=ehost-live&scope=site
http://dx.doi.org/10.1111/j.1748-8583.2005.tb00154.x
Bowen, D.E., & Ostroff, C. (2004). Understanding HRM-Firm Performance Linkages: The Role of the "Strengt" of the HRM System. Academy of Management Review, 29(2), 203-221. Retrieved from:
http://amr.aom.org/content/29/2/203.abstract
Boxall, P. (2012). High-performance work systems: What, why, how and for whom?. Asia Pacific Journal of Human Resources, 50(2), 169-186. http://dx.doi.org/10.1111/j.1744-7941.2011.00012.x
Camps, J., & Luna-Arocas, R. (2009). High involvement work practices and firm performance. International journal of human resource management, 20(5), 1056-1077. Retrieved from Routledge:
http://search.ebscohost.com/login.aspx?direct=true&db=buh&AN=4062 8014&site=ehost-live&scope=site
http://dx.doi.org/10.1080/09585190902850273
Cappelli, P., & Neumark, D. (2001). Do "High-Performance" Work Practices Improve Establishment-Level Outcomes?. Industrial & Labor Relations Review, 54(4), 737-775. Retrieved from:
http://ilr.sagepub.com/content/54/4/737.abstracthttp://dx.doi.org/10.1177/001979390105400401
Combs, J., Liu, Y.M., Hall, A., & Ketchen, D. (2006). How much do high-performance work practices matter? A meta-analysis of their effects on organizational performance. Personnel psychology, 59(3), 501-528. http://dx.doi.org/10.1111/j.1744-6570.2006.00045.x
Conci, G. (2012). Perceived results obtained by companies associated to the use of high involvement work practices (HIWP). Working Papers on Operations Management, 3(1), 01-15. Retrieved from:
http://ojs.upv.es/index.php/WPOM/article/view/1065http://dx.doi.org/10.4995/wpom.v3i1.1065
Coye, R.W., & Belohlav, J.A. (1995). An Exploratory Analysis of Employee Participation. Group & Organization Management, 20(1), 4-17. Retrieved from: http://gom.sagepub.com/content/20/1/4.abstract
http://dx.doi.org/10.1177/1059601195201002
Datta, D.K., Guthrie, J.P., & Wright, P.M. (2005). Human Resource Management and Labor Productivity: Does Industry Matter?. Academy of management Journal, 48(1), 135-145. Retrieved from:
http://amj.aom.org/content/48/1/135.abstracthttp://dx.doi.org/10.5465/AMJ.2005.15993158
Drehmer, D.E., Belohlav, J.A., & Coye, R.W. (2000). An Exploration of Employee Participation Using a Scaling Approach. Group & Organization Management, 25(4), 397-418. Retrieved from:
http://gom.sagepub.com/content/25/4/397.abstracthttp://dx.doi.org/10.1177/1059601100254005
Ericksen, J.E.F. (2007). High performance work systems, dynamic workforce alignment, and firm performance. Academy of Management Annual Meeting Proceedings (pp. 1-6) Academy of Management.
http://dx.doi.org/10.5465/AMBPP.2007.26518272
Guerrero, S., & Barraud-Didier, V. (2004). High-involvement practices and performance of French firms. International journal of human resource management, 15(8), 1408-1423.
http://dx.doi.org/10.1080/0958519042000258002
Guest, D.E. (2011). Human resource management and performance: still searching for some answers. Human Resource Management Journal, 21(1), 3-13. Retrieved from Blackwell Publishing Ltd.
http://dx.doi.org/10.1111/j.1748-8583.2010.00164.x
Guthrie, J.P. (2001). High-involvement work practices, turnover, and productivity: Evidence from New Zealand. Academy of management Journal, 44(1), 180-190. http://dx.doi.org/10.2307/3069345
Guthrie, J.P., Spell, C.S., & Nyamori, R.O. (2002). Correlates and consequences of high involvement work practices: The role of competitive strategy. International journal of human resource management, 13(1), 183-197. http://dx.doi.org/10.1080/09585190110085071
Hair, J., Ringle, C.M., & Sarstedt, M. (2013). Partial Least Squares Structural Equation Modeling: Rigorous Applications, Better Results and Higher Acceptance. Long Range Planning, 46(1GÇô2), 1-12. Retrieved from:
http://www.sciencedirect.com/science/article/pii/S0024630113000022http://dx.doi.org/10.1016/j.lrp.2013.01.001
Huselid, M.A. (1995). The impact of human-resource management-practices on turnover, productivity, and corporate financial performance. Academy of management Journal, 38(3), 635-672.
http://dx.doi.org/10.2307/256741
Huselid, M.A., & Becker, B.E. (1996). Methodological issues in cross-sectional and panel estimates of the human resource-firm performance link. Industrial relations, 35(3), 400-422.
http://dx.doi.org/10.1111/j.1468-232x.1996.tb00413.x
Jarvis, C., Mackenzie, S., & Podsakoff, P. (2003). A Critical Review of Construct Indicators and Measurement Model Misspecification in Marketing and Consumer Research. Journal of Consumer Research, 30(2), 199-218. http://dx.doi.org/10.1086/376806
Jiang, K., Lepak, D.P., Hu, J., & Baer, J.C. (2012). How Does Human Resource Management Influence Organizational Outcomes? A Meta-analytic Investigation of Mediating Mechanisms. Academy of management Journal, 55(6), 1264-1294. Retrieved from: http://amj.aom.org/content/55/6/1264.abstract
http://dx.doi.org/10.5465/amj.2011.0088
Jiang, K., Takeuchi, R., & Lepak, D.P. (2013). Where do We Go From Here? New Perspectives on the Black Box in Strategic Human Resource Management Research. Journal of management studies, 50(8), 1448-1480. http://dx.doi.org/10.1111/joms.12057
Lawler III, E.E. (1986). High-Involvement Management. Participative Strategies for Improving Organizational Performance. Jossey-Bass Inc., Publishers.
Lawler, E.E. (2005). From human resource management to organizational effectiveness. Human resource management, 44(2), 165-169. Retrieved from Wiley Subscription Services, Inc., A Wiley Company.
http://dx.doi.org/10.1002/hrm.20059
Lawler III, E.E., Mohrman, S., & Benson, G. (2001). Organizing for high performance: Employee involvement, TQM, reengineering, and knowledge management in the fortune 1000. The CEO report Jossey-Bass.