Complex Systems Informatics and Modeling Quarterly CSIMQ, Issue 5, December 2015/January 2016, Pages 61-81 Published online by RTU Press, https://csimq-journals.rtu.lv http://dx.doi.org/10.7250/csimq.2015-5.05
ISSN: 2255-9922 online
Usability Evaluation of Variability Modeling by means of Common
Variability Language
Jorge Echeverria1, Jaime Font1, Oscar Pastor2 and Carlos Cetina1
1 SVIT Research Group, Escuela Politécnica Superior, Universidad San Jorge, Zaragoza, Spain 2Research Center on Software Production Methods, Universitat Politècnica de Vàlencia, Valencia, Spain
[email protected], [email protected], [email protected], [email protected]
Abstract. Common Variability Language (CVL) is a recent proposal for OMG's upcoming Variability Modeling standard. CVL models variability in terms of Model Fragments. Usability is a widely-recognized quality criterion essential to warranty the successful use of tools that put these ideas in practice. Facing the need of evaluating the usability of CVL modeling tools, this paper presents a Usability Evaluation of CVL applied to a Modeling Tool for firmware code of Induction Hobs. This evaluation addresses the configuration, scoping and visualization facets. The evaluation involved the end users of the tool whom are engineers of our Induction Hob industrial partner. Effectiveness and efficiency results indicate that model configuration in terms of model fragment substitutions is intuitive enough but both scoping and visualization require improved tool support. Results also enabled us to identify a list of usability problems which may contribute to alleviate scoping and visualization issues in CVL.
Keywords: Usability evaluation, Common Variability Language, modeling variability.
1 Introduction
Common Variability Language (CVL) has been recently proposed by the architectural board of the OMG as Variability Modeling standard [1]. CVL expresses variability among models in terms of Model Fragments such as Placement Fragments (variation points) and Replacement Fragments (variants). The materialization of product models is performed by means of Fragment Substitutions between a Base Model (Placements) and a Model Library (Replacements).
CVL has gained momentum as domain-independent language for specifying and resolving variability [2], [3], [4]. Although it seems that CVL ideas can realize the main facets of variability modeling tools (Configuration, Scope and Visualization), to the best of our knowledge there are no experimental studies that answer this question.
Usability is a widely-recognized quality criterion essential to warranty the successful use of tools that put the above ideas in practice. This paper presents a usability evaluation of a Modeling Tool augmented with CVL (MT+CVL). The research question addressed by this evaluation is: Are Modeling Tools augmented with CVL intuitive enough to perform the main facets of variability modeling approaches (configuration, scope and visualization)?
62 explicit definition of variability) but we have augmented their modeling tool with CVL in order to model the variability existing among their products.
Our Usability Evaluation comprises both (1) test methods (involving end users) such as Performance Measurement, Satisfaction Questionnaire and Interview and (2) inspection methods (not involving end users) such as Keystroke-Level Model [6]. The human computer interaction research community advises to combine these methods to achieve reliable assessment. The selected Usability Evaluation Methods enable us to (1) assess effectiveness, efficiency and satisfaction and (2) to identify usability problems.
Effectiveness and efficiency results (configuration tasks 85% and 132.2%, scoping tasks 65% and 49.93%, visualization tasks 88% and 64.62%) indicate that model configuration in terms of model fragment substitutions is intuitive enough but both scoping and visualization require improved tool support. Results also enabled us to identify a list of usability problems which are relevant for variability adopters, OMG’s variability standardization process and variability tool vendors.
The remainder of this paper is structured as follows: Section 2 discusses related works. Section 3 summarizes the main concepts of the Common Variability Language. Section 4 presents an experimental study to evaluate the usability of the Modeling Tool with CVL. Then, Section 5 describes the results of evaluation and the set of Usability Problems detected. Finally, we conclude the paper in Section 6.
2 Related Work
There are research efforts in literature towards the visualization of SPL (Software Product Line) related artifacts. For instance in [7] the authors present an approach to visualize Pareto-optimal variants (variants, with respect to a set of objectives where no single quality can be improved without sacrificing other qualities). They perform an evaluation experiment showing that the approach can support end-users to perform a set of tasks. In addition [8] presents an approach that employs visualization and interaction techniques to support end users in the process of product derivation. Furthermore [9] argues for the need to support different interactive visualizations of mappings between features and realization artefacts in SPL that can be controlled by developers. These works focus on the visualization facet of a modeling tool; however, they do not attend to scope and configuration facets. In addition, their approaches focus on feature models while our approach targets CVL model fragments concepts
There is a concern in existing literature about the comprehensibility of feature models and possible difficulties for different user groups. For instance, in [4] the authors present an experimental approach in understanding of cross-tree constraints in feature models. Also, in [10] an exploratory experiment is conduced to examine potential comprehension problems in two common variability modeling languages. These works do not address the model fragments substitution of CVL as our work does.
63 There is also a concern about the usability of Domain Specific Languages (DSL) and the tool used to generate them. For instance, in [14] the authors present a comparison between five different development tools to create DSLs (and their associated editors). They take into account different criteria such as graphical completeness, usability, development effort, handling of language evolution, integration with other languages or analysis capabilities. In [15] the authors discuss how user-centered design can be adapted to the context of DSLs development. As a result, they argue that usability should be fostered from the beginning of the DSL development cycle, enabling real people to use the DSL. These research efforts could be used in the context of a variability modeling tool; however, their approach is not focused on specific aspects of this kind of tools, as the three facets evaluated in this paper.
3 Common Variability Language
This section presents the main concepts of the Common Variability Language and how it is applied to model variability. CVL is a Domain Specific Language (DSL) for modeling variability in any model of any DSL based on Meta-Object Facility (MOF) [16], an OMG`s specification to define a universal metamodel for describing modeling languages.
The Common Variability Language (CVL) [17] defines variants of a base model (conforming to MOF) by replacing variable parts of the base model with alternative model replacements found in a library model. CVL has different models: Base Model, Library Model, Variability Specification Model and Resolution Model.
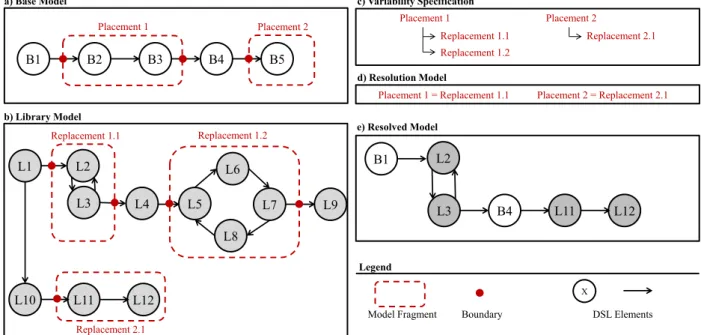
Figure 1.Variability of model fragments in CVL
The Base Model is a model described by a given DSL that serves as the base for different variants defined over it. In CVL, the elements of the base model that are subject to variations are the placement fragments (hereinafter placements). A placement can be any element or set of elements that is subject to variation.
Figure 1a shows an example of a Base Model. In this Base Model, two placements are defined over a simple DSL model: Placement 1 and Placement 2 (depicted by dashed oval lines). The elements of the DSL are circles and arrows.
To define alternatives for a placement, CVL uses a Library Model. The Library Model is described in the same DSL as the base model that will serve as a base. Each one of the alternatives for a placement is a replacement fragment (hereinafter replacement). Similarly to
a) Base Model
Placement 1
Replacement 1.1 Replacement 1.2
c) Variability Specification
Placement 2
B1 B2 B3 B4 B5
Placement 1
b) Library Model
L1 L2
L3 L5
L6
Replacement 1.1
L8
L7 L9
L4
L10 L11 L12
Replacement 1.2
Replacement 2.1
Placement 2
Replacement 2.1
Placement 1 = Replacement 1.1
d) Resolution Model
Placement 2 = Replacement 2.1
e) Resolved Model
B1
B4 L2
L3 L11 L12
X Legend
64 placements, a replacement can be any element or set of elements that can be used as variation for a replacement.
Figure 1 b shows an example of a Library Model. In this Library Model, three Replacements are defined: Replacement 1.1, Replacement 1.2, and Replacement 2.1 (depicted by dashed oval lines).
Each placement and replacement is defined together with its boundaries. The boundaries indicate what is inside or outside each fragment (placement or replacement) in terms of references among other elements of the model. For instance, Placement 1 in Figure 1 has two boundaries depicted by dots.
The CVL Variability Specification Model formalizes the variability among the DSL based on the placements and replacements. For instance, in
Figure 1, Placement 2 can only be substituted by Replacement 2.1, but Placement 1 can be replaced by Replacement 1.1 or Replacement 1.2. The Resolution Model specifies a set of model fragment substitutions that must be performed in order to create a particular configuration of the base model. Each substitution references a placement (Base Model) and a replacement (Library Model). For instance, the Resolution Model in
Figure 1 specifies the following model fragment substitutions: Placement 1 = Replacement 1.1, and Placement 2 = Replacement 2.1.
The materialization of a Resolution Model produces a Resolved Model. For each fragment substitution of the Resolution Model, the materialization process removes elements of a placement and injects elements of a replacement. When a substitution is materialized, the
Resolved Model (with placements substituted by replacements) continues to conform to the same metamodel of the Base Model and the Library Model. The bottom of
Figure 1 shows the Resolved Model that is generated by the materialization of the Resolution Model. The elements of Placement 1 were replaced by the elements of Replacement 1.1, and the elements of the Placement 2 were replaced by the elements of Replacement 2.1.
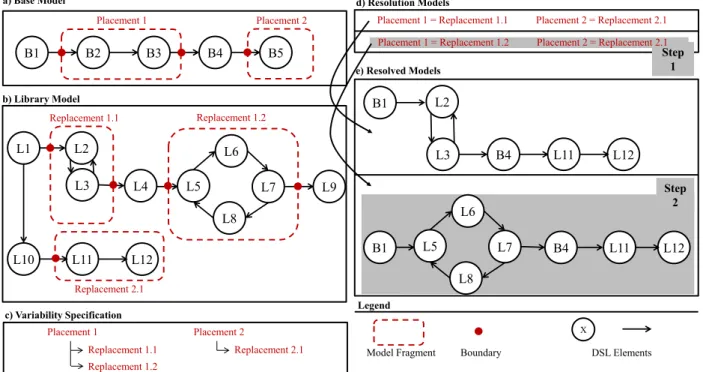
In this work, Configuration tasks address (1) the manipulation of fragment substitutions in a Resolution model and (2) the materialization of the Resolution Model to produce new products according to its fragment substitutions. Figure 2 shows a Configuration task in CVL which involves the following steps.
Figure 2.Configuration task a) Base Model
Placement 1
Replacement 1.1 Replacement 1.2
c) Variability Specification
Placement 2
B1 B2 B3 B4 B5
Placement 1
b) Library Model
L1 L2 L3 L5 L6 Replacement 1.1 L8 L7 L9 L4
L10 L11 L12
Replacement 1.2
Replacement 2.1
Placement 2
Replacement 2.1
Placement 1 = Replacement 1.1
d) Resolution Models
Placement 2 = Replacement 2.1
e) Resolved Models
B1
B4 L2
L3 L11 L12
X Legend
Model Fragment Boundary DSL Elements
Step 1
Step 2
Placement 1 = Replacement 1.2 Placement 2 = Replacement 2.1
B1 L5 B4 L11 L12
L6
65 Step 1. In the Resolution Model, a new resolution model (depicted with gray background
in d of Figure 2), is created with the substitutions of Placement 1 by Replacement 1.2 and Placement 2 by Replacement 2.1.
Step 2. The above new resolution model is materialized generating a new resolved model (depicted with gray background in e of Figure 2).
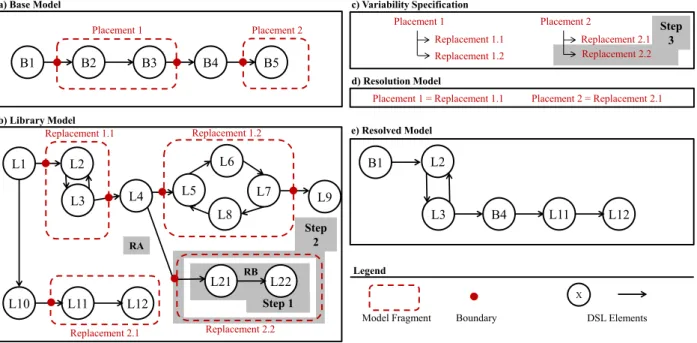
Figure 3. Scope task
In this work, Scope tasks address the explicit modeling and managing the variability and commonality into reusable assets. In CVL, this would be the creation, modification or delete of placements (model elements subject to vary), replacements (possible variations) and substitutions (group of a placement and one suitable replacement). Figure 3 shows a scope task to create a new replacement as follows:
Step 1: A new replacement is created in the Library Model (see b of Figure 3). Library Model is extended with DSL elements (L21, L22 and the relations RA and RB).
Step 2: The elements are formalized as a model replacement, in particular, RA relationship plays the role of replacement boundary and L21, RB and L22 conform the replacement itself. The new replacement is named Replacement 2.2 (depicted by a gray background in b of Figure 3).
Step 3: In the variability tree of Placement 2 has been extended with Replacement 2.2 as new leaf (depicted by a gray background in c of Figure 3). Now, the Placement 2 can be substituted by Replacement 2.1 or Replacement 2.2 (the new replacement created at Step 2). Previously, the Placement 2 could only be substituted by Replacement 2.1.
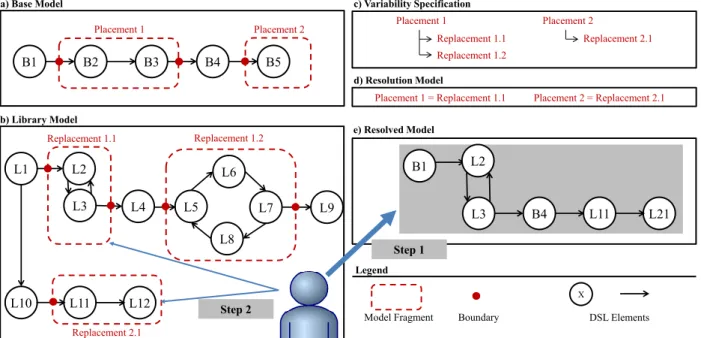
In this work Visualization tasks help to effectively communicate to the end-user those relationships existing among different placements, replacements substitutions and resolutions. That is, make the user aware of the variability model that underlies the products. Figure 4 shows a visualization task which involves the following steps:
Step 1: A resolved model is inspected by the CVL modeler (depicted by a gray background in e of Figure 4).
Step 2: The CVL modeler notices in the Library Model the replacements which conform the resolved model (see b in Figure 4).
a) Base Model
Placement 1
Replacement 1.1 Replacement 1.2
c) Variability Specification
Placement 2
B1 B2 B3 B4 B5
Placement 1
b) Library Model
L1 L2 L3 L5 L6 Replacement 1.1 L8 L7 L9 L4
L10 L11 L12
Replacement 1.2
Replacement 2.1
Placement 2
Replacement 2.1
Placement 1 = Replacement 1.1
d) Resolution Model
Placement 2 = Replacement 2.1
e) Resolved Model
B1
B4 L2
L3 L11 L12
X Legend
66
Figure 4.Visualization task
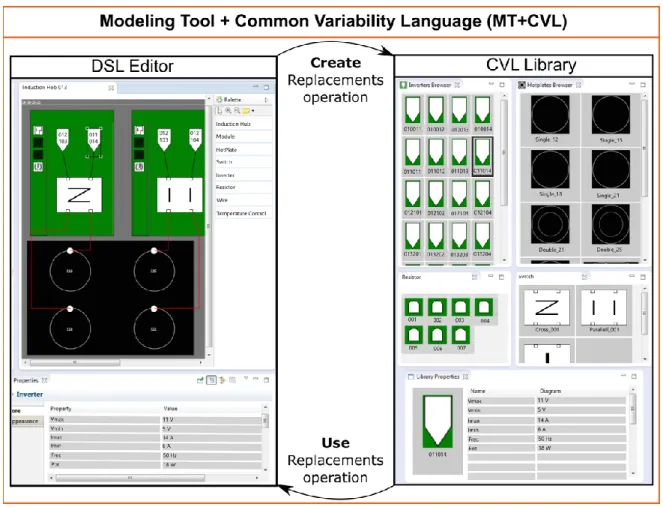
The CVL proposal [18], [19] is designed to work in conjunction with an existing DSL editor. Figure 5 shows an overview of the application of CVL to the given DSL editor. Left part shows the DSL editor itself, while right part represents the library of replacements that will be used to define variants of the base model.
By means of the use replacement operation, users can perform substitutions, including fragments from the library into the model being edited. By means of the create replacement operation, users can create new replacement fragments and incorporate them into the library1.
These are the main elements and operations of CVL, and need to be fulfilled to apply CVL for a given DSL. It is necessary to augment the DSL editor in order to enable the operations defined by CVL, but its application is the same for any given DSL. For further details about the inner workings of CVL see [18], [19].
Figure 5.Modeling Tool augmented with CVL (MT+CVL)
4 Experimental Study
In order to perform the experimental study, we need to define the context of the study. In our case, as we want to evaluate the mechanisms provided by CVL when modeling variability, we are going to use the modeling tool of our industrial partner (an induction hobs company). We have augmented the Modeling Tool with CVL (MT+CVL) enabling the modeling of variability among the induction hobs created by our industrial partner.
1 Example of model fragment operations: http://folk.uio.no/oysteinh/demo1.htm
a) Base Model
Placement 1
Replacement 1.1 Replacement 1.2
c) Variability Specification
Placement 2
B1 B2 B3 B4 B5
Placement 1
b) Library Model
L1 L2
L3 L5
L6
Replacement 1.1
L8
L7 L9
L4
L10 L11 L12
Replacement 1.2
Replacement 2.1
Placement 2
Replacement 2.1
Placement 1 = Replacement 1.1
d) Resolution Model
Placement 2 = Replacement 2.1
e) Resolved Model
B1
B4 L2
L3 L11 L21
X Legend
Model Fragment Boundary DSL Elements
Step 1
67 In order to design the experimental study, there are different Usability Evaluation Methods (hereinafter UEM) described in existing literature. Human computer interaction research community suggest to combine UEMs that involve end users (test methods) with UEMs that do not involve end users (inspection methods), in order to achieve better results in the evaluation [6].
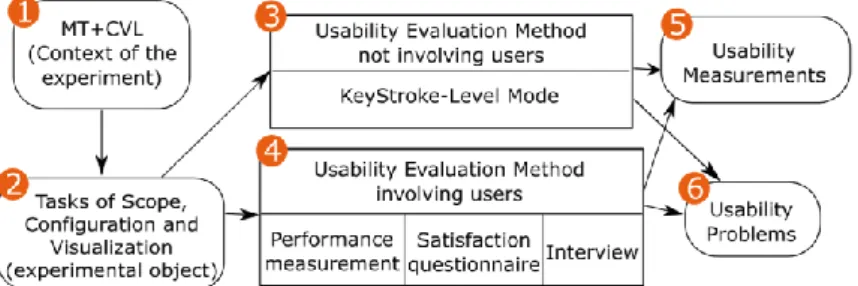
Figure 6. Overview of the Experimental Study
Figure 6 shows an overview of the experimental study that we are going to present through the rest of this paper. First, (1) we present the context of the experiment, the MT+CVL. Then, (2) a set of tasks that represent the three facets of variability modeling are obtained. Next, (3) the selected inspection UEM (without end users) is applied directly to the tasks. Then, (4) we conduct the test UEMs (with engineers from our industrial partner) to measure effectiveness, efficiency and satisfaction. Finally, we present the results obtained, (5) a set of Usability measurements (in terms of efficiency, effectiveness and satisfaction) and (6) a set of usability problems.
4.1 Context of the Experiment
We have applied CVL to the modeling tool of our industrial partner. That is, we have augmented the Modeling Tool including and integrating the CVL operations and library (as presented in Section 3, resulting in the MT+CVL that will be used through the rest of the study. This is the usual operation for augmenting an existing Modeling tool with CVL, and would be the same when applying to any other modeling tool.
The DSL for induction hobs used by our industrial partner is formed by 46 metaclasses, 74 references among them and more than 180 metaclass properties. Induction hobs use electromagnetism to generate heat that is transferred to the cookware. Each induction hob is composed of two power modules and each of them holds two inverters, which are in charge of providing the electrical supply required to generate the magnetic field. Inverters are connected to the inductors, the element where the changing magnetic field is created. Inverters and inductors are connected by a channel, which transfers energy from the inverter to the inductor. The user interface of an induction hob has controllers to configure the power level of each inductor. It has ports to connect each inductor with his controller.
The left part of Figure 7 shows the graphical editor of the models. Whenever an induction hob model is opened, it is shown here. This editor has been generated by means of the Graphical Model Framework (GMF) and enables the user to create and modify models for the DSL (in this case induction hobs). From this editor the user is able to create new models from scratch or to modify existing models (by means of the palette and modifying the properties of the model elements).
68 replacement is included into the library, becoming available to be included into other induction hobs models (by means of the replace operation).
Figure 7. Induction Hob MT+CVL
The right part of Figure 7 shows the replacements library, where all the replacements that are part of the MT+CVL are shown. Each replacement can be any single model element or set of model elements. In particular, the library is divided into inverters replacements (the top-left corner), inductors replacements (the top-right corner), sensors replacements (the bottom-left corner) and inverter nets replacements (the bottom-right corner).
Figure 8 shows the steps to perform a configuration task using the MT+CVL. In this task, a new resolved model (a new induction hob) is created by substitution of a replacement (an inverter) in the model base (an existing induction hob). This task involves two steps:
Step 1: Using the palette of the DSL Editor (the left part of Figure 8) the existing induction hob is shown and the inverter to substitute will be selected (original inverter). Next, a new inverter is selected from Inverters Browser at the CVL Library (the right part of Figure 8) Step 2: By means of a contextual menu, using the mouse right button, the substitution of
the original inverter by the new inverter is performed. Finally, this change is materialized generating a new induction hob model.
Figure 9 shows the steps to perform a scope task using the MT+CVL. Performing this task the user creates a new inverter and he is able to use this new inverter to generate new induction hobs from the base model (an existing induction hob). This task involves three steps:
69
Step 2: By means of a selection and contextual menu the elements are formalized as a replacement. The switch-inverter relationship is the boundary and the inverter is the new replacement.
Figure 8. Configuration task
70
Step 3: By means of a contextual menu the new replacement (a new inverter) is added to the Inverters Browser at the CVL Library (the right part of Figure 9). The Inverters Browser plays the role of variability tree in the Variability Specification.
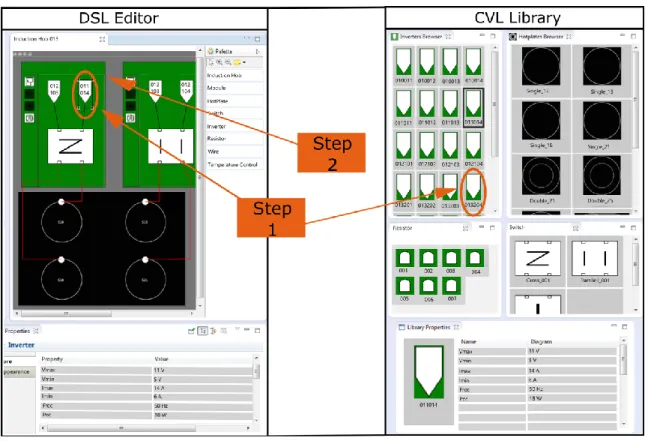
Figure 10 shows the steps to perform a visualization task using the MT+CVL. Performing this task the user notices the replacements of a selected resolved model (an induction hob). This task involves two steps:
Step 1: Using the window of the DSL Editor (the left part of Figure 10) the selected induction hob is shown.
Step 2: By means of a filtering option, all the replacements of the selected induction hob are highlighted in the CVL Library (the right part of Figure 10).
Figure 10. Visualization task
4.2 Experimental Object
A set of open questions in an interview with the end users was used to identify the tasks performed by the end users of the MT+CVL. The open questions are built upon the information stored by software engineers in the phase of requirements capture. The open questions have to help to find information about the people who will use the tool and how they will use the MT+CVL. Some questions were: “Can you explain your work about software of induction hobs?”, “Which are the most difficult tasks?”, “How is the workflow?” or “Which are the most common tasks?”.
71 Taking into account the answers, recording and notes, we summarized the list of tasks. Some tasks in this list are: “To generate a new induction hob”, “To validate an induction hob”, “To modify a particular component in a module of an induction hob”, “To modify an inverter in all modules”, “To detect what component is most widely used” or “To delete a component”.
Later, the end users prioritized the tasks based on frequency and job relevance. For example, the task “To delete a component” achieved less priority than “To know the components of an induction hob” for the end users.
Finally, the set of ordered tasks by the end users was classified by a SPL engineer. The three above facets of a variability modeling tool are used in the classification. The SPL engineer selected representative tasks for each facet. These representative tasks are the tasks with the highest priority by the user.
Every task selected by the SPL engineer was rewritten as an executable task in MT+CVL. For example, the task “How many induction hobs include certain model of inverter?”, a suitable executable task would be “How many induction hobs include the Inverter INV016034 among their components?”.
Six executable tasks, two for each facet of the variability modeling tool, were produced as output2 :
T1 The induction hob IH013 has a problem with the module MOD008 and this module must be replaced by the module MOD014. In the other induction hobs the module MOD008 must not be replaced.
T2 The inverter INV016034 in the module MOD017 in the induction hob IH021 does not run correctly. The module must assemble the inverter INV019034. This replacement must affect every induction hob with the above module.
T3 The induction hob IH021 in the module MOD073 has the inverter INV015034. The parameter VMAX of this inverter is wrong. A new inverter must be created by cloning the wrong inverter. The new inverter has its parameter VMAX equal to 42. The replacement must affect every induction hob with the above module.
T4 The module MOD021 in the induction hob IH003 must replace the inverter INV015042 by the new inverter INV016042. This replacement must not affect other induction hobs.
T5 To detect all components in the induction hob IH021.
T6 Which is the module most widely used of the set of modules (MOD021, MOD014, MOD017, MOD101)?
The tasks (T1) and (T2) are from configuration facet tasks, (T3) and (T4) are from scope facet tasks and, finally, (T5) and (T6) are from visualization facet tasks.
4.3 Evaluation without Users
The specific objective of this phase is to find usability problems with a UEM without end users. The Inspection Method (without end users) has been chosen because it is complementary with the Test Method (with users) [20], [6].
The Inspection Method chosen is Action Analysis. Action Analysis allows predicting the time to complete tasks. Action Analysis is divided into formal and back-of-the envelope action analysis [20]. This method uses the formal approach that is often called Keystroke-Level Model. The Keystroke-Level Model predicts task execution time from a specified design and specific task scenario.
The Keystroke-Level Model is performed by a Usability Engineer in his workplace. This method requires a notable human effort. On the other hand, Action Analysis requires only an
2 The identification of the components has been excluded in order to preserve confidential information. However, omitted
72 evaluator to perform it [6]. To perform the Keystroke-Level Model the usability engineer decomposed every task into a set of subtasks. Later, every subtask is decomposed into a sequence of actions. A duration is associated to each of these actions and then, they are totaled [21].
The Keystroke-Level Model has two phases. The first phase is to determine what physical and mental steps a user performs to complete one or more tasks with the CVL Modeling tool in order to predict the time that the user needs to do the task. To do this, a duration is associated to each one of these actions or sequence of operators (physical or mental), and then they are totaled. This duration is calculated by using the average time that it takes a skilled user to complete the action, as suggested by reference time values of [21]. For example, one keystroke on a standard keyboard is considered to be a physical movement that takes 0.28 seconds, whereas, point with mouse to a target on the display – as the one.
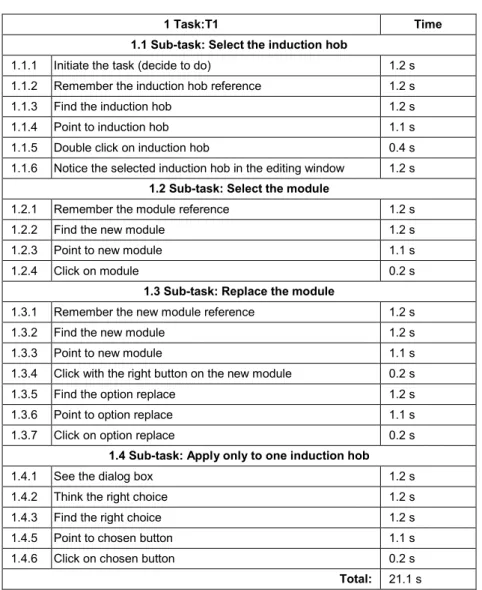
The second phase is to analyze the above steps, looking for problems. Some usability problems that the Keystroke-Level Model might reveal are that it takes too many steps to perform a simple task, or it takes too long to perform the task, or there is too much to learn about the interface, etc. [20]. Furthermore, the amount of time that the user needs to do each task is obtained. In our experiment a Usability Engineer performed every task of Section 4.2. The Usability Engineer performed the Keystroke-Level Model with these tasks. For instance, the task1 is composed by four subtasks and the total time predicted to perform the task is 21.1 seconds (see Table 1 and Table 2).
Table 1. Detailed time prediction for task T1
1 Task:T1 Time
1.1 Sub-task: Select the induction hob
1.1.1 Initiate the task (decide to do) 1.2 s 1.1.2 Remember the induction hob reference 1.2 s 1.1.3 Find the induction hob 1.2 s 1.1.4 Point to induction hob 1.1 s 1.1.5 Double click on induction hob 0.4 s 1.1.6 Notice the selected induction hob in the editing window 1.2 s
1.2 Sub-task: Select the module
1.2.1 Remember the module reference 1.2 s
1.2.2 Find the new module 1.2 s
1.2.3 Point to new module 1.1 s
1.2.4 Click on module 0.2 s
1.3 Sub-task: Replace the module
1.3.1 Remember the new module reference 1.2 s
1.3.2 Find the new module 1.2 s
1.3.3 Point to new module 1.1 s
1.3.4 Click with the right button on the new module 0.2 s 1.3.5 Find the option replace 1.2 s 1.3.6 Point to option replace 1.1 s 1.3.7 Click on option replace 0.2 s
1.4 Sub-task: Apply only to one induction hob
1.4.1 See the dialog box 1.2 s
1.4.2 Think the right choice 1.2 s
1.4.3 Find the right choice 1.2 s
1.4.5 Point to chosen button 1.1 s 1.4.6 Click on chosen button 0.2 s
73
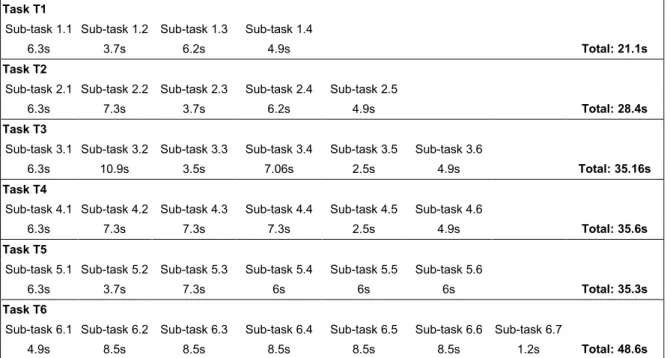
Table 2. Total time prediction for each task
Task T1
Sub-task 1.1 Sub-task 1.2 Sub-task 1.3 Sub-task 1.4
6.3s 3.7s 6.2s 4.9s Total: 21.1s
Task T2
Sub-task 2.1 Sub-task 2.2 Sub-task 2.3 Sub-task 2.4 Sub-task 2.5
6.3s 7.3s 3.7s 6.2s 4.9s Total: 28.4s
Task T3
Sub-task 3.1 Sub-task 3.2 Sub-task 3.3 Sub-task 3.4 Sub-task 3.5 Sub-task 3.6
6.3s 10.9s 3.5s 7.06s 2.5s 4.9s Total: 35.16s
Task T4
Sub-task 4.1 Sub-task 4.2 Sub-task 4.3 Sub-task 4.4 Sub-task 4.5 Sub-task 4.6
6.3s 7.3s 7.3s 7.3s 2.5s 4.9s Total: 35.6s
Task T5
Sub-task 5.1 Sub-task 5.2 Sub-task 5.3 Sub-task 5.4 Sub-task 5.5 Sub-task 5.6
6.3s 3.7s 7.3s 6s 6s 6s Total: 35.3s
Task T6
Sub-task 6.1 Sub-task 6.2 Sub-task 6.3 Sub-task 6.4 Sub-task 6.5 Sub-task 6.6 Sub-task 6.7
4.9s 8.5s 8.5s 8.5s 8.5s 8.5s 1.2s Total: 48.6s
4.4 Evaluation with Users
The objectives of this phase are the assessment on usability measures and the identification of usability problems. To achieve these objectives the following UEMs are used: Demographic Questionnaire, Performance Measurement, Satisfaction Questionnaire and Interviews. These UEMs are characterized by the participation of the end users. The evaluation with users was as follows:
1. End users were given information about the goals and objectives of the evaluation. They were told that it is not a test of their abilities. They were also informed that their interaction will be recorded.
2. End users attended a small tutorial about the MT+CVL.
3. End users were asked to fill in a demographic questionnaire prior to the testing.
4. End users were then given a series of clear instructions that were specific for the Performance Measurement. They were advised to try to accomplish the tasks without any assistance, and that they should only ask for help if they felt unable to complete the task on their own.
5. End users were asked to complete the six tasks detailed in the section Experimental Object (see Section 4.2). To avoid a possible ceiling effect, there was no time limit to complete the tasks.
6. End users were then asked to complete a System Usability Scale questionnaire.
7. Finally, end users were asked to answer questions in an interview about CVL Modeling tool.
Demographic Questionnaire The evaluation involved the end users of the tool who are engineers of our Induction Hob industrial partner. The human computer interaction research advises to use five end users in the usability test to obtain 80% of the usability problems [22]. For this reason, we chose a usability evaluation with five end users.
74 The questions of the demographic questionnaire were about their job description, time working in the actual department (years), age, gender, hours a day working with the software of induction hob, knowledge about IDE Eclipse, knowledge about tools to generate software. Table 3 shows the characteristics of end users.
Table 3. Characteristics of users
Gender Age Education Level Job
Hours a day working with software
Knowledge IDE Eclipse
Experience with modeling
tools
User 1 M 33 Engineer degree Electronic engineer 7 No No
User 2 M 45 Engineer degree Electronic engineer 8 Yes Yes
User 3 M 31 Engineer degree Electronic engineer 7 Yes Yes
User 4 M 30 Engineer degree Electronic engineer 8 Yes No
User 5 M 35 Engineer degree Electronic engineer 3 No No
Performance Measurement The goal of this evaluation step was to evaluate how well or poorly the MT+CVL performed for users. Specifically, we measured user effectiveness and efficiency (ISO 1998). An Instructor, an Evaluator and five end users participated in the study. The function of Instructor was to explain the test to the end users and to solve doubts of the end users. Thegoal of Evaluator was to collect data about the end users action.
In this UEM users performed a predefined set of test tasks (see 4.2) while time and error data was collected. Quantitative data includes performance times, error rates, completed tasks or number of assistance. This data enables the calculation of efficiency andeffectiveness. Usability problems will come from the notes that the Evaluator has taken during the test or extracted from an audio or video recording of the session. Measures of effectiveness take into account percent of right finished unassisted tasks, percent of right assisted tasks, frequency of assists to the participant. The assistance value is the number of times users asked for help to perform the tasks. The efficiency value is the ratio between percent of right finished unassisted tasks and the time to finish these tasks according to Common Industry Format (CIF) for Usability Test Reports [23].
In terms of frequency of assistance, Table 4 shows that the configuration and scope tasks are ones for which the users required assistance. User 2 required assistance on two occasions in configuration tasks, and User 1 required assistance in one scope task. User 2 managed to perform the configuration task after assistance compared to User 1 who did not manage to progress after assistance with the scope task. On the other hand, the visualization tasks did not require assistance. This indicates that the visualization tasks were the least difficult tasks.
With regard to tasks finished correctly, four users correctly performed the configuration tasks, three users correctly completed the visualization tasks. On the other hand, only User 4 correctly performed the scope task. This reveals that the scope tasks were the most difficult tasks.
75
Table 4. Results of Effectiveness and Efficiency
User Task Unassisted Task Effectiv. (%) Assisted Task Effectiv. (%) Time (min)
Completion rate/ Task
time
Assistance
Configuration
1 T1 100% 0% 0.73 136.36% 0
T2 100% 0% 1.63 61.22% 0
2 T1 23% 66% 0.16 206.25% 1
T2 20% 25% 0.16 125.00% 1
3 T1 100% 0% 0.62 162.16% 0
T2 100% 0% 1.25 80.00% 0
4 T1 100% 0% 0.60 166.67% 0
T2 100% 0% 2.23 44.78% 0
5 T1 100% 0% 0.50 200.00% 0
T2 100% 0% 0.72 139.53% 0
Mean 85% 9% 0.86 132.20% 0.2
Std dev 31% 21% 0.66 55.47% 0.42
Min 20% 0% 0.16 44.78% 0
Max 100% 0% 2.23 206.25% 1
Scope
1 T3 0% 61% 4.80 0.00% 1
T4 16% 0% 0.57 28.24% 0
2 T3 100% 0% 1.20 83.33% 0
T4 16% 0% 1.13 14.12% 0
3 T3 60% 0% 0.87 69.23% 0
T4 100% 0% 3.12 32.09% 0
4 T3 100% 0% 3.20 31.25% 0
T4 100% 0% 1.35 74.07% 0
5 T3 60% 0% 2.18 27.48% 0
T4 100% 0% 1.72 139.53% 0
Mean 65% 6% 1.91 49.93% 0.1
Std dev 41% 19% 1.39 41.52% 0.32
Min 0% 0% 0.57 0.00% 0
Max 100% 61% 4.8 139.53% 1
Visualization
1 T5 36% 0% 0.82 44.08% 0
T6 100% 0% 1.05 95.24% 0
2 T5 100% 0% 0.92 109.09% 0
T6 100% 0% 1.80 55.56% 0
3 T5 100% 0% 6.68 14.96% 0
T6 100% 0% 0.90 111.11% 0
4 T5 100% 0% 1.75 57.14% 0
T6 47% 0% 2.32 20.29% 0
5 T5 100% 0% 1.12 89.55% 0
T6 100% 0% 2.03 49.18% 0
Mean 88% 0% 1.94 64.62% 0
Std dev 25% 0% 1.75 34.85% 0.00
Min 36% 0% 0.82 14.96% 0
Max 100% 0% 6.68 111.11% 0
76 questions with a Likert scale. In the SUS original was replaced the word “system” by “Variability Modeling tool”.
SUS, with only ten questions, yields reliable results [24]. The SUS questions address different aspects of the user's reaction to the CVL Modeling tool as a whole (e.g., “I found the Variability Modeling tool unnecessarily complex”, “I felt very confident using the Variability Modeling tool”) as opposed to asking the user to assess specific features of the system (e.g., visual appearance, organization of information, etc.).
The data collected with SUS must be introduced in a spreadsheet to process them. The SUS questionnaire is composed by ten questions with a scale from 1 to 5. Each item's score contribution ranges from 0 to 4. For items 1, 3, 5, 7, and 9 (the positively worded items) the score contribution is the scale selected by end user minus 1. For items 2, 4, 6, 8, and 10 (the negatively worded items), the contribution is 5 minus the scale selected by end user. Finally, it is multiplied the sum of the scores by 2.5 to obtain the overall value of SUS [25]. Table 5 shows the mean results of the SUS questionnaire. The results show that the end users classified the CVL Modeling tool as “good”, as suggested by [26].
Table 5. Results of Satisfaction Questionnaire
Question
number Question
Normalized results
1 I think that I would like to use this Variability Modeling tool frequently 75%
2 I found the Variability Modeling tool unnecessarily complex. 75%
3 I thought the Variability Modeling tool was easy to use. 60%
4
I think that I would need the support of a technical person to be able to use this
Variability Modeling tool. 70%
5 I found the various functions in this Variability Modeling tool were well integrated. 70%
6 I thought there was too much inconsistency in this Variability Modeling tool. 85%
7 I would imagine that most people would learn to use this Variability Modeling tool very quickly. 75%
8 I found the Variability Modeling tool very cumbersome to use. 85%
9 I felt very confident using the Variability Modeling tool. 60%
10
I needed to learn a lot of things before I could get going with this Variability
Modeling tool. 75%
Total: 73%
Interview The last UEM used in this phase is Interview. The objectives of this interview were (1) to determine the understanding by the end user of the CVL Modeling tool and (2) to obtain qualitative data from user comments.
The Interview Questions to perform this step were open questions and closed questions. The closed questions were directed to check the understanding of the tasks in the MT+CVL by the end users. For instance, the Instructor showed two pictures to the end user with the state of the CVL Modeling tool after a task and the end user had to choose which picture is the correct. The open questions aim was to detect the parts of the MT+CVL that were more problematic from a usability point of view, along with the real causes of the problems [27]. For instance, the question was “What have been the more difficult of the tasks for you?”.
5 Usability Problems
77 However, we have detected some Usability Problems (UP). Some of the UPs detected are generic, could be found in any kind of software and are not directly related to the CVL concepts and operations. For instance, the size of some labels and buttons, the lack of resemble between icons and the represented action.
For each of the CVL related UPs extracted from the analysis of the data, we fill a template similar to the one proposed by [28], indicating the ID of the UP, the name of the UP (Name), the description of the UP (Description), the classification of the UP (Ergonomic Criterion), the usability evaluation method used to detect the UP (UEM source) and the number of occurrences for that particular UP (# of occurrences). In order to determine the Ergonomic Criterion of each UP we have attended to the Bastien and Scapin ergonomic criteria classification [29]. In addition, for each UP we propose a solution to mitigate the problem and an advice to future tool designers. These solutions and advices are expressed in terms of CVL elements to be domain independent and to ease its application into any tool using CVL regardless of the domain of the SPL.
UP1
- Name: The concrete syntax of the fragments leads the end users to miss variation points in the models.
- Description: If different fragments have the same concrete syntax in the editor of resolved models and in the library, then the end-users fail to realize the differences among library replacements. On the other hand, if a fragment has different concrete syntax in the editor of resolved models and in the library, then the end-users do not notice the replacement of the resolved model as a variation point.
- Ergonomic Criterion: Guidance - Grouping/distinction of items.
- UEM source: Interview.
- # of occurrences: 3
- Proposed solution: Each replacement in resolved models should be marked to be recognized as a variation point. That is, all the variation points will share a mark to indicate that they can be modified. Furthermore, different replacements for a variation point will share a common base representation element (to indicate that they can be interchanged) but will have also an individual representation element (to distinguish between different replacements).
- Advice: Variability Language should improve its concrete syntax to highlight the role of fragments as variation points or options.
UP2
- Name: Navigation from replacements library to resolved model is not direct.
- Description: End-user usually browses the replacements from the replacement library and then wants to open a particular resolved model using that replacement. However, this is not straightforward and the navigation needs to be performed with the support of a filter. Therefore, replacements should be able to present a list of resolved models using them in order to enable end-user to open the models in a quick way.
- Ergonomic Criterion: Adaptability – Flexibility.
- UEM source: User task & Interview.
- # of occurrences: 4
- Proposed solution: The inclusion of a direct way of navigation from a particular replacement to a resolved model using that replacement. In particular, we added double click functionality to show the list of resolved models using that particular replacement. Then the user can choose from that subset of resolved models using the selected replacement directly.
78
UP3
- Name: Lack of support to select the scope of a property change performed over a replacement.
- Description: In the context of a replacement properties modification (which is being used in several product models), the end-user wants to control the scope of spread of the changes performed. That is, when a replacement that is used in several resolved models changes, the user should have control of which resolved models (using the modified replacement) should be affected by the change.
- Ergonomic Criterion: Adaptability – Flexibility.
- UEM source: User task & Interview.
- # of occurrences: 4
- Proposed solution: When the user changes the value of a property from a replacement that is used by more than one resolved model we show a list of resolved models. This list includes the resolved models using the replacement being modified and the user can select the resolved models that will be affected by the change. If all of them are selected, the replacement is directly modified. If only some are selected, the replacement is duplicated and the new replacement is modified and added to the resolved models selected by the user (so the rest of resolved models remain unchanged).
- Advice: The tools should include support for awareness of the ramifications of replacement changes.
UP4
- Name: Lack of feedback when new replacements are created implicitly.
- Description: In the context of an implicit creation of a replacement (for instance, in the previous problem description, when the change is spread only to some resolved models, there is a need to create a replacement), the user wants to be notified of this implicit creation of replacement. Otherwise, the user is not sure whether the operation was performed successfully and all the resolved models were updated correctly or not.
- Ergonomic Criterion: Guidance - Immediate Feedback.
- UEM source: User task & Interview.
- # of occurrences: 6
- Proposed solution: Given the complexity of some operations (like modification of properties that involve creation of new replacements) we propose the inclusion of a report after the execution of a complex task. That is, after a complex task is performed, we show a report indicating what elements were involved and what modifications were performed over them.
- Advice: The tools should provide feedback to the user when a new replacement is created implicitly.
UP5
- Name: Lack of support to create new Replacement explicitly.
- Description In the context of a product derivation, the end-user sometimes needs to create a new replacement, and tries to do so by means of a contextual menu entry or even keyboard shortcuts. There is a lack of an explicit method to create replacements, the only procedure to create new replacements is by implicit means, changing a replacement and not spreading changes to all resolved models using it. In addition, the explicit method to create replacements should address reuse and redundancy requirements (not allow duplicates, and enable the end-user to create the new replacement from an existing one and then modify it).
- Ergonomic Criterion: Adaptability – Flexibility.
79
- # of occurrences: 4
- Proposed solution: We have included two means to create new replacements. First, each replacements library includes a “new” button to create a new replacement from scratch. Secondly, a contextual menu is created for each model fragment enabling the creation of a new replacement using the selected one as the base. When selected, the replacement is duplicated and the new copy is opened to be modified by the user. Whenever a new replacement is saved after editions, it is necessary to check for duplicates, ensuring that there are no two identical replacements in the library. If a duplicate is detected, the user is informed and supported with information to address the issue (each replacement is presented with the list of resolved models using it and the user can modify any of the duplicates or merge them).
- Advice: The tools should contain support for the detection of model fragments clones.
UP6
- Name: Lack of support to compare Replacements.
- Description In the context of a product configuration, the end-user needs to determine which replacement out of several replacements best meets his current needs. That is, the end-user wants to perform comparisons between replacements to determine which one should be used in that particular product.
- Ergonomic Criterion: Adaptability – Flexibility.
- UEM source: Interview.
- # of occurrences: 1
- Proposed solution: We propose to include means to compare two replacements. In particular, we have implemented a table-based view to present several replacements with all their properties and highlighting the differences. In addition we also show the resolved models that use each of the replacements being compared. By using this comparison tool, the user can find replacements that meet particular requirements and determine if any of the existing replacements fits them or find the best candidate to be used as the base of a new replacement (using the creation of new replacements proposed in UP5).
- Advice: The tools should include support to compare model fragments.
UP7
- Name: Lack of Replace Operation at Library level.
- Description In the context of a product configuration, Replace Operation enables end-user to perform replaces of a replacement being used in a resolved model (opened in the editor) by replacements from the library. Then, the changes can be spread to other models using that particular replacement that is being substituted. When the user wants to perform a replace operation (change one replacement by another) and spread it to all the resolved models using that replacement, there is no point in opening a single resolved model (out of all the resolved models using that replacement) and perform the replace on it. Therefore, we need to enable user to perform replace operation at library level and not only at product model level.
- Ergonomic Criterion: Adaptability – Flexibility.
- UEM source: User task & Interview.
- # of occurrences: 5
80 menu of a replacement and select the option “substitute by”. Then, the user selects the replacement that will be used as a substitute.
- Advice: The replace operation should be allowed at library level.
6 Conclusion
We believe the results of the usability evaluation are relevant to model-based software developers, OMG’s variability standardization process and variability tools vendors as follows.
From the point of view of model-based software developers, as the case of our industrial partner, the usability evaluation results suggest that CVL can complement their current modeling tools to formalize and configure variability (according to the result of Effectiveness and Efficiency of variability tasks). The CVL library of model fragments turns out to enable them to shift from a Clone & Own approach to a systematic reuse of model fragments.
From the point of view of current OMG’s variability standardization process this paper provides evidence that the current CVL proposal should be extended to provide a concrete syntax for the model fragment concepts. That is, the current CVL proposal introduces the concepts of model placement and model replacement but the proposal lacks a concrete syntax to denote the model fragment boundaries. This lack of concrete syntax leads modelers to miss variation points in the models (UP1).
Finally, from the point of view of tool vendors, the usability evaluation results reveal that modelers require new editing capabilities to work with independent model fragments such as explicit creation (UP4, UP5), fragment comparison (UP6), fragment-based filters (UP2) and propagations of changes (UP3, UP7).
References
[1] Ø. Haugen, “Common Variability Language (CVL) - OMG Revised Submission,” in OMG Doc. ad/2012-08-05, 2012.
[2] S. Ben Nasr, N. Sannier, M. Acher, and B. Baudry, “Moving Toward Product Line Engineering in a Nuclear Industry Consortium,” in Proc. the 18th International Software Product Line Conference, vol. 1, pp. 294–303, 2014. Available: http://dx.doi.org/10.1145/2648511.2648545
[3] D. Van Landuyt, S. de beeck, A. Hovsepyan, S. Michiels, W. Joosen, S. Meynckens, G. de Jong, O. Barais, and M. Acher, “Towards Managing Variability in the Safety Design of an Automotive Hall Effect Sensor,” in Proc. the 18th International Software Product Line Conference, vol. 1, pp. 304–309, 2014. Available: http://dx.doi.org/10.1145/2648511.2648546
[4] I. Reinhartz-Berger, K. Figl, and Ø. Haugen, “Comprehending Feature Models Expressed in CVL,” in ACM/IEEE 17th International Conference on Model Driven Engineering Languages and Systems (MODELS), vol. 8767, pp. 501–517, 2014. Available: http://dx.doi.org/10.1007/978-3-319-11653-2_31
[5] N. H. Pham, H. A. Nguyen, T. T. Nguyen, J. M. Al-Kofahi, and T. N. Nguyen, “Complete and accurate clone detection in graph-based models,” in Software Engineering, 2009. ICSE 2009. IEEE 31st International Conference, pp. 276–286, 2009. Available: http://dx.doi.org/10.1109/icse.2009.5070528
[6] A. Holzinger, “Usability engineering methods for software developers,” Commun. ACM, vol. 48, no. 1, pp. 71–74, 2005. Available: http://dx.doi.org/10.1145/1039539.1039541
[7] A. Murashkin, M. Antkiewicz, D. Rayside, and K. Czarnecki, “Visualization and Exploration of Optimal Variants in Product Line Engineering,” in Proc. the 17th Software Product Line Conference, pp. 111–115, 2013. Available: http://dx.doi.org/10.1145/2491627.2491647
[8] G. Botterweck, S. Thiel, D. Nestor, S. bin Abid, and C. Cawley, “Visual Tool Support for Configuring and Understanding Software Product Lines,” in Software Product Line Conference, 2008. SPLC ’08. 12th International, pp. 77–86, 2008. Available: http://dx.doi.org/10.1109/SPLC.2008.32
81
[10] I. Reinhartz-Berger and K. Figl, “Comprehensibility of Orthogonal Variability Modeling Languages: The Cases of CVL and OVM,” in Proc. the 18th International Software Product Line Conference, vol 1, pp. 42–51, 2014. Available: http://dx.doi.org/10.1145/2648511.2648516
[11] P. Grunbacher, R. Rabiser, and D. Dhungana, “Product Line Tools are Product Lines Too: Lessons Learned from Developing a Tool Suite,” in Automated Software Engineering. 23rd IEEE/ACM International Conference on, pp. 351–354, 2008. Available: http://dx.doi.org/10.1109/ase.2008.46
[12] R. Rabiser, D. Dhungana, W. Heider, and P. Grunbacher, “Flexibility and End-User Support in Model-Based Product Line Tools,” in Software Engineering and Advanced Applications, 2009. SEAA ’09. 35th Euromicro Conference, pp. 508–511, 2009. Available: http://dx.doi.org/10.1109/seaa.2009.13
[13] R. Rabiser, P. Grünbacher, and M. Lehofer, “A Qualitative Study on User Guidance Capabilities in Product Configuration Tools,” in Proc. the 27th IEEE/ACM International Conference on Automated Software Engineering, pp. 110–119, 2012. Available: http://dx.doi.org/10.1145/2351676.2351693
[14] D. Amyot, H. Farah, and J.-F. Roy, “Evaluation of Development Tools for Domain-Specific Modeling Languages,” in System Analysis and Modeling: Language Profiles, vol. 4320, R. Gotzhein and R. Reed, Eds. Springer Berlin Heidelberg, pp. 183–197, 2006. Available: http://dx.doi.org/10.1007/11951148_12
[15] A. Bariic, V. Amaral, and M. Goulao, “Usability Evaluation of Domain-Specific Languages,” in Quality of Information and Communications Technology (QUATIC), 2012 Eighth International Conference, pp. 342– 347, 2012. Available: http://dx.doi.org/10.1109/quatic.2012.63
[16] “Meta Object Facility {(MOF)} 2.0 Core Specification,” 2003.
[17] T. Berger, R. Rublack, D. Nair, J. M. Atlee, M. Becker, K. Czarnecki, and A. W\kasowski, “A Survey of Variability Modeling in Industrial Practice,” in Proc. the Seventh International Workshop on Variability Modelling of Software-intensive Systems, pp. 7:1–7:8, 2013. Available: http://dx.doi.org/10.1145/2430502.2430513
[18] Ø. Haugen, B. Møller-Pedersen, J. Oldevik, G. K. Olsen, and A. Svendsen, “Adding Standardized Variability to Domain Specific Languages,” in Proc. the 2008 12th International Software Product Line Conference, pp. 139–148, 2008. Available: http://dx.doi.org/10.1109/SPLC.2008.25
[19] F. Fleurey, Ø. Haugen, B. Møller-Pedersen, G. K. Olsen, A. Svendsen, and X. Zhang, “A Generic Language and Tool for Variability Modeling,” Tech. Rep. SINTEF A13505, 2009.
[20] S. Abrahão, E. Iborra, and J. Vanderdonckt, “Usability Evaluation of User Interfaces Generated with a Model-Driven Architecture Tool,” in Maturing Usability, pp. 3–32, 2008. Available: http://dx.doi.org/10.1007/978-1-84628-941-5_1
[21] D. Kieras, “Using the keystroke-level model to estimate execution times,” Univ. Michigan, 2001.
[22] R. A. Virzi, “Refining the test phase of usability evaluation: how many subjects is enough?,” Hum. Factors J. Hum. Factors Ergon. Soc., vol. 34, no. 4, pp. 457–468, 1992.
[23] ANSI/NCITS, “ANSI/NCITS-354 Common Industry Format (CIF) for Usability Test Reports,” 2001.
[24] T. S. Tullis and J. N. Stetson, “A comparison of questionnaires for assessing website usability,” in Usability Professional Association Conference, pp. 1–12, 2004.
[25] J. Brooke, “SUS: A Retrospective,” J. Usability Stud., vol. 8, no. 2, pp. 29–40, 2013.
[26] A. Bangor, P. Kortum, and J. Miller, “Determining what individual SUS scores mean: Adding an adjective rating scale,” JUS, vol. 4, no. 3, pp. 114–123, 2009.
[27] N. Juristo and X. Ferré, “How to integrate usability into the software development process,” in ICSE, pp. 1079–1080, 2006. Available:http://dx.doi.org/10.1145/1134285.1134515
[28] N. Condori-Fernández, J. I. Panach, A. I. Baars, T. E. J. Vos, and O. Pastor, “An empirical approach for evaluating the usability of model-driven tools,” Sci. Comput. Program., vol. 78, no. 11, pp. 2245–2258, 2013. Available: http://dx.doi.org/10.1016/j.scico.2012.07.017