ЕКСПЛУАТАЦІЯ ТА РЕМОНТ ЗАСОБІВ ТРАНСПОРТУ
UDC 629.424.1.018-82:004.318
I. V. ZHUKOVYTSKYY
1*, I. A. KLIUSHNYK
2*1*Dep. «Electronic Computing Machines», Dnipropetrovsk National University of Railway Transport named after Academician V. Lazaryan, Lazaryan St., 2, Dnipro, Ukraine, 49010, tel. +38 (056) 373 15 89, e-mail ivzhuk@mail.ru, ORCID 0000-0002-3491-5976
2*Dep. «Electronic Computing Machines», Dnipropetrovsk National University of Railway Transport named after Academician V. Lazaryan, Lazaryan St., 2, Dnipro, Ukraine, 49010, tel. +38 (056) 373 15 89, e-mail klugran@i.ua, ORCID 0000-0001-9939-0755
CHOICE OF THE OPTIMAL PARAMETERS OF MEASURING THE
SHAFT ROTATION FREQUENCY OF THE HYDRAULIC
TRANSMISSION OF THE LOCOMOTIVE USING
MICROCONTROLLER
Purpose. The article provides for finding solution to the problem of developing and improving the means for measuring tachometric data of the previously created information and measuring system for testing hydraulic loco-motive transmission by substantiating the optimal sensor design and signal processing algorithms. At the same time first of all it is necessary to start from the possibility of modifying the already existing test bench for hydraulic lo-comotive transmissions at the Dnipropetrovsk diesel lolo-comotive repair plant «Promteplovoz». Methodology. In the work, the researchers proposed a methodology for modifying the sensor design and the algorithm for processing its signals. It is grounded on previous developments of tachometric sensor of the optical type on the basis of D-2MMU-2 sensor of the microprocessor automated test bench system of hydraulic locomotive transmission in the locomotive repair plant conditions. Selection of the necessary measurement algorithm and the number of sensor teeth is substan-tiated by calculating instrumental and methodological errors. Also, the studies aimed at identifying the source of interference in the measurement of rotational speed are described and solution for its elimination has been found.
Findings. For the designed rotation speed sensor of the optical type based on the existing D-2MMU-2 sensor, the authors analyzed the dependence of the methodological and instrumental errors. Based on the obtained data more rational variant of the rotation speed calculation algorithm is proposed, and the number of teeth of the sensor disk is justified. Further, the main source of measurement interference was established and a method for improving the hardware of the hydraulic locomotive test bench was proposed. Originality. There were conducted the studies ac-cording to the methodological and instrumental errors of the designed rotation speed of sensor. The mechanisms of interference filtering arising from the sensor rotation speed fixing were proposed. Additional studies have shown the need for a hardware revision of signal conditioner scheme. Practical value. Conducted studies make it possible to establish a rational number of sensor disk teeth, which allows improving the measurement algorithm. It was also performed a hardware improvement of signal conditioner scheme from the sensor, helping to get rid of interferences. The results of measurements in studies are the initial data to perform further studies in order to determine the techni-cal condition of hydraulic transmission UGP 750-1200 during factory testing after repair.
Key words: tachometer sensor; 2MMU-D-2; hydraulic transmission; hydraulic transmission test; testbench; in-formation-measuring system
Introduction
Today in Ukraine, the hydraulic transmission is tested using the outdated test-benches designed in Soviet times, in particular at the repair plants of
diesel locomotives and military equipment with hydraulic transmission. Also, there is no standardi-zation of the production of these test-benches.
transmis-sion test-bench at DZRT «Promteplovoz» plant it was revealed that the installed thereon analogue control devices are out-of-date. In the first stage of development in accordance with the plant test pro-gram the most necessary and critical 13 process parameters were selected. Information about which received from the sensors is processed by the mi-crocontroller and PC [9].
Information about the rotation frequency of the drive motor, the generator, the turbine shaft is measured using D-2MMU-2 tachometer sensors [6], which transmit the pre-processed analogue signal to a special converter and then to ATMEL microcontroller for its further processing and transmission by USB 2.0 interface to the computer [9].
D-2MMU-2 sensor is nothing but an alternator, which has a critical flaw – at relatively low speeds (established experimentally at about 80 min-1) the
voltage amplitude produced by the alternator is not sufficient for the normal error-free measurements (at speeds of about 60 min-1, the amplitude is about
1V, and at 2000 min-1 – 40 V). It is clear that at
very low speeds the amplitude will be several tens of millivolts. To measure such a low voltage in the plant conditions is practically impossible, since, firstly, long communication lines from the test-bench to the measuring equipment may have low voltage blanking and, secondly, at the plant there is a large number of different sources of electromag-netic interferences, which may be laid on commu-nication lines and erroneously recorded as the be-ginning of rotary motion on the test-bench.
On the basis of available equipment of hydrau-lic transmission testbench it was designed the rota-tion frequency sensor of optical type based on the existing sensor 2MMU D-2 [13]. According to the results of plant tests using the sensor prototype it was established the necessary and sufficient time for scanning the control sensor microcontroller, which allowed making changes in the measure-ment algorithm.
Purpose
In the calculations, it was found that changes in instrumental and methodological errors [4], which may be a result of missing and/or averaging the av-eraging, require further investigation. Also, as a re-sult of the tests, the measurement statistics were obtained, which indicates the presence of
interfer-ence that requires the development of filtering mechanisms. It is necessary to identify the exact nature of the interference, which in turn can sim-plify, and, perhaps, completely eliminate the filter-ing mechanisms by makfilter-ing corrections to the hard-ware and softhard-ware part of both the sensor and its interface circuit with the computer of the test bench.
To improve the designed sensor [13] (in order to choose a rational number of the disk teeth and the optimal algorithm for calculating the rotational frequency), it is necessary to calculate the instru-mental and methodological errors that arise during the measurements. Obviously, the instrumental error should increase in proportion to the increase in the number of teeth (due to inaccuracy in their manufacture), and the methodological error on the contrary should fall with the increase in the num-ber of teeth.
Methodology
To calculate the instrumental error, let us repre-sent the calculation of the rotation frequency
ω using the known formula:
60 2
L R
[min
-1], (1)
where ω – is the measured rotation frequency [min-1]; L – arc length between the teeth [mm]; R – distance from the disc center to the middle of the tooth height [mm]; τ –propagation time of the infrared ray of optocoupler of the arc L (period of the signal) [sec].
If the measurement error τ is neglected, then the relative measurement error [13] has the form:
L L
, (2)
where L – is the difference between the actual and theoretical length of the arc L [mm].
Substituting (1) in (2), it is obtained a formula for calculating the relative error (instrumental), taking into account the dependence on the number of teeth: 2 L inst N R ,
oc-cur is not taken into account, as a result of which a methodological error arises. To calculate the methodological error, we will calculate the rota-tional frequency using the following formula:
1
ω 60
N
[min
-1]. (3)
Without considering the instrumental error, the actual rotational frequency can be expressed in terms of the measured rotational frequency at the end of the next measurement period (under the condition of uniform acceleration) according to the formula:
ωact=ωmeas аT[min-1], (4)
where ωact – actual rotational frequency [min-1]; ωmeas – measured rotational frequency [min1]; а –
acceleration [min-1/s2]; T – delay time introduced
by the measurement algorithm [sec]. It follows from (1) that Т .
It was calculated and established that the per-formance of all assembler commands involved in the measurements is quite small value. The influ-ence of this error εΔ is illustrated in Fig. 1.
As it can be seen from Fig. 1, under the given technical conditions, this error is extremely small and it can be neglected.
In this case, the absolute methodological error will have the following form:
ωact ωmeas
[min-1].
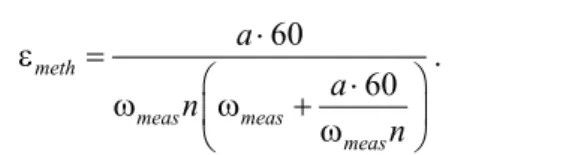
Taking into account (3) and (4), the formula for the relative (methodological) error is:
60 60
meth
meas meas
meas
а а
n
n
.
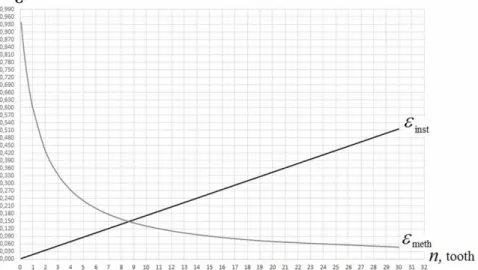
The graphs of the dependence of the instrumen-tal and methodological errors on the number of teeth in the disk with different input parameters are shown in Fig. 2 and Fig. 3.
As it can be seen from Fig. 2, approximately starting from the value of the rotational frequency equal to 200 min-1, it is enough to use a wheel with
one tooth (intersection of methodological and in-strumental errors is the optimum point). Fig. 3 shows that at meas = 20 min-1, to minimize the
error it is sufficient to use about 9 teeth. The accel-eration а was chosen as high as possible.
Summarizing the obtained result, and also in order to simplify the calculating algorithm of rota-tional frequency, it was decided to modify the cal-culation algorithm as follows: up to 50 min-1 (valid
at the average acceleration a = 1.15 min-1/s2 [13])
to perform calculations as earlier, taking into ac-count each period of the signal from the sensor (for a disc of 10 teeth). Starting from the rotational fre-quency greater than 50 min-1 it was decided to take
into account the duration of ten signal periods from the sensor as one measurement period, i.e. simulate a single-tooth disc. This condition practically does not contradict the conclusions made in the work [13], as there it was justified the sufficiency of using every 8th sample of the rotational frequency.
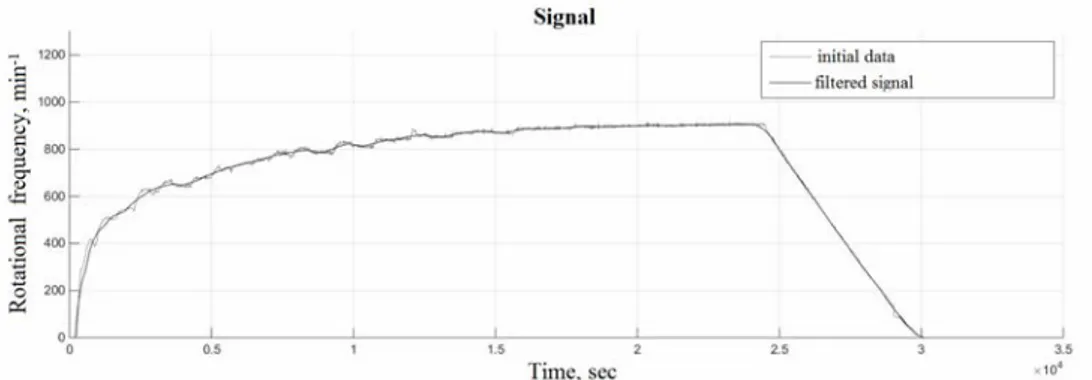
In the process of testing the projected sensor the interferences were detected (Fig. 4).
Fig. 1. Dependence of the deviation εΔ of the measured rotational frequency from
Fig. 2. The graph of the dependence of the instrumental and methodological errors on the number of teeth in the disk atmeas = 200 min-1, a = 10 min-1/s2, Δ
L = 2 mm
Fig. 3. The graph of the dependence of the instrumental and methodological errors on the number of teeth in the disk at meas = 20 min-1, a = 10 min-1/s2, Δ
L = 2 mm
As can be seen from Fig. 4, there is some kind of interferences in the signal from the sensor, as indicated by the spectrum of the signal obtained using the fast Fourier transform [1, 5].
These low-frequency interferences are easily filtered, for example, by arbitrary finite impulse response (FIR) filter [5, 11]. For this purpose, the FIR filter of the 10th order was used filtering the
frequencies up to 10 Hz. As one can see from Fig. 4 has filtered the supposed interferences partially. However, there are visible residual beatings of un-known origin. Of course it is impossible to assert that this interference is of a different nature or it is the specificity of the hydraulic transmission
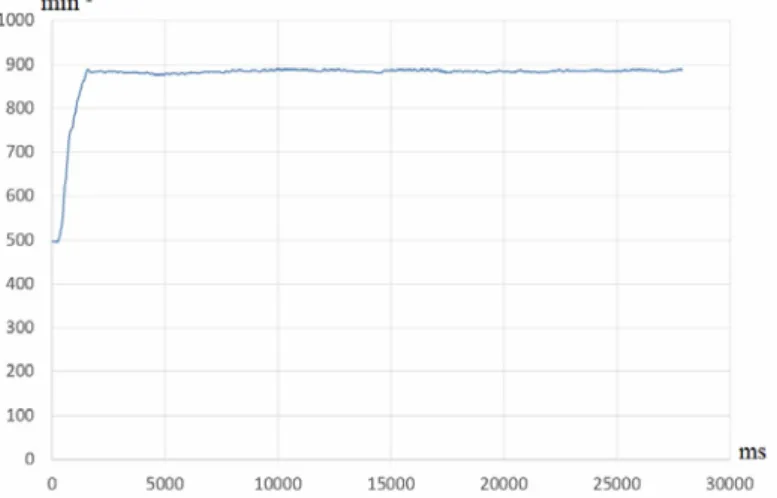
opera-tion (high-precision reference sensor is not available at the factory). These residual interferences can also be easily filtered by moving average algorithm [12] for example, as it is shown in Fig. 5.
Fig. 4. Interferences obtained during sensor tests
Fig. 5. Filtration of interferences using the moving average algorithm
As a result of studies the errors in the program part of the stand were not found. But a potential source of interference was found in the hardware (electronic) part of the stand.
The pulse driver (which go to the input of the microcontroller) was nothing but a Schmitt trigger CD40106BM [8] manufactured by Texas Instru-ments. And, as it is known, such triggers have a wide range of thresholds for both operation and release of the logical unit. This effect is shown in Fig. 6 taken from the official documentation.
Since the fronts of the incoming pulses from the sensor are quite heavily overloaded (as it is shown in Fig. 7), the signal at the output of the driver (Schmidt trigger CD40106BM) will always be of unequal duration, taking into account the
specificity of its operation shown in Fig. 6. Fig. 6. Range of thresholds
Fig. 7. Oscillogram of the front of the signal coming from the sensor
Analysis of the existing microcircuits of single-pass Schmitt triggers showed that they have similar characteristics, as well as for the Schmitt trigger CD40106BM. The way out of this situation is the use of two-input Schmitt triggers, where it is pos-sible to set a fixed operation voltage due to the use of backward communication. The study of the market of existing microcircuits of two-input Schmitt triggers and operational amplifiers was conducted. As a result, it was found that the use of microcircuits of two-input Schmitt triggers is not rational: the operational amplifier makes it possible to set operating voltage more flexible and accurate with minimal deviations, and its cost does not exceed the cost of the Schmit trigger. Therefore, it was decided to make own pulse driver using the operational amplifier LM124 [10].
The driver is constructed according to the scheme shown in Fig. 8
Fig. 8. Scheme of the pulse driver on the operational amplifier
To calculate the driver [3, 7], the following in-put conditions are accepted:
The supply voltage Usup = 4.7 V; The operate voltage Uop = 3 V;
The maximal voltage at the output of the ampli-fier, the received one 1-2 V less than the supply voltage Umax = 3.46 V;
The minimum voltage at the output of the am-plifier is Umin = 0.3 V.
The driver is constructed according to the scheme in Fig. 8.
To calculate the positive feedback resistor R2, it is necessary to determine the hysteresis ΔU of the amplifier. It has been experimentally estab-lished that ΔU = 0.3 V is sufficient for stable operation. Resistor R1 was selected with a nominal of 39 kOhm. Accordingly, based on the results of calculations, R2 = 452.4 kOhm.
To form the bias voltage E0 of the operating point of the amplifier switching, it is calculated by the formula:
0
2
op U
Е U .
Thus, Е0 = 2.85 V. Resistor R4 was selected with a nominal value of 3.3 kOhm. Correspond-ingly, according to the results of calculations
3 2142.11
R Ohm.
To check the accuracy of calculations, it is also necessary to calculate the operating and release voltages of the operational amplifier. To do this, the speed of switching аsw, is required, which for the selected amplifier is 0.1 V/ms [3, 7]. The operating voltage U0→1 is calculated by the formula:
0 1 max
1 2
0
1 2 1 2 sw
R R
U U E a
R R R R
.
The release voltage U1→0 is calculated by the formula:
1 0 min
1 2
0
1 2 1 2 sw
R R
U U E a
R R R R
According to the results of calculations,
0 1 3 V
U , and U1 0 2.55 V. Simulation of this calculated circuit of the driver confirmed the accu-racy of calculations. The oscillograms of the opera-tion simulaopera-tion are shown in Fig. 9.
Fig. 9. The oscillograms of the driver operation simulation
Findings
For the projected optical sensor of the rota-tional frequency based on the existing D-2MMU-2 sensor, the analysis of the methodological and in-strumental errors was performed. Based on the data obtained, a more rational variant of the frequency calculation algorithm was proposed, and the
num-ber of teeth of the sensor disk was justified. The nature of the interferences that occur during data collection was investigated. As a result, the main source of measurement distortion was established and the method for improving the hardware of the hydraulic locomotive test bench, which eliminated this source, was proposed.
Fig. 10. The graph of the performed measurements of the rotational frequency using the pulse driver based on the operational amplifier
Originality and Practical Value
The studies of the dependence of the methodo-logical and instrumental errors of the designed ro-tational frequency sensor were conducted. Rational mechanisms for filtering the interferences that oc-cur when fixing the rotational frequency have been proposed. Additional studies have shown the need for hardware refinement of the signal conditioner circuit. The conducted researches allowed estab-lishing a rational number of the sensor disk teeth, which made it possible to improve the measure-ment algorithm. It was also proposed hardware improvement of the signal conditioner circuit from
the sensor, which made it possible to get rid of in-terferences. The results of the measurements during the studies are the initial data for further research to determine the technical state of the hy-draulic transmission UGP 750-1200 during the factory post-repair tests.
Conclusions
average acceleration a = 1.15 min-1/s2 [13]) to
per-form calculations taking into account every second period of the signal from the sensor ( for 10 teeth disk), and starting from the rotational frequency greater than 50 min-1 to take into account the
dura-tion of ten periods of the signal from the sensor as one period, i.e. to simulate a disk with one tooth. It
was found that the use of a 10-tooth disc is ra-tional. In order to eliminate distortions in the measurements, calculation and testing of the pulse driver from the sensor based on the operational amplifier LM124 was performed on the basis of the used Schmitt trigger CD40106BM.
LIST OF REFERENCE LINKS
1. Воскобойников, Ю. Е. Фильтрациисигналовиизображений: Фурьеивейвлеталгоритмы (спримерами в Mathcad) : монография / Ю. Е. Воскобойников, А. В. Гочаков, А. Б. Колкер ; Новосиб. гос. архитек
-тур.-строит. ун-т (Сибстрин). – Новосибирск : НГАСУ, 2010. – 188 с.
2. Жуковицький, І. В. Вдосконалення методівтазасобіввимірюваннячастотиобертання валагідравліч
-ноїпередачі тепловоза з використанням мікроконтролера / І. В. Жуковицький, І. А. Клюшник // Со
-врем. информ. икоммуник. технологиинатрансп., впром-стииобразовании : тез. ХМеждунар. науч
.-практ. конф. (14.12–15.12.2016 г.) / Днепропетр. нац. ун-т ж.-д. трансп. – Днепропетровск, 2016. –
С. 46–47.
3. Мамий, А. Р. Операционныеусилители / А. Р. Мамий, В. Б. Тлячев. – Майкоп : АГУ, 2005. − 192 с. 4. Рабинович, С. Г. Погрешностиизмерений : науч. изд. / С. Г. Рабинович. – Ленинград : Энергия, 1978. –
261 с.
5. Сергиенко, А. Б. Цифроваяобработкасигналов : учеб. пособие / А. Б. Сергиенко. – 2-еизд. – Санкт
-Петербург : Питер, 2007. – 750 с.
6. ТахометрымагнитоиндукционныедистанционныеТМи [Electronic recourse] // ООО «Саранскиеприбо
-ры». – 2016. – Available at: http://sibspz.ru/pribory-dlya-izmereniya-parametrov-dvizheniya-takhometry/takhometry-magnitoinduktsionnye-distantsionnye-tmi. – Title from the screen. – Accessed : 28.12.2016.
7. Carter, B. Op Amps for Everyone / B. Carter. – 2nd еd. – Texas, USA : Elsevier Science, 2003. – 472 с. 8. CD40106BM/CD40106BC. Hex Schmitt Trigger [Electronic resource] // Texas Instruments. – 2016. –
Avail-able at: http://www.ti.com/lit/ds/symlink/cd40106bm.pdf . – Title from the screen. – Accessed : 28.12.2016. 9. Information-measuring Test System of Diesel Locomotive Hydraulic Transmissions / I. V. Zhukovytskyy,
I. A. Kliushnyk, O. B. Ochkasov, R. O. Korenyuk // Наука тапрогрестранспорту. – 2015. – № 5 (59). –
С. 53–65. doi: 10.15802/stp2015/53159.
10. LMx24-N, LM2902-N. Low-Power, Quad-Operational Amplifiers [Electronic resource] // Texas Instruments. – 2016. – Available at: http://www.ti.com/lit/ds/symlink/lm2902-n.pdf. – Title from the screen. – Accessed : 28.12.2016.
11. Merry, R. J. E. Optimal higher-order encoder time-stamping / R. J. E. Merry, M. J. G. van de Molengraft, M. Steinbuch // Mechatronics. – 2013. – Vol. 23. – Iss. 5. – Р. 481–490. doi: 10.1016/j.mechatronics.2012.10.011.
12. Zhang, L. An open embedded hardware and software architecture applied to industrial robot control / L. Zhang, Р. Slaets, Н. Bruyninckx // IEEE Intern. Conf. on Mechatronics and Automation. – 2012. – Р. 1822– 1828. doi: 10.1109/ICMA.2012.6285098.
13. Zhukovytskyy, I. V. Use of microcontroller for measuring shaft speed of diesel locomotive hydraulic transmis-sion / I. V. Zhukovytskyy, I. A. Kliushnyk // Наукатапрогрестранспорту. – 2016. – № 5 (65). – С. 43–53. doi: 10.15802/stp2016/83990.
І
.
В
.
ЖУКОВИЦЬКИЙ
1*,
І
.
А
.
КЛЮШНИК
2*1*Каф. «Електронніобчислювальнімашини», Дніпропетровськийнаціональнийуніверситетзалізничноготранспорту
іменіакадемікаВ. Лазаряна, вул. Лазаряна, 2, Дніпро, Україна, 49010, тел. +38 (056) 373 15 89, ел. пошта ivzhuk@mail.ru, ORCID 0000-0002-3491-5976
2*Каф. «Електронніобчислювальнімашини», Дніпропетровськийнаціональнийуніверситетзалізничноготранспорту
ВИБІР
ОПТИМАЛЬНИХ
ПАРАМЕТРІВ
ВИМІРЮВАННЯ
ЧАСТОТИ
ОБЕРТАННЯ
ВАЛА
ГІДРАВЛІЧНОЇ
ПЕРЕДАЧІ
ТЕПЛОВОЗА
З
ВИКОРИСТАННЯМ
МІКРОКОНТРОЛЕРА
Мета. Стаття передбачаєзнаходження рішеннязадачірозробки таудосконаленнязасобіввимірювання тахометричних даних раніше створеної інформаційно-вимірювальної системи випробувань гідравлічних передачтепловозівшляхомобґрунтуванняоптимальноїконструкціїдатчикатаалгоритмівобробкисигналу віднього. Прицьомувідштовхуватисянеобхідно, впершучергу, відможливостімодифікаціївжеіснуючого стендувипробуваньгідравлічнихпередачтепловозівнаДніпропетровськомузаводіпоремонтутепловозів
«Промтепловоз». Методика. Уроботідослідникамибулазапропонованаметодикамодифікаціїконструкції датчикатаалгоритмуобробки йогосигналів. Вона спираєтьсянапопереднірозробкитахометричногодат
-чикаоптичного типу наоснові датчика Д-2ММУ-2 мікропроцесорноїавтоматизованої системистендових випробувань гідравлічних передач тепловозів в умовах тепловозоремонтного заводу. Обґрунтовано вибір необхідногоалгоритмувимірюваньікількостізубцівдатчикашляхом розрахунківінструментальноїтаме
-тодичної похибок. Також описані дослідження, спрямовані на виявлення джерела перешкод при вимірах частотиобертаннятазнайденорішеннящодойогоусунення. Результати. Дляспроектованогодатчикачас
-тотиобертанняоптичноготипунаосновівжеіснуючогодатчикаД-2ММУ-2 авторамибуловиконаноаналіз залежностіметодичноїтаінструментальноїпохибок. Запропоновано, наосновіотриманихданих, більшра
-ціональнийваріанталгоритмурозрахункучастотиобертання, атакожобґрунтованакількість зубців диска датчика. Далібуловстановленоосновнеджерелоперешкодвимірівтабувзапропонованийспосібудоскона
-ленняапаратноїчастинистендувипробуваньгідравлічнихпередачтепловозів. Науковановизна. Булипро
-ведені дослідження залежності методичної та інструментальної похибок спроектованого датчика частоти обертання. Запропоновані механізми фільтрації перешкод, що виникають при фіксації частоти обертання датчиком. Додатковідослідженняпоказалинеобхідність апаратногодоопрацюваннясхеми формувачасиг
-налу. Практичназначимість.Проведенідослідження дозволиливстановити раціональну кількість зубців
дискадатчика, щодаломожливістьудосконалитиалгоритмвимірювань. Такожбуловиконаноапаратнепо
-ліпшеннясхемиформувачасигналувіддатчика, щодозволилопозбутисяперешкод. Результативимірювань придослідженняхєвихіднимиданимидлявиконанняподальшихдослідженьізметоювизначеннятехнічно
-гостанугідравлічноїпередачіУГП 750-1200 підчасзаводськихпісляремонтнихвипробувань.
Ключові слова: тахометричний датчик; Д-2ММУ-2; гідравлічна передача; випробування гідропередач;
випробувальнийстенд; інформаційно-вимірювальнасистема
И
.
В
.
ЖУКОВИЦКИЙ
1*,
И
.
А
.
КЛЮШНИК
2*1*Каф. «Электронныевычислительныемашины», Днепропетровскийнациональныйуниверситетжелезнодорожного
транспортаимениакадемикаВ. Лазаряна, ул. Лазаряна, 2, Днипро, Украина, 49010, тел. +38 (056) 373 15 89,
эл. почта ivzhuk@mail.ru, ORCID 0000-0002-3491-5976
2*Каф. «Электронныевычислительныемашины», Днепропетровскийнациональныйуниверситетжелезнодорожного
транспортаимениакадемикаВ. Лазаряна, ул. Лазаряна, 2, Днипро, Украина, 49010, тел. +38 (056) 373 15 89,
эл. почта klugran@i.ua, ORCID 0000-0001-9939-0755
ВЫБОР
ОПТИМАЛЬНЫХ
ПАРАМЕТРОВ
ИЗМЕРЕНИЯ
ЧАСТОТЫ
ВРАЩЕНИЯ
ВАЛА
ГИДРАВЛИЧЕСКОЙ
ПЕРЕДАЧИ
ТЕПЛОВОЗА
С
ИСПОЛЬЗОВАНИЕМ
МИКРОКОНТРОЛЛЕРА
Цель. Статья предусматривает нахождениерешения задачиразработки и усовершенствованиясредств измерения тахометрических данных ранее созданной информационно-измерительной системы испытаний гидравлических передач тепловозов путем обоснования оптимальной конструкции датчика и алгоритмов обработкисигналаотнего. Приэтомотталкиватьсянеобходимо, в первуюочередь, отвозможностимоди
-фикацииуже существующегостендаиспытанийгидравлическихпередачтепловозовнаДнепропетровском заводе по ремонту тепловозов «Промтепловоз». Методика. В работе исследователями была предложена методикамодификацииконструкциидатчикаиалгоритмаобработкиегосигналов. Онаопираетсянапреды
-сорнойавтоматизированнойсистемыстендовыхиспытанийгидравлическихпередачтепловозоввусловиях тепловозоремонтного завода. Обоснован выбор необходимого алгоритма измерений и количества зубьев датчика путем расчетов инструментальной и методической погрешностей. Также описаны исследования,
направленныенавыявлениеисточникапомехприизмеренияхчастотывращения, инайденорешениепоего устранению. Результаты.Дляспроектированного датчика частотывращения оптического типа на основе ужесуществующегодатчикаД-2ММУ-2 авторамибылвыполненанализзависимостиметодическойиинст
-рументальнойпогрешностей. Предложен, наосновеполученныхданных, болеерациональныйварианталго
-ритмарасчётачастотывращения, атакжеобоснованоколичествозубьевдискадатчика. Далеебылустанов
-леносновной источник помех измерений ибыл предложен способусовершенствования аппаратнойчасти стенда испытаний гидравлических передачтепловозов. Научная новизна. Были проведены исследования зависимостиметодическойи инструментальнойпогрешностейспроектированногодатчика частотывраще
-ния. Предложенымеханизмыфильтрациипомех, возникающихпрификсациичастотывращениядатчиком.
Дополнительныеисследования показалинеобходимость аппаратнойдоработки схемыформирователясиг
-нала. Практическаязначимость.Проведённыеисследованияпозволилиустановитьрациональноеколиче
-ствозубьевдискадатчика, чтодаловозможностьусовершенствоватьалгоритмизмерений. Такжебыловы
-полненоаппаратноеулучшениесхемыформирователясигналаотдатчика, чтопозволилоизбавитьсяотпо
-мех. Результатыизмеренийприисследованияхявляютсяисходнымиданнымидлявыполнениядальнейших исследованийсцельюопределениятехническогосостояниягидравлическойпередачиУГП 750-1200 вовре
-мязаводскихпослеремонтныхиспытаний.
Ключевые слова: тахометрический датчик; Д-2ММУ-2; гидравлическая передача; испытания
гидропередач; испытательныйстенд; информационно-измерительнаясистема
REFERENCES
1. Voskoboynikov, Y. Y., Gochakov, A. V., & Kolker, A. B. (2010). Filtratsii signalov i izobrazheniy: Fure i veyvlet algoritmy (s primerami v Mathcad). Novosibirsk: NSUACE.
2. Zhukovytskyi, I. V., & Kliushnyk, I. A. (2016). Vdoskonalennia metodiv ta zasobiv vymiriuvannia chastoty obertannia vala hidravlichnoi peredachi teplovoza z vykorystanniam mikrokontrolera. Proceedings of the X In-ternational Conference «Modern Information and Communication Technologies on a Transport, in Industry and Education», Dec. 14-15, 2016, Dnipro, Ukraine. 46-47.
3. Mamiy, A. R., & Tlyachev, V. B. (2005). Operatsionnyye usiliteli. Maikop: ASU. 4. Rabinovich, S. G. (1978). Pogreshnosti izmereniy. Leningrad: Energiya.
5. Sergienko, A. B. (2007). Tsifrovaya obrabotka signalov (2nd ed.). St. Petersburg: Piter.
6. Takhometry magnitoinduktsionnyye distantsionnyye TMi. (n.d.) Retrieved from http://sibspz.ru/pribory-dlya-izmereniya-parametrov-dvizheniya-takhometry/takhometry-magnitoinduktsionnye-distantsionnye-tmi
7. Carter, B. (2003). Op Amps for Everyone (2nd ed.). Texas, USA: Elsevier Science.
8. CD40106BM/CD40106BC. Hex Schmitt Trigger. (2011). Dallas, Texas: Texas Instruments Incorporated. Lit-erature Number: SNOS353B. Retrieved from http://www.ti.com/lit/ds/symlink/cd40106bm.pdf
9. Zhukovytskyy, I. V., Kliushnyk, I. A., Ochkasov, O. B., & Korenyuk, R. O. (2015). Information-Measuring Test System of Diesel Locomotive Hydraulic Transmissions. Science and Transport Progress, 5(59), 53-65. doi: 10.15802/stp2015/53159
10. LMx24-N, LM2902-N. Low-Power, Quad-Operational Amplifiers. (2016). Dallas, Texas: Texas Instruments Incorporated. Retrieved from http://www.ti.com/lit/ds/symlink/lm2902-n.pdf
11. Merry, R. J. E., Van de Molengraft, M. J. G., & Steinbuch, M. (2013). Optimal higher-order encoder time-stamping. Mechatronics, 23(5), 481-490. doi: 10.1016/j.mechatronics.2012.10.011
12. Zhang, L., Slaets, Р., & Bruyninckx, Н. (2012). An open embedded hardware and software architecture ap-plied to industrial robot control. Proceedings of the IEEE International Conference on Mechatronics and Au-tomation, Aug. 5-8, 2012. 1822-1828. doi: 10.1109/ICMA.2012.6285098
13. Zhukovytskyy, I. V., & Kliushnyk, I. A. (2016). Use of microcontroller for measuring shaft speed of diesel locomotive hydraulic transmission. Science and Transport Progress, 5(65), 43-53. doi 10.15802/stp2016/83990
Prof. V. V. Skalozub, D. Sc. (Tech.), (Ukraine); Prof. V. V. Tkachov, D. Sc. (Tech.), (Ukraine) recommended this article to be published