Copyright © 2016 Vilnius Gediminas Technical University (VGTU) Press Technika http://www.bjrbe.vgtu.lt
OF ROAD AND BRIDGE ENGINEERING ISSN 1822-427X / eISSN 1822-4288
2016 Volume 11(2): 144–152
doi:10.3846/bjrbe.2016.17 1. Introduction
Vehicle speed is one of main parameters describing driver behavior (Bifulco et al. 2015; Iodice, Senatore 2015) and it is of paramount importance as it affects the travel safe-ty level (Pariota et al. 2016; Sołowczuk 2011). There is a major concern among researchers on speed mitigating countermeasures (Montella et al. 2012, 2015) and recently some interesting studies based on driver simulator sys-tems have been presented (Galante et al. 2010; Montella et al. 2010). This technology appears to have the potential to investigate complex relationships between parameters affecting safety such as those related to friction (Baldoni et al. 2011; D’Apuzzo et al. 2012) or to road environment perception (Montella et al. 2010, 2011).
However, it has to be acknowledged that drivers’ speed is affected by several factors among which in-ve-hicle vibration may play a significant role. Most of speed reducing traffic calming countermeasures adopted nowa-days rely on vertical vibration level perceived by drivers
that is based on the dynamic interaction between the ve-hicle and the road roughness. On the other hand this lat-ter has to be carefully monitored and controlled as it is a key parameter in pavement managements systems since it influence riding comfort, pavement damage (D’Apuzzo et al. 2004, 2012) and Vehicle Operating Costs (Bennett, Greenwood 2001; Chandra 2004). In urban environment road roughness may also have an adverse effect since it increases ground vibration level induced by road traffic, similarly to what it may be observed for railway traffic (D’Apuzzo et al. 2008).
In detail, when a vehicle is traveling onto an irregular surface, as a results of the dynamic interaction, dynamic vertical forces are transmitted on pavement and in-vehicle vibrations are generated. Several studies have highlighted that dynamic vertical forces greatly reduce pavement ser-vice life as they may accelerate degradation of pavements (Abagnale et al. 2014; D’Apuzzo et al. 2004, 2012). On the other hand, vibrations transmitted to the vehicle are
A NEW APPROACH TO ASSESS THE INFLUENCE OF ROAD ROUGHNESS
ON DRIVER SPEED BEHAVIOR BASED ON DRIVING SIMULATOR TESTS
Mariano Pernetti1, Mauro D’Apuzzo2, Francesco Galante3
1Dept of Civil Engineering, Second University of Naples, Via Roma 29, 81031 Aversa (CE), Italy 2Dept of Civil and Mechanical Engineering, University of Cassino and Southern Lazio,
Via G. Di Biasio 43, 03043 Cassino (FR), Italy
3Dept of Civil, Architectural and Environmental Engineering, University of Naples Federico II, Via Claudio 21, 80125 Naples, Italy
E-mails: 1pernetti@unina.it; 2dapuzzo@unicas.it; 3francesco.galante@unina.it
Abstract. Vehicle speed is one of main parameters describing driver behavior and it is of paramount importance as it affects the travel safety level. Speed is, in turn, affected by several factors among which in-vehicle vibration may play a significant role. Most of speed reducing traffic calming countermeasures adopted nowadays rely on vertical vibration level perceived by drivers that is based on the dynamic interaction between the vehicle and the road roughness. On the other hand, this latter has to be carefully monitored and controlled as it is a key parameter in pavement managements systems since it influences riding comfort, pavement damage and Vehicle Operating Costs. There is therefore the need to analyse the trade-off between safety requirements and maintenance issues related to road roughness level. In this connection, experimental studies aimed at evaluating the potential of using road roughness in mitigating drivers’ speed in a controlled environment may provide added value in dealing with this issue. In this paper a new research methodology making use of a dynamic driver simulator operating at the TEST Laboratory in Naples is presented in order to investi-gate the relationship between the driver speed behavior on one hand, and the road roughness level, road alignment and environment, vehicle characteristics on the other. Following an initial calibration phase, preliminary results seem fairly promising since they comply with the published data derived from scientific literature.
related to the riding comfort perceived by the driver and to the vehicle operating costs such as fuel consumption, maintenance and repair costs (Bennett, Greenwood 2001; Chandra 2004).
Ride quality is therefore related to in-vehicle vibra-tion that, in turn, is dependent on the level of road rough-ness, on the speed chosen by the driver and on the inertial and mechanical characteristics of the vehicles. As a matter of fact, some authors (Bennett, Greenwood 2001; Chandra 2004) have underlined that, under certain road roughness conditions, drivers may be induced to vary their speed in order to reach an acceptable in-vehicle vibration level ac-cording to their subjective exposure threshold and to the mechanical characteristic of the vehicle.
There is therefore the need to detect the trade-off between safety requirements and maintenance issues rela-ted to road roughness level. In this connection, experimen-tal studies aimed at evaluating the potential of using road roughness in mitigating drivers’ speed in a controlled envi-ronment may provide added value in dealing with this issue. In this paper, a further contribution on this issue is presented. In detail, relationship between driver speed and road roughness level has been investigated by means of the VERA Dynamic Driving Simulator (DDS) currently operating at the TEST (Technology Environment Safety Transport) Laboratory in Naples. The DDS employs a real car fixed on a 6 degrees of freedom (d.o.f.) motion plat-form and it is able to reproduce most of the accelerations the occupants feel, in particular those arising from turning and braking maneuvers and from dynamic interaction with pavement surface singular irregularities such as tren-ches, potholes, road humps, etc. A team of researchers from University of Naples “Federico II”, Second University of Naples, University of Cassino and Southern Lazio and the Oktal Company has improved the system allowing the implementation of a module simulating vehicle vibrations induced by distributed irregularities.
In this paper the development and the implementa-tion of the vibraimplementa-tion simulaimplementa-tion module and the results from preliminary experimental calibration procedures are conveniently reported. According to the first calibration approach, the real vertical acceleration level of the mo-tion platform has been compared to that provided by the vibration simulation module evaluating the dynamic in-teraction between the vehicle and the road roughness. A second calibration phase has been carried out by means of driving sessions performed by expert users of DDS. At the end of the paper, results from a preliminary experimental investigation aimed at studying the effects of the vehicle vibrations on driver behavior due to vibration induced by road roughness is briefly presented.
2. Past experiences in riding comfort and driver behavior
It is well known that road pavement surface is not a per-fect flat but includes irregularities that can be singular or distributed (Fernando, Rawool 2005). Typical examples of
pavement surface singular irregularities are trenches, local depressions and potholes. Within an urban environment, manholes and traffic calming devices can also be regarded as singular road profile defects. Distributed irregularities are always present in every pavement surface. They can be ascribed to the unavoidable defects in the road construc-tion process (Iodice, Senatore 2013) and to the progressive degradation of the materials and of the structural capacity of pavements.
Vehicles moving onto the road surface are dynamically excited by the variations of the elevations of road profile and, as a result of this, vibrations are transmitted by vehicle body to car occupants. The discomfort drivers feel because of these vibrations is one of the key factors in the speed perception and choice. Indeed, it is a common experience that drivers select different speeds in relation to the vibration level they feel because of the dynamic interaction with road pavement profile (Bennett, Greenwood 2001; Chandra 2004).
Pioneering work on this subject has been carried out by Karan et al. (1976) where speed measurements and traffic counts were made on 72 sites covering a wide range of roughness values but with homogeneous geo-metric characteristics (level and tangent sections). Several regression models have been proposed relating mean speed with measured roughness level (expressed in terms of Rid-ing Comfort Index, RCI), volume to capacity ratio and site speed limits. Comparison with the another previously de-veloped prediction model is also presented.
A huge amount of data on this issue has been subse-quently collected by World Bank within the development of the Highway Design and Maintenance Standards (HDM) model. Extensive experimental campaigns have been car-ried out in Kenya, Brazil, Caribbean and India, yielding several relationship between vehicle speed and roughness level (expressed in terms of International Roughness Index, IRI) for paved and unpaved road. An overall relationship has been subsequently proposed linking vehicle speed with roughness level and with the maximum value of the Aver-age Rectified Velocity, namely ARVmax, that it is claimed to better describe the perceived driving comfort level.
Within the release of the new framework of HDM models, an extensive critical review of vehicle speed vs. roughness relationships has been presented, highlighting major drawbacks of previous works on this subject. How-ever, the final model proposed is still that released in the previous HDM version but it is suggested the use of an updated value of ARVmax derived from an Australian cali-bration study (Bennett, Greenwood 2001)
Summarizing the research carried out on this subject, it has to be underlined that the main weak point of most of experimental investigations is that driver behavior, and specifically vehicle speed, is affected by a huge amount of factors and therefore it appears extremely difficult to select a set of experimental sites that can allow to highlight the contribution of road roughness on vehicle speed. Speed prediction derived from empirical models may be biased.
In this connection, the use of a DDS may offer an economic, feasible and effective solution, since it allows to develop repeated and “tailored” driving scenarios where different speed constraints can be easily and conveniently “switched off”.
As far as the use of DDS in riding comfort research is concerned, it is worth to be mentioned the recent ex-periences developed with the Kitami Institute of Technol-ogy Dynamic Driving Simulator (KITDDS) reported in (Kawamura et al. 2008). In these works, in order to inves-tigate relationship between road roughness and driving comfort, several test subjects performed a ride with the KITDDS where an artificial vibration derived from a ve-hicle model traveling onto an measured road profile with different roughness level is inputted. However, under the riding simulation mode, the test subjects were not free to interact with the driving simulator and therefore were not able to modify their speed in order to reach an acceptable in-vehicle vibration level. As previously stated, the DDS described in the followings has been recently improved in order to simulate vehicle vibrations induced by traveling onto a pavement surface with distributed irregularities. 3. The VERA driving simulator
As previously highlighted, the riding comfort arising from vibration generated by traveling onto irregular pavement surfaces represents one of the key factors in the speed per-ception and choice. In conventional static driving simula-tors where these vibrations are not provided it seems to
drive on “silk” and this induces driver to select speed val-ues that may be fairly higher than those actuated in the real environment (Kemeny, Panerai 2003). To overcome these limitations a dynamic driving simulator can be employed.
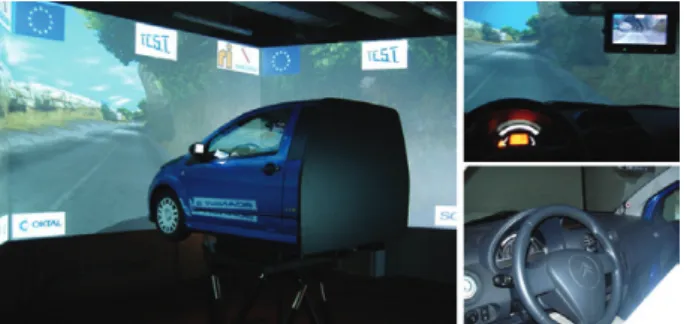
The VERA (Virtual Environment for Road sAfety; Montella et al. 2011) dynamic-driving simulator with a hexapod motion platform is operating at the TEST (Technology Environment Safety Transport) Laboratory (Fig. 1). The simulator is located in the Engine Institute of the C.N.R. (National Research Council) facilities in Na-ples, inside a 115 m² simulation room; a supervision room and a briefing room are also present.
Three flat screens (dimension: 3×4 m) are fixed at the simulation room floor in order to surround the motion platform. The visual scene is projected to a high-resolution three channel 180°×50 forward field of view with rear and side mirror views replaced by 6.5” LCD monitors.
The visual system allows a resolution of 1400×1050 pix-els for each channel and a refresh rate of 60 Hz. A half Citroën C2 vehicle body with realistic operation of controls and instrumentation (Fig. 1) is connected to the motion platform. The audio system can reproduce various sounds that can normally be heard while driving, including the rolling, engine and exhaust noise produced by the driving vehicle as well as the surrounding sound field from other vehicles.
Feedback is provided by a force feedback system on the steering and a 6 d.o.f. electric motion platform. The torque feedback at the steering wheel is provided via a mo-tor fixed at the end of the steering column. The motion system consists of a hexapod with six electric actuators, able to reproduce most of the accelerations that real car oc-cupants feel, in particular those arising from turning and braking maneuvers, from tyre behavior in on-center han-dling manoeuvres (Baldoni et al. 2011) and from dynamic interaction between vehicle and pavement surface singular irregularities like trenches, potholes, curbs etc. A team of researchers from University of Naples “Federico II”, Sec-ond University of Naples, University of Cassino and the Oktal Company has improved the system allowing simu-lation of vibrations induced by distributed irregularities. Table 1 shows the kinematic operation limits of the mo-tion system.
The VERA driving simulator is running on a SCANeR©II framework which is a set of distributed, multi-platform application software allowing the user to build set up / assemble and implement a vehicle simulation. Galante et al. (2010) performed a validation of the VERA driving Fig. 1. The VERA driving simulator
Table 1. Kinematic limits of the motion system
Translation Position,mm Speed,mm/s Acc.,g Rotation Position,° Speed,°/s Acc.,°/s2
Longitudinal –491/+432 718 ±1.39 Pitch –24/+25 48 595
Lateral ±425 712 ±1.20 Roll ±25 50 575
simulator for speed data, comparing real-world and driv-ing simulator speed. The vibration simulation module that has been ad hoc developed and implemented in the DSS can be split in three sub-modules: the road roughness genera-tion sub-module, the dynamic interacgenera-tion sub-module and the transfer acceleration sub-module.
The first sub-module splits, if needed, the test track in sections having different magnitude of road surface rough-ness. At this stage of system development, in every section, an artificial road profile is generated for each wheel of the front axle from an arbitrary Power Spectral Density (PSD) function of the vertical elevation of road surface. As a mat-ter of fact, according to the conventional mathematical modeling approach, road profile can be mainly described into two ways: deterministic and stochastic. In the former way, the discrete function describing the road profile is known whereas in the latter way the road profile is treated as a surface is employed.
If the PSD of a longitudinal road unevenness is known, it is possible to generate an artificial road profile by means of the following relationship between the spectral content and the PSD function of a road profile (D’Apuzzo et al. 2004):
, (1)
where y(x) − the elevation of longitudinal road profile at station x, m; nmax − the maximum theoretical sampling spatial frequency, cycles/m; ∆n − the discrete frequency band in the frequency domain, cycles/m; Gd− the value of the PSD function for the ni = i ⋅∆n spatial frequency, m3;
ϕi − a random phase angle following an uniform probabi-listic distribution within the 0 ÷ 2π range, radians.
Once the artificial profile has been generated, road elevation is therefore updated based on the instantaneous vehicle position on the pavement surface according to the speed chosen by the driver. For a specific vehicle speed, the same artificial road profiles generated for the front axle are conveniently shifted in the time domain for the rear axle according to a time lag that is dependent on the wheel base length and on the instantaneous vehicle speed itself.
It has to be underlined that, if the influence of rough-ness on driver behavior has to be investigated, it is necessa-ry to provide profile data with steady statistical and spectral characteristics in order to reduce biased results and there-fore the generation of an artificial profile by means of a PSD function appears to be the most effective solution. As a matter of fact, measured road surface profiles can hardly be considered as stationary and ergodic but they can be reduced to several stationary sections once that roughness singularities have been conveniently detected and remo-ved (Rouillard et al. 2001).
However, further improvements are obviously expec-ted in order to implement measured pavement profile data. In the second sub-module, dynamic interaction betwe-en the vehicle and the road surface profile is evaluated in
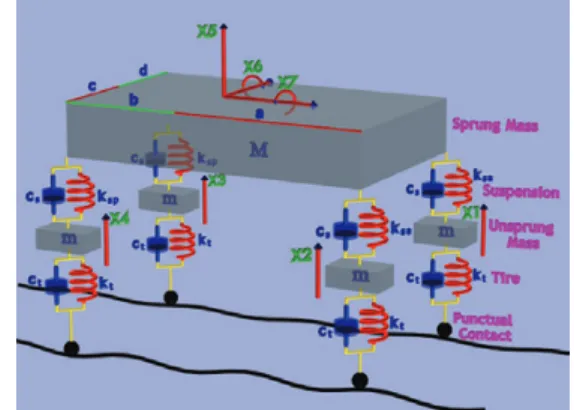
order to calculate the accelerations of the vehicle induced by the road unevenness. The vehicle model (Fig. 2) is a discrete system with lumped masses connected by springs and non-linear dashpots that is conventionally used in mechanical en-gineering.
Vehicle dynamics is simulated by solving the non-li-near differential equation set describing the vehicle mo-tion by means of an explicit integramo-tion scheme.
The full car model adopted in the simulation has 7 degrees of freedom, namely: the vertical motion of the right front tire, X1, the motion of the left front tire, X2, the motion of the right rear tire, X3, the motion of the left rear tire, X4, the bounce motion of the vehicle body, X5, the pitch motion of the vehicle body, X6, and the roll motion of the vehicle body, X7, respectively. In detail, the rigid ve-hicle body is connected to the wheels through the suspen-sion system that is modeled by means of linear springs in parallel with non-linear dashpots.
The frontal wheels and the rigid body are also con-nected through a torsion bar modeled by means of a spring and a dashpot in parallel, the same model layout has been adopted for the rear wheels. Vehicle wheels are connected to road surface profile through spring-dashpot systems accounting for tire vertical stiffness and damping.
The third sub-module acquires the acceleration si-gnal provided by the previous one and adds it to the acce-leration derived from the driving behavior in the driving simulator session.
The overall module was implemented in the VERA dri-ving simulator. The software that was written in C++ reads data from the “Trydim” dynamic module of SCANeR©II using its API and calculates using the previously descri-bed methodology, the position of the cockpit center with respect to the road surface pavement. The software then transmits this data joined with those provided by the vibra-tion simulavibra-tion sub-module to the platform, allowing the representation of the platform response to different road roughness level.
It is worth to be observed that most of the studies on whole body vibration and exposure limits are usually carried out on subjects seating on vibrating chairs. The system de-veloped may offer a more effective approach to this problem since it allows to evaluate in-vehicle whole body vibration on subjects that are contemporarily involved in a drive task.
4. Description of the experimental investigation
4.1. Preliminary system calibration
The overall module set up was calibrated according to two main approaches.
According to the first calibration approach, the real vertical acceleration level of the motion platform has been compared to that provided by the vibration simula-tion module evaluating the dynamic interacsimula-tion between the vehicle and the road roughness. A second calibration phase has been carried out by means of driving sessions performed by expert users of DDS, in order to have a glob-al rating of the improved driving simulator.
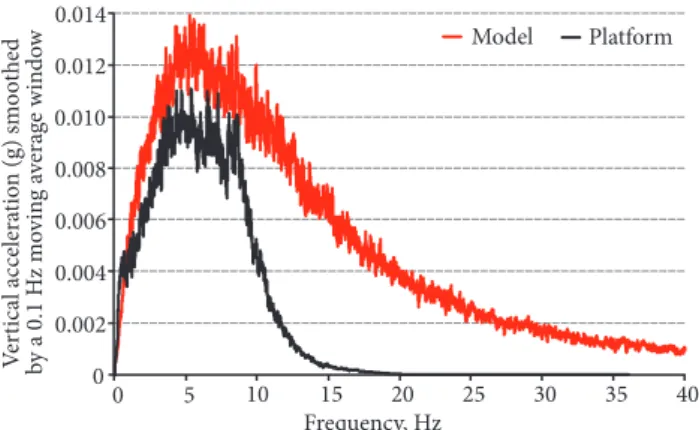
In detail, the first calibration phase was carried out by driving automatically (driverless mode) the simulator on three 10 km long straight roads characterized by 2, 4 and 6 m/km IRI values respectively. During each session, the real vertical acceleration of the motion platform and the simulated one provided by the dynamic model sub-mod-ule were recorded. The acceleration of the platform was acquired by means of an inertial sensor mounted on the chassis near the center of the gravity of the vehicle body. In Fig. 3a comparison in the frequency domain between the platform and the simulated acceleration for an IRI value equal to 4 m/km is showed.
It is worth noticing that the two spectra appear to be comparable in the 0−9 Hz range, whereas the plat-form acceleration frequency content quickly drops to zero for higher frequencies. However the perception of vi-brations should be rather close to that sensed in the real
environment since, according to the mechanical proper-ties of conventional seats and the mass of adult users, all of the accelerations spectral content higher than 10 Hz is characterized by a lower gain.
Following this phase, a further calibration test of the improved system has been carried out by means of six Eu-ropean experts − DDS drivers, not tied to the project, hav-ing at least 7-year experience in the field of drivhav-ing simu-lation. The track was a10 km long rural road. During the test, each expert driver, met only two types of road surface profiles (IRI 1.5 m/km and IRI 6 m/km). Each participant was asked to fill a questionnaire on his/her driving percep-tion. Table 2 shows the results of the questionnaire.
The preliminary results obtained seem to indicate that the framework developed is able to effectively reproduce the accelerations the drivers sense in real environment. 4.2. Experimental trial
The aim of experimental investigation was to evaluate and to compare the effects of vibrations due to road sur-face profiles with different roughness on driver behavior. To this purpose, three road profiles have been generated by rectified smoothed PSD ISO functions (ISO 8608:1995. Mechanical Vibration − Road Surface Profiles − Reporting of Measured Data) according to the following IRI values: 2 m/km, 4 m/km and 6 m/km.
The subjects in the study were drawn from the stu-dent and staff population of the University of Study of Na-ples (Italy). Ten subjects (seven males and three females), ranging from 24 to 46 years old, were involved in the stu-dy. All participants had a valid driving license for at least five years and were considered as experienced drivers sin-ce they declared an everyday car usage. Four of the ten participants had drivers experience in off-road driving. Before the experiment they signed an informed consent form and they have no information on the real purpose of the experiment.
Every participant had a familiarization session (8−10 minutes) prior to the test. The aim was to discover the simulation environment in advance in order to re-duce stress and simulator effects during the real test and to instruct them to control the simulated vehicle by us-ing steer, pedals (brake and accelerator) and gear box. It also permitted to exclude participants suffering from mo-tion sickness. This session was conducted in the similar conditions as the experimentation: presence of a co-pilot, similar simulated track. In the familiarization driving, no vibrations due to road roughness was rendered to the driving simulator cockpit.
Each participant drove the same virtual rural road network. The road network was about 20 km long with no posted speed limit. The whole road was divided into sections of equal length; at each section was randomly as-signed a different road surface profile artificially generated by means of Eq (1) assuming a minimum and a maximum spatial frequency respectively equal to 0.0033 cycles/m i.e. Fig. 3. Comparison of the spectrum of accelerations for IRI 4 m/km
Table 2. Results of the questionnaire on irregularities
Question Answer
Realism of irregularities Fair/Very good
Physical comfort of irregularities Very good Improving of speed perception Yes Driving with irregularities Quite easy Realism of passing between different
surface profiles Very good
and 5 cycles/m i.e. a wavelength ranging from 0.2 m to 300 m (Figs 4 and 5) and corresponding to:
1. IRI 0 m/km: totally flat surface (no irregularities – experimental module inactive);
2. IRI 2 m/km: newly constructed pavement surface; 3. IRI 4 m/km: medium aged pavement surface (older pavements with surface imperfections);
4. IRI 6 m/km: poor pavement surface (maintained unpaved roads with frequent minor depression).
It has to be underlined that, although simulations with zero IRI surfaces may appear rather unrealistic since they do not reflect actual pavement conditions, they are highly significant as they provide immediate evidence for a “shifted” driver speed behavior between realistic driving conditions and conventional driving simulator scenarios where road roughness effects are usually neglected.
Gentle curves with radius ranging from 400 m to 600 m forced the driver to keep an active steering and speed control. Subsequent curves were separated by 1200 m long tangent sections. Virtual road platform had two 3.75 m wide lanes, one in each direction with standard lane marking, no road signs, and 0.5 m wide shoulders with superelevation in curves according geometric design standards. Along the right and the left side of the track road poles were set every 50 m. The surrounding virtual environment mimicked a ru-ral road layout. No vehicle was expected in the same and in the opposite direction of the driver for the entire test.
Participants were instructed to drive as naturally as possible and to consider to be the owner of the vehicle. No speed restrictions were imposed.
5. Preliminary results
To evaluate the influence of the cockpit vibrations due to road irregularities on the behavior of the subjects driving the simulator, the following data were recorded: kilometric position of vehicle, longitudinal speed, brake pedal posi-tion and accelerator pedal posiposi-tion. The data analysis fo-cused on speed-choice, reaction time and deceleration due to the road roughness level longitudinal variation. No sub-ject lost vehicle control during the test.
5.1. Speed
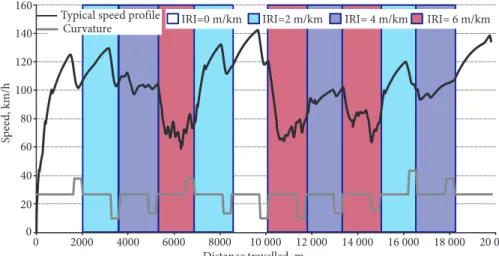
A typical speed profile that depicts the effects of the dif-ferent magnitude of the road irregularities is reported in Fig. 6. The highest speeds are reached in sections where road roughness has not been reproduced (Table 3). The
Fig. 4. Tested road profile for chosen IRI value
Fig. 5. IRI value and pavement condition
subject dramatically reduces his speed in the section with higher values of IRI namely 4 m/km and 6 m/km. The change in the speed was not significant for lower IRI val-ues. A clear dependence of the relative speed-choice on the downward and upward IRI value can be detected.
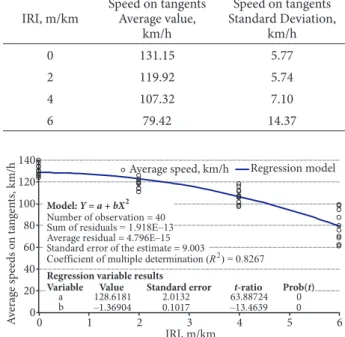
A regression model highlighting the relationship be-tween preferred speed-choice in the tangent sections and the related IRI value is reported in the Fig. 7 with related statistics. The model seems to confirm the influence of the magnitude of the irregularities on the driver selected speed. Furthermore, the relationship between road rough-ness and speed has been analyzed using a repeated mea-sures Analysis of Variance (ANOVA) with IRI level follow-ing the Mauchly’s test for sphericity that yielded positive
results. The threshold for statistical significance was set at 0.05. Results from ANOVA indicated a reliable IRI level ef-fect (F = 3.454E3, p < 0.0001). Also the post hoc pairwise comparison showed significant speed difference as a func-tion of IRI level.
As it can be easily observed from the Fig. 7, speed slightly decreases moving from IRI 0 m/km to IRI 2 m/km whereas significant variations (about 25 km/h) occurred passing from IRI 0 m/km to IRI 4 m/km and a large reduction (about 52 km/h) in speed is visible for a pavement with IRI 6 m/km. In Fig. 8 mean speed values de-rived from simulations as a function of road roughness level are compared with similar data derived by technical litera-ture. Conversion of the several road roughness descriptors employed in the different sources to IRI have been made in order to express road unevenness on a common basis. It can be easily observed that DDS speed values appears to be fairly higher than those provided by empirical on-site in-vestigation (Chandra 2004; Karan et al. 1976) whereas are lower than those proposed by latest HDM model. It has to be highlighted that this latter model is claimed by authors to correctly represent the unique roughness contribution on driver behavior within a more complex probabilistic speed prediction model taking into account speed constraints re-lated to the road roughness, the desired speed, the driving power, the braking power and the road curvature by means of an harmonic mean; in other terms, the depicted relation-ship should describe the speed behavior when it is solely re-lated to roughness (Bennett, Greenwood 2001) and it is not affected by any other external constraining factor; in this connection it can be regarded as a sort of theoretical or “ide-al” maximum speed that cannot be reached in real driving conditions. It is therefore reasonable to assume that speed values predicted by previous empirical models and, to a lesser extent, by the DDS are always fairly biased by these constraints. As a matter of fact, in the model proposed by Karan et al. (1976) there is an explicit contribution of the speed limit; furthermore, it may be argued that traffic con-ditions could have affect somehow driver behavior, since speed measurements have been carried out when low (but not negligible) volume to capacity ratios were reached. In order to overcome these limitations, as suggested by sev-eral authors, before-and-after studies are planned to be implemented in the DDS in the future, by implementing realistic traffic conditions and speed limits.
5.2. Reaction time and deceleration
The reaction time (RT) examined within this study is the time between the beginning of a road section with higher IRI value and the moment the drivers begin to reduce the speed. From IRI 0 m/km to IRI 2 m/km, there was no re-action. From IRI 2 m/km to IRI 4 m/km, the average RT was 1.1 sec with an average deceleration of 3.2 m/s2. From IRI 4 m/km to IRI 6 m/km, the average RT was quite similar to the previous with an average deceleration of 4.5 m/s2. The change from IRI 0 m/km to IRI 6 m/km was remarkable: the average RT and deceleration were 0.9 s and 5.4 m/s2 respectively.
Table 3. Speed on tangents as a function of IRI value
IRI, m/km Speed on tangents Average value, km/h
Speed on tangents Standard Deviation,
km/h
0 131.15 5.77
2 119.92 5.74
4 107.32 7.10
6 79.42 14.37
Fig. 7. Correlation between average speed and IRI value
6. Conclusions
In this paper a simulation module allowing the reproduc-tion of the vibrareproduc-tions due to distributed irregularities in the TEST dynamic driving simulator has been described. The core of the model is represented by a non-linear full car model with seven degrees of freedom.
1. By comparing the acceleration data acquired from the motion platform and those provided by the simulation model, it has been demonstrated that a good agreement in the 0–9 Hz range can be obtained between the real and im-posed acceleration level. This may be regarded as a rather good result since most of the driver seats usually attenu-ates frequencies higher than 10 Hz.
2. Furthermore, a group of European dynamic driving simulator experts, not tied to the project, drove the system and expressed a positive opinion with reference to both the improving of the speed perception and the realism of the irregularities.
3. Finally, preliminary results of an experimental cam-paign with few participants showed a real influence of the road roughness level on the behavior of the subjects which drove the simulator, especially in the speed-choice process.
4. Furthermore, a comparison with available speed-roughness models has been carried out.
5. Preliminary results seem to indicate that since speed-roughness models have been developed according to slightly different experimental conditions (as far as traf-fic and speed limit are concerned), data derived from dy-namic driving simulations appear to be fairly consistent to those derived from technical literature. However, it has to be acknowledged that longitudinal roughness is only one of the vibration sources that is “sensed” by the driver therefore it is planned to develop a more accurate 3D road surface models in future research that will be carried out in order to confirm and extend the results obtained in this work. Acknowledgements
David Ganieux, Alexandre Troale and Gilles Gallée of OK-TAL Company and Prof. Vincenzo Torrieri of Department of Civil, Architectural and Environmental Engineering (DI-CEA) of University of Naples are gratefully acknowledged for their support in this research.
References
Abagnale, C.; Cardone, M.; Iodice, P.; Strano, S.; Terzo, M. 2014. Theoretical and Experimental Evaluation of a Chain Strength Measurement System for Pedelecs, Engineering Letters 22(3): 102–108.
Baldoni, F.; Galante, F.; Pernetti, M.; Russo, M; Terzo, M; Tos-cano, M. 2011. Tuning and Objective Performance Evaluation of a Driving Simulator to Investigate Tyre Behaviour in On-Center Handling Manoeuvres, Vehicle System Dynamics 49: 1423–1440. http://dx.doi.org/10.1080/00423114.2010.527353 Bennett, C. R.; Greenwood, I. D. 2001. Modelling Road User and Environmental Effects in HDM-4, HDM-4 Highway Develop-ment and ManageDevelop-ment. Vol. 7, International Study of
High-way Development and Management, World Roads Associa-tion, Paris.
Bifulco, G. N.; Galante, F.; Pariota, L.; Russo Spena, M. 2015. A Linear Model for the Estimation of Fuel Consumption and the Impact Evaluation of Advanced Driving Assistance Sys-tems, Sustainability 7(10): 14326–14343.
http://dx.doi.org/10.3390/su71014326
Chandra, S. 2004. Effect of Road Roughness on Capacity of Two-Lane Roads, Journal of Transportation Engineering 130(3): 360–364.
http://dx.doi.org/10.1061/(ASCE)0733-947X(2004)130:3(360) D’Apuzzo M.; Festa B.; Giuliana, G.; Mancini, L.; Nicolosi, V. 2012.
The Evaluation of Runway Surface Properties: a New Ap-proach, Procedia: Social & Behavioral Sciences 53: 1193–1202. http://dx.doi.org/10.1016/j.sbspro.2012.09.968
D’Apuzzo, M.; Aiello, V.; Boiero, D.; Socco, L.; V., Silvestri, F. 2008. Experimental and Numerical Analysis of Vibrations Induced by Underground Trains in Urban Environment, Journal of Structural Control and Health Monitoring 15(3): 315–348. http://dx.doi.org/10.1002/stc.247
D’Apuzzo, M.; Nicolosi, V.; Mattarocci, M. 2004. Predicting Rough-ness Progression on Asphalt Pavements, in Proc. of the II Inter-national SIIV Congress, 27–29 October 2004, Florence, Italy. Fernando, E.; Rawool, S. 2005. Methodology for Detection of
De-fect Locations in Pavement Profile, Transportation Research Record 1905: 141–147. http://dx.doi.org/10.3141/1905-16 Galante, F.; Mauriello, F.; Montella, A.; Pernetti, M.; Aria, M.;
D’Ambrosio, A. 2010. Traffic Calming along Rural Highways Crossing Small Urban Communities: Driving Simulator Ex-periment, Accident Analysis and Prevention 42: 1585–1594. http://dx.doi.org/10.1016/j.aap.2010.03.017
Karan, M. A.; Haas, R.; Kher, R. 1976. Effects of Pavement Rough-ness on Vehicle Speeds, Transportation Research Record 602: 122–127.
Kawamura, A.; Ishida, T.; Tomiyama, K. 2008. Quantitative Eval-uation of Ride Comfort using a Driving Simulator, in Proc. of the 87th Transportation Research Board Annual Meeting (TRB
2008), 13–17 January 2008, Washington, D.C., USA.
Kemeny, A.; Panerai, F. 2003. Evaluating Perception in Driving Simulation Experiments, Trends in Cognitive Sciences 7(1): 31–37. http://dx.doi.org/10.1016/S1364-6613(02)00011-6 Iodice, P.; Senatore, A. 2015. Exhaust Emissions of New
High-Performance Motorcycles in Hot and Cold Conditions, In-ternational Journal of Environmental Science and Technology 12(10): 3133–3144.
http://dx.doi.org/10.1007/s13762-014-0741-6
Iodice, P.; Senatore, A. 2013. Road Transport Emission Invento-ry in a Regional Area by Using Experimental Two-Wheelers Emission Factors, in Proc. of the 2013 World Congress on En-gineering, 3–5 July 2013, London, United Kingdom.
Montella, A.; Galante, F.; Mauriello, F.; Pariota, L. 2015. Effects of Traffic Control Devices on Rural Curve Driving Behavior, Transportation Research Record 2492: 10–22.
http://dx.doi.org/10.3141/2492-02
Montella, A.; Persaud, B.; D’Apuzzo, M.; Imbriani, L. 2012. Safety Evaluation of Automated Section Speed Enforcement System, Transportation Research Record 2281: 16–25.
Montella, A.; Aria, M.; D’Ambrosio, A.; Galante, F.; Mauriello, F.; Pernetti, M. 2011. Simulator Evaluation of Drivers’ Speed, Deceleration and Lateral Position at Rural Intersections in Relation to Different Perceptual Cues, Accident Analysis and Prevention 43: 2072–2084.
http://dx.doi.org/10.1016/j.aap.2011.05.030
Montella, A.; Aria, M.; D’Ambrosio, A.; Galante, F.; Mauriello, F.; Pernetti, M. 2010. Perceptual Measures to Influence Operat-ing Speeds and Reduce Crashes at Rural Intersections: Driv-ing Simulator Experiment, Transportation Research Record 2149: 11–20. http://dx.doi.org/10.3141/2149-02
Pariota, L.; Bifulco, G. N.; Galante, F.; Montella, A.; Brackstone, M. 2016. Longitudinal Control Behaviour: Analysis and
Model-ling Based on Experimental Surveys in Italy and the UK, Ac-cident Analysis and Prevention 89: 74–87.
http://dx.doi.org/10.1016/j.aap.2016.01.007
Rouillard, V.; Bruscella, B.; Sek, M. 2001. Simulation of Road Surface Profiles, Journal of Transportation Engineering 127: 247–253. http://dx.doi.org/10.1061/(ASCE)0733-947X(2001)127:3(247) Sołowczuk, A. 2011. Estimation of Free-Flow Speeds on Rutted As-phalt Two-Way, Two-Lane Roads with the Soft Shoulders, The Baltic Journal of Road and Bridge Engineering 6(3): 201–218. http://dx.doi.org/10.3846/bjrbe.2011.26